Races in Pine Castle, Florida (FL) Detailed Stats
Data:
Races - White alone (%)
Races - White alone (% change since 2000)
Races - Black alone (%)
Races - Black alone (% change since 2000)
Races - American Indian alone (%)
Races - American Indian alone (% change since 2000)
Races - Asian alone (%)
Races - Asian alone (% change since 2000)
Races - Hispanic (%)
Races - Hispanic (% change since 2000)
Races - Native Hawaiian and Other Pacific Islander alone (%)
Races - Native Hawaiian and Other Pacific Islander alone (% change since 2000)
Races - Two or more races(%)
Races - Two or more races(% change since 2000)
Races - Other race alone (%)
Races - Other race alone (% change since 2000)
Racial diversity
Place of birth - Born in state of residence (%)
Place of birth - Born in state of residence (%) - White
Place of birth - Born in state of residence (%) - Black or African American
Place of birth - Born in state of residence (%) - Asian
Place of birth - Born in state of residence (%) - Hispanic or Latino
Place of birth - Born in state of residence (%) - American Indian and Alaska Native
Place of birth - Born in state of residence (%) - Multirace
Place of birth - Born in state of residence (%) - Other Race
Place of birth - Born in other state (%)
Place of birth - Born in other state (%) - White
Place of birth - Born in other state (%) - Black or African American
Place of birth - Born in other state (%) - Asian
Place of birth - Born in other state (%) - Hispanic or Latino
Place of birth - Born in other state (%) - American Indian and Alaska Native
Place of birth - Born in other state (%) - Multirace
Place of birth - Born in other state (%) - Other Race
Place of birth - Native, outside of US (%)
Place of birth - Native, outside of US (%) - White
Place of birth - Native, outside of US (%) - Black or African American
Place of birth - Native, outside of US (%) - Asian
Place of birth - Native, outside of US (%) - Hispanic or Latino
Place of birth - Native, outside of US (%) - American Indian and Alaska Native
Place of birth - Native, outside of US (%) - Multirace
Place of birth - Native, outside of US (%) - Other Race
Place of birth - Foreign born (%)
Place of birth - Foreign born (%) - White
Place of birth - Foreign born (%) - Black or African American
Place of birth - Foreign born (%) - Asian
Place of birth - Foreign born (%) - Hispanic or Latino
Place of birth - Foreign born (%) - American Indian and Alaska Native
Place of birth - Foreign born (%) - Multirace
Place of birth - Foreign born (%) - Other Race
Residents speaking English at home (%)
Residents speaking English at home - Born in the United States (%)
Residents speaking English at home - Native, born elsewhere (%)
Residents speaking English at home - Foreign born (%)
Residents speaking Spanish at home (%)
Residents speaking Spanish at home - Born in the United States (%)
Residents speaking Spanish at home - Native, born elsewhere (%)
Residents speaking Spanish at home - Foreign born (%)
Residents speaking other language at home (%)
Residents speaking other language at home - Born in the United States (%)
Residents speaking other language at home - Native, born elsewhere (%)
Residents speaking other language at home - Foreign born (%)
Marital status - Never married (%)
Marital status - Now married (%)
Marital status - Separated (%)
Marital status - Widowed (%)
Marital status - Divorced (%)
Ancestries Reported - Arab (%)
Ancestries Reported - Czech (%)
Ancestries Reported - Danish (%)
Ancestries Reported - Dutch (%)
Ancestries Reported - English (%)
Ancestries Reported - French (%)
Ancestries Reported - French Canadian (%)
Ancestries Reported - German (%)
Ancestries Reported - Greek (%)
Ancestries Reported - Hungarian (%)
Ancestries Reported - Irish (%)
Ancestries Reported - Italian (%)
Ancestries Reported - Lithuanian (%)
Ancestries Reported - Norwegian (%)
Ancestries Reported - Polish (%)
Ancestries Reported - Portuguese (%)
Ancestries Reported - Russian (%)
Ancestries Reported - Scotch-Irish (%)
Ancestries Reported - Scottish (%)
Ancestries Reported - Slovak (%)
Ancestries Reported - Subsaharan African (%)
Ancestries Reported - Swedish (%)
Ancestries Reported - Swiss (%)
Ancestries Reported - Ukrainian (%)
Ancestries Reported - United States (%)
Ancestries Reported - Welsh (%)
Ancestries Reported - West Indian (%)
Ancestries Reported - Other (%)
Geographical mobility - Same house 1 year ago (%)
Geographical mobility - Same house 1 year ago (%) - White
Geographical mobility - Same house 1 year ago (%) - Black or African American
Geographical mobility - Same house 1 year ago (%) - Asian
Geographical mobility - Same house 1 year ago (%) - Hispanic or Latino
Geographical mobility - Same house 1 year ago (%) - American Indian and Alaska Native
Geographical mobility - Same house 1 year ago (%) - Multirace
Geographical mobility - Same house 1 year ago (%) - Other Race
Geographical mobility - Moved within same county (%)
Geographical mobility - Moved within same county (%) - White
Geographical mobility - Moved within same county (%) - Black or African American
Geographical mobility - Moved within same county (%) - Asian
Geographical mobility - Moved within same county (%) - Hispanic or Latino
Geographical mobility - Moved within same county (%) - American Indian and Alaska Native
Geographical mobility - Moved within same county (%) - Multirace
Geographical mobility - Moved within same county (%) - Other Race
Geographical mobility - Moved from different county within same state (%)
Geographical mobility - Moved from different county within same state (%) - White
Geographical mobility - Moved from different county within same state (%) - Black or African American
Geographical mobility - Moved from different county within same state (%) - Asian
Geographical mobility - Moved from different county within same state (%) - Hispanic or Latino
Geographical mobility - Moved from different county within same state (%) - American Indian and Alaska Native
Geographical mobility - Moved from different county within same state (%) - Multirace
Geographical mobility - Moved from different county within same state (%) - Other Race
Geographical mobility - Moved from different state (%)
Geographical mobility - Moved from different state (%) - White
Geographical mobility - Moved from different state (%) - Black or African American
Geographical mobility - Moved from different state (%) - Asian
Geographical mobility - Moved from different state (%) - Hispanic or Latino
Geographical mobility - Moved from different state (%) - American Indian and Alaska Native
Geographical mobility - Moved from different state (%) - Multirace
Geographical mobility - Moved from different state (%) - Other Race
Geographical mobility - Moved from abroad (%)
Geographical mobility - Moved from abroad (%) - White
Geographical mobility - Moved from abroad (%) - Black or African American
Geographical mobility - Moved from abroad (%) - Asian
Geographical mobility - Moved from abroad (%) - Hispanic or Latino
Geographical mobility - Moved from abroad (%) - American Indian and Alaska Native
Geographical mobility - Moved from abroad (%) - Multirace
Geographical mobility - Moved from abroad (%) - Other Race
Place of birth for the foreign-born population - Ireland (%)
Place of birth for the foreign-born population - Denmark (%)
Place of birth for the foreign-born population - Norway (%)
Place of birth for the foreign-born population - Sweden (%)
Place of birth for the foreign-born population - United Kingdom (%)
Place of birth for the foreign-born population - England (%)
Place of birth for the foreign-born population - Scotland (%)
Place of birth for the foreign-born population - Other Northern Europe (%)
Place of birth for the foreign-born population - Austria (%)
Place of birth for the foreign-born population - Belgium (%)
Place of birth for the foreign-born population - France (%)
Place of birth for the foreign-born population - Germany (%)
Place of birth for the foreign-born population - Netherlands (%)
Place of birth for the foreign-born population - Switzerland (%)
Place of birth for the foreign-born population - Other Western Europe (%)
Place of birth for the foreign-born population - Greece (%)
Place of birth for the foreign-born population - Italy (%)
Place of birth for the foreign-born population - Portugal (%)
Place of birth for the foreign-born population - Spain (%)
Place of birth for the foreign-born population - Other Southern Europe (%)
Place of birth for the foreign-born population - Albania (%)
Place of birth for the foreign-born population - Belarus (%)
Place of birth for the foreign-born population - Bosnia and Herzegovina (%)
Place of birth for the foreign-born population - Bulgaria (%)
Place of birth for the foreign-born population - Croatia (%)
Place of birth for the foreign-born population - Czechoslovakia (%)
Place of birth for the foreign-born population - Hungary (%)
Place of birth for the foreign-born population - Latvia (%)
Place of birth for the foreign-born population - Lithuania (%)
Place of birth for the foreign-born population - North Macedonia (Macedonia) (%)
Place of birth for the foreign-born population - Moldova (%)
Place of birth for the foreign-born population - Poland (%)
Place of birth for the foreign-born population - Romania (%)
Place of birth for the foreign-born population - Russia (%)
Place of birth for the foreign-born population - Serbia (%)
Place of birth for the foreign-born population - Ukraine (%)
Place of birth for the foreign-born population - Other Eastern Europe (%)
Place of birth for the foreign-born population - China (%)
Place of birth for the foreign-born population - Hong Kong (%)
Place of birth for the foreign-born population - Taiwan (%)
Place of birth for the foreign-born population - Japan (%)
Place of birth for the foreign-born population - Korea (%)
Place of birth for the foreign-born population - Other Eastern Asia (%)
Place of birth for the foreign-born population - Afghanistan (%)
Place of birth for the foreign-born population - Bangladesh (%)
Place of birth for the foreign-born population - India (%)
Place of birth for the foreign-born population - Iran (%)
Place of birth for the foreign-born population - Kazakhstan (%)
Place of birth for the foreign-born population - Nepal (%)
Place of birth for the foreign-born population - Pakistan (%)
Place of birth for the foreign-born population - Sri Lanka (%)
Place of birth for the foreign-born population - Uzbekistan (%)
Place of birth for the foreign-born population - Other South Central Asia (%)
Place of birth for the foreign-born population - Burma (%)
Place of birth for the foreign-born population - Cambodia (%)
Place of birth for the foreign-born population - Indonesia (%)
Place of birth for the foreign-born population - Laos (%)
Place of birth for the foreign-born population - Malaysia (%)
Place of birth for the foreign-born population - Philippines (%)
Place of birth for the foreign-born population - Singapore (%)
Place of birth for the foreign-born population - Thailand (%)
Place of birth for the foreign-born population - Vietnam (%)
Place of birth for the foreign-born population - Other South Eastern Asia (%)
Place of birth for the foreign-born population - Armenia (%)
Place of birth for the foreign-born population - Iraq (%)
Place of birth for the foreign-born population - Israel (%)
Place of birth for the foreign-born population - Jordan (%)
Place of birth for the foreign-born population - Kuwait (%)
Place of birth for the foreign-born population - Lebanon (%)
Place of birth for the foreign-born population - Saudi Arabia (%)
Place of birth for the foreign-born population - Syria (%)
Place of birth for the foreign-born population - Turkey (%)
Place of birth for the foreign-born population - Yemen (%)
Place of birth for the foreign-born population - Other Western Asia (%)
Place of birth for the foreign-born population - Eritrea (%)
Place of birth for the foreign-born population - Ethiopia (%)
Place of birth for the foreign-born population - Kenya (%)
Place of birth for the foreign-born population - Somalia (%)
Place of birth for the foreign-born population - Uganda (%)
Place of birth for the foreign-born population - Zimbabwe (%)
Place of birth for the foreign-born population - Other Eastern Africa (%)
Place of birth for the foreign-born population - Cameroon (%)
Place of birth for the foreign-born population - Congo (%)
Place of birth for the foreign-born population - Democratic Republic of Congo (Zaire) (%)
Place of birth for the foreign-born population - Other Middle Africa (%)
Place of birth for the foreign-born population - Egypt (%)
Place of birth for the foreign-born population - Morocco (%)
Place of birth for the foreign-born population - Sudan (%)
Place of birth for the foreign-born population - Other Northern Africa (%)
Place of birth for the foreign-born population - South Africa (%)
Place of birth for the foreign-born population - Other Southern Africa (%)
Place of birth for the foreign-born population - Cabo Verde (%)
Place of birth for the foreign-born population - Ghana (%)
Place of birth for the foreign-born population - Liberia (%)
Place of birth for the foreign-born population - Nigeria (%)
Place of birth for the foreign-born population - Senegal (%)
Place of birth for the foreign-born population - Sierra Leone (%)
Place of birth for the foreign-born population - Other Western Africa (%)
Place of birth for the foreign-born population - Australia (%)
Place of birth for the foreign-born population - New Zealand (%)
Place of birth for the foreign-born population - Fiji (%)
Place of birth for the foreign-born population - Micronesia (%)
Place of birth for the foreign-born population - Bahamas (%)
Place of birth for the foreign-born population - Barbados (%)
Place of birth for the foreign-born population - Cuba (%)
Place of birth for the foreign-born population - Dominica (%)
Place of birth for the foreign-born population - Dominican Republic (%)
Place of birth for the foreign-born population - Grenada (%)
Place of birth for the foreign-born population - Haiti (%)
Place of birth for the foreign-born population - Jamaica (%)
Place of birth for the foreign-born population - St. Vincent and the Grenadines (%)
Place of birth for the foreign-born population - Trinidad and Tobago (%)
Place of birth for the foreign-born population - West Indies (%)
Place of birth for the foreign-born population - Other Caribbean (%)
Place of birth for the foreign-born population - Belize (%)
Place of birth for the foreign-born population - Costa Rica (%)
Place of birth for the foreign-born population - El Salvador (%)
Place of birth for the foreign-born population - Guatemala (%)
Place of birth for the foreign-born population - Honduras (%)
Place of birth for the foreign-born population - Mexico (%)
Place of birth for the foreign-born population - Nicaragua (%)
Place of birth for the foreign-born population - Panama (%)
Place of birth for the foreign-born population - Other Central America (%)
Place of birth for the foreign-born population - Argentina (%)
Place of birth for the foreign-born population - Bolivia (%)
Place of birth for the foreign-born population - Brazil (%)
Place of birth for the foreign-born population - Chile (%)
Place of birth for the foreign-born population - Colombia (%)
Place of birth for the foreign-born population - Ecuador (%)
Place of birth for the foreign-born population - Guyana (%)
Place of birth for the foreign-born population - Peru (%)
Place of birth for the foreign-born population - Uruguay (%)
Place of birth for the foreign-born population - Venezuela (%)
Place of birth for the foreign-born population - Other South America (%)
Place of birth for the foreign-born population - Canada (%)
Place of birth for the foreign-born population - Other Northern America (%)
Place of birth for the foreign-born population - Other (%)
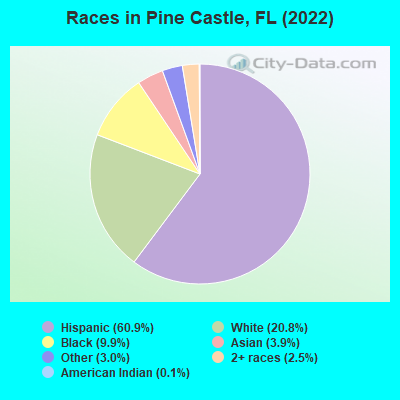
According to 2022 data, the most numerous races in Pine Castle, FL are White alone (2,027 residents), Hispanic (5,919 residents), and Black alone (958 residents). 37.0% of Pine Castle residents speak English at home. 31.2% of Pine Castle, FL residents are foreign-born (23.3% born in Latin America, 3.9% born in Asia), which is 32.7% greater than the foreign-born rate of 21.0% across the entire state of Florida.
Race distribution in Pine Castle
2000 2022
10,458,509 65.4% White alone 2,682,715 16.8% Hispanic 2,264,268 14.2% Black alone 261,693 1.6% Asian alone 236,954 1.5% Two or more races 42,358 0.3% American Indian alone 28,994 0.2% Other race alone 6,887 0.04% Native Hawaiian and Other
11,309,403 50.8% White alone 6,025,039 27.1% Hispanic 3,241,015 14.6% Black alone 861,630 3.9% Two or more races 623,692 2.8% Asian alone 152,054 0.7% Other race alone 22,504 0.1% American Indian alone 9,486 0.04% Native Hawaiian and Other
Income and house value in Pine Castle Median household income in 2022 $46,209 White non-Hispanic householders$49,231 Black householders$34,266 Some other race householders$36,529 Two or more races householders$40,397 Hispanic or Latino race householdersMedian 2022 house value $280,983 White Non-Hispanic householders$259,893 Black or African American householders $293,570 Asian householders$288,467 Some other race householders$269,417 Two or more races householders$278,602 Hispanic or Latino householders
Median age by race in Pine Castle
40.5 Median age for White residents47.2 33.6 33.6 Median age for Black or African American residents30.5 37.2 28.1 Median age for American Indian / Alaska Native residents-735,632,183.2 -529,680,364.8 53.6 Median age for Asian residents52.0 54.5 -679,790,025.6 Median age for Native Hawaiian / Pacific Islander residents-1,327,635,326.3 -611,111,110.5 26.5 Median age for Other race residents21.2 26.8 50.1 Median age for Two or more races residents49.8 48.8 58.9 Median age for White alone residents57.6 61.4 36.8 Median age for Hispanic or Latino residents42.2 33.6
Owner/renter occupied households by race in Pine Castle
House owners and renters - White residents 959 61.2% Owner occupied609 38.8% Renter occupiedHouse owners and renters - Black or African American residents 161 49.2% Owner occupied166 50.8% Renter occupiedHouse owners and renters - Asian residents 130 84.4% Owner occupied24 15.6% Renter occupiedHouse owners and renters - Other race residents 245 31.7% Owner occupied529 68.3% Renter occupiedHouse owners and renters - Two or more races residents 284 24.6% Owner occupied873 75.4% Renter occupiedHouse owners and renters - White alone residents 791 75.3% Owner occupied259 24.7% Renter occupiedHouse owners and renters - Hispanic or Latino residents 603 30.2% Owner occupied1,396 69.8% Renter occupied
Language usage in Pine Castle
English speakers - Total 37.0% of residents of Pine Castle speak English at home.
49.6% of residents speak Spanish at home 3,251 71.8% Speak English very well1,279 28.2% Speak English less than very well13.1% of residents speak other language at home 730 61.2% Speak English very well462 38.8% Speak English less than very well
English speakers - Born in the United States 74.2% of residents of Pine Castle speak English at home.
26.4% of residents speak Spanish at home 568 90.9% Speak English very well57 9.1% Speak English less than very well
English speakers - Native, born elsewhere 11.4% of residents of Pine Castle speak English at home.
92.1% of residents speak Spanish at home 1,282 81.2% Speak English very well297 18.8% Speak English less than very well
English speakers - Foreign-born 10.0% of residents of Pine Castle speak English at home.
54.8% of residents speak Spanish at home 779 46.0% Speak English very well913 54.0% Speak English less than very well34.8% of residents speak other language at home 610 56.7% Speak English very well465 43.3% Speak English less than very well
White (Caucasian) - Speak only English Native:
68.4% (1,799)Foreign-born:
4.3% (23)
White (Caucasian) - Speak another language Native:
20.7% (546)Foreign-born:
92.6% (503)
Black or African American - Speak only English Native:
66.0% (263)Foreign-born:
13.1% (80)
Black or African American - Speak another language Native:
37.3% (148)Foreign-born:
82.3% (504)
Other race - Speak only English Native:
39.3% (487)Foreign-born:
6.8% (52)
Other race - Speak another language Native:
61.7% (764)Foreign-born:
93.5% (722)
Two or more races - Speak only English Native:
31.4% (781)Foreign-born:
7.0% (52)
Two or more races - Speak another language Native:
69.7% (1,737)Foreign-born:
93.1% (695)
White alone - Speak only English Native:
99.6% (1,666)Foreign-born:
11.8% (28)
White alone - Speak another language Native:
0.7% (12)Foreign-born:
91.9% (214)
Hispanic or Latino - Speak only English Native:
24.4% (914)Foreign-born:
1.5% (26)
Hispanic or Latino - Speak another language Native:
73.4% (2,744)Foreign-born:
99.0% (1,716)
Foreign-born residents in Pine Castle 3,037 residents are foreign born (23.3% Latin America , 3.9% Asia ).
This city:
31.2%Florida:
21.1%
Marital status for residents in Pine Castle Marital status - White (Caucasian) population 15 years and over
Males 45.6% Never married39.6% Now married0.0% Separated4.1% Widowed10.8% DivorcedFemales 36.1% Never married40.1% Now married1.6% Separated8.1% Widowed14.1% DivorcedWomen who gave birth in the past 12 months Now married:
0.0% (0)Unmarried:
100.0% (77)
Women who did not give birth in the past 12 months Now married:
33.8% (239)Unmarried:
66.2% (468)
Marital status - Black or African American population 15 years and over
Males 41.4% Never married41.9% Now married4.2% Separated0.0% Widowed12.6% DivorcedFemales 28.8% Never married67.6% Now married0.0% Separated0.0% Widowed3.6% DivorcedWomen who did not give birth in the past 12 months Now married:
57.7% (120)Unmarried:
42.3% (88)
Marital status - American Indian / Alaska Native population 15 years and over
Males 100.0% Never married0.0% Now married0.0% Separated0.0% Widowed0.0% DivorcedFemales 0.0% Never married0.0% Now married0.0% Separated0.0% Widowed100.0% DivorcedWomen who did not give birth in the past 12 months Now married:
0.0% (0)Unmarried:
100.0% (11)
Marital status - Asian population 15 years and over
Males 36.3% Never married55.4% Now married0.0% Separated0.0% Widowed8.3% DivorcedFemales 11.3% Never married56.7% Now married0.0% Separated24.0% Widowed8.0% DivorcedWomen who did not give birth in the past 12 months Now married:
63.8% (30)Unmarried:
36.2% (17)
Marital status - Other race population 15 years and over
Males 67.6% Never married18.2% Now married0.0% Separated0.0% Widowed14.2% DivorcedFemales 69.8% Never married14.8% Now married5.3% Separated0.0% Widowed10.1% DivorcedWomen who gave birth in the past 12 months Now married:
0.0% (0)Unmarried:
100.0% (75)
Women who did not give birth in the past 12 months Now married:
15.7% (66)Unmarried:
84.3% (356)
Marital status - Two or more races population 15 years and over
Males 24.0% Never married57.9% Now married0.0% Separated0.0% Widowed18.0% DivorcedFemales 14.8% Never married58.4% Now married12.4% Separated0.6% Widowed13.7% DivorcedWomen who did not give birth in the past 12 months Now married:
67.9% (710)Unmarried:
32.1% (337)
Marital status - White alone, not Hispanic / Latino population 15 years and over
Males 43.3% Never married35.0% Now married0.0% Separated7.2% Widowed14.6% DivorcedFemales 22.9% Never married45.6% Now married1.5% Separated10.8% Widowed19.2% DivorcedWomen who did not give birth in the past 12 months Now married:
39.4% (107)Unmarried:
60.6% (165)
Marital status - Hispanic or Latino population 15 years and over
Males 44.2% Never married41.5% Now married0.0% Separated0.0% Widowed14.3% DivorcedFemales 42.0% Never married39.2% Now married7.1% Separated2.6% Widowed9.1% DivorcedWomen who gave birth in the past 12 months Now married:
0.0% (0)Unmarried:
100.0% (151)
Women who did not give birth in the past 12 months Now married:
43.5% (702)Unmarried:
56.5% (912)
Ancestries in Pine Castle
719 11.3% Haitian424 6.7% Italian200 3.2% German166 2.6% American128 2.0% French71 1.1% Nigerian71 1.1% U.S. Virgin Islander67 1.1% English44 0.7% Irish42 0.7% Hungarian28 0.4% Polish24 0.4% Eastern European23 0.4% Australian21 0.3% Yugoslavian20 0.3% Iraqi19 0.3% West Indian14 0.2% Portuguese13 0.2% French Canadian9 0.1% Brazilian7 0.1% Dutch6 0.09% Greek
Geographical mobility in Pine Castle Same house 1 year ago 3,047 86.9% White (Caucasian)1,039 100.0% Black or African American40 100.0% American Indian / Alaska Native394 100.0% Asian1,712 81.0% Other race3,255 96.4% Two or more races1,928 95.1% White alone, not Hispanic / Latino4,979 85.9% Hispanic or LatinoMoved within same county 177 5.0% White / Caucasian339 16.0% Other race15 0.4% Two or more races38 1.9% White alone, not Hispanic / Latino383 6.6% Hispanic or LatinoMoved within same state 232 6.6% White / Caucasian58 2.9% White alone, not Hispanic / Latino222 3.8% Hispanic or LatinoMoved from different state 27 1.3% Other race24 0.7% Two or more races18 0.3% Hispanic or LatinoMoved from abroad 26 0.8% White13 1.3% Black or African American27 1.3% Other race171 5.1% Two or more races10 0.5% White alone, not Hispanic / Latino157 2.7% Hispanic or Latino
Children Nativity (place of birth) in Pine Castle
Children under 6 years - Living with two parents Both parents native 36 100.0% NativeBoth parents foreign-born 18 100.0% NativeOne native, one foreign-born parent 130 100.0% NativeChildren under 6 years - Living with one parent Native parent 338 100.0% NativeForeign-born parent 268 100.0% NativeChildren 6 to 17 years - Living with two parents Both parents native 299 99.6% Native1 0.4% Foreign-bornBoth parents foreign-born 101 38.3% Native162 61.7% Foreign-bornOne native, one foreign-born parent 69 100.0% NativeChildren 6 to 17 years - Living with one parent Native parent 206 100.0% NativeForeign-born parent 565 53.5% Native492 46.5% Foreign-born
Grandparents responsible for own grandchildren in Pine Castle
Grandparents (30 to 59 years) White / Caucasian 6 100.0% Not responsible for grandchildrenBlack or African American 34 100.0% Not responsible for grandchildrenOther race 17 100.0% Not responsible for grandchildrenHispanic or Latino 26 100.0% Not responsible for grandchildrenGrandparents (60 years and over) White / Caucasian 5 20.3% Responsible for grandchildren21 79.7% Not responsible for grandchildrenOther race 32 100.0% Responsible for grandchildrenHispanic or Latino 28 100.0% Responsible for grandchildren