Paramus, New Jersey Submit your own pictures of this borough and show them to the world
OSM Map
General Map
Google Map
MSN Map
OSM Map
General Map
Google Map
MSN Map
OSM Map
General Map
Google Map
MSN Map
OSM Map
General Map
Google Map
MSN Map
Please wait while loading the map...
Population in 2022: 26,359 (100% urban, 0% rural). Population change since 2000: +2.4%Males: 13,155 Females: 13,204
March 2022 cost of living index in Paramus: 122.6 (high, U.S. average is 100) Percentage of residents living in poverty in 2022: 4.9%for White Non-Hispanic residents , 1.9% for Black residents , 4.7% for Hispanic or Latino residents , 5.7% for other race residents , 4.2% for two or more races residents )
Profiles of local businesses
Business Search - 14 Million verified businesses
Data:
Median household income ($)
Median household income (% change since 2000)
Household income diversity
Ratio of average income to average house value (%)
Ratio of average income to average rent
Median household income ($) - White
Median household income ($) - Black or African American
Median household income ($) - Asian
Median household income ($) - Hispanic or Latino
Median household income ($) - American Indian and Alaska Native
Median household income ($) - Multirace
Median household income ($) - Other Race
Median household income for houses/condos with a mortgage ($)
Median household income for apartments without a mortgage ($)
Races - White alone (%)
Races - White alone (% change since 2000)
Races - Black alone (%)
Races - Black alone (% change since 2000)
Races - American Indian alone (%)
Races - American Indian alone (% change since 2000)
Races - Asian alone (%)
Races - Asian alone (% change since 2000)
Races - Hispanic (%)
Races - Hispanic (% change since 2000)
Races - Native Hawaiian and Other Pacific Islander alone (%)
Races - Native Hawaiian and Other Pacific Islander alone (% change since 2000)
Races - Two or more races (%)
Races - Two or more races (% change since 2000)
Races - Other race alone (%)
Races - Other race alone (% change since 2000)
Racial diversity
Unemployment (%)
Unemployment (% change since 2000)
Unemployment (%) - White
Unemployment (%) - Black or African American
Unemployment (%) - Asian
Unemployment (%) - Hispanic or Latino
Unemployment (%) - American Indian and Alaska Native
Unemployment (%) - Multirace
Unemployment (%) - Other Race
Population density (people per square mile)
Population - Males (%)
Population - Females (%)
Population - Males (%) - White
Population - Males (%) - Black or African American
Population - Males (%) - Asian
Population - Males (%) - Hispanic or Latino
Population - Males (%) - American Indian and Alaska Native
Population - Males (%) - Multirace
Population - Males (%) - Other Race
Population - Females (%) - White
Population - Females (%) - Black or African American
Population - Females (%) - Asian
Population - Females (%) - Hispanic or Latino
Population - Females (%) - American Indian and Alaska Native
Population - Females (%) - Multirace
Population - Females (%) - Other Race
Coronavirus confirmed cases (Jun 05, 2024)
Deaths caused by coronavirus (Jun 05, 2024)
Coronavirus confirmed cases (per 100k population) (Jun 05, 2024)
Deaths caused by coronavirus (per 100k population) (Jun 05, 2024)
Daily increase in number of cases (Jun 05, 2024)
Weekly increase in number of cases (Jun 05, 2024)
Cases doubled (in days) (Jun 05, 2024)
Hospitalized patients (Apr 18, 2022)
Negative test results (Apr 18, 2022)
Total test results (Apr 18, 2022)
COVID Vaccine doses distributed (per 100k population) (Sep 19, 2023)
COVID Vaccine doses administered (per 100k population) (Sep 19, 2023)
COVID Vaccine doses distributed (Sep 19, 2023)
COVID Vaccine doses administered (Sep 19, 2023)
Likely homosexual households (%)
Likely homosexual households (% change since 2000)
Likely homosexual households - Lesbian couples (%)
Likely homosexual households - Lesbian couples (% change since 2000)
Likely homosexual households - Gay men (%)
Likely homosexual households - Gay men (% change since 2000)
Cost of living index
Median gross rent ($)
Median contract rent ($)
Median monthly housing costs ($)
Median house or condo value ($)
Median house or condo value ($ change since 2000)
Mean house or condo value by units in structure - 1, detached ($)
Mean house or condo value by units in structure - 1, attached ($)
Mean house or condo value by units in structure - 2 ($)
Mean house or condo value by units in structure by units in structure - 3 or 4 ($)
Mean house or condo value by units in structure - 5 or more ($)
Mean house or condo value by units in structure - Boat, RV, van, etc. ($)
Mean house or condo value by units in structure - Mobile home ($)
Median house or condo value ($) - White
Median house or condo value ($) - Black or African American
Median house or condo value ($) - Asian
Median house or condo value ($) - Hispanic or Latino
Median house or condo value ($) - American Indian and Alaska Native
Median house or condo value ($) - Multirace
Median house or condo value ($) - Other Race
Median resident age
Resident age diversity
Median resident age - Males
Median resident age - Females
Median resident age - White
Median resident age - Black or African American
Median resident age - Asian
Median resident age - Hispanic or Latino
Median resident age - American Indian and Alaska Native
Median resident age - Multirace
Median resident age - Other Race
Median resident age - Males - White
Median resident age - Males - Black or African American
Median resident age - Males - Asian
Median resident age - Males - Hispanic or Latino
Median resident age - Males - American Indian and Alaska Native
Median resident age - Males - Multirace
Median resident age - Males - Other Race
Median resident age - Females - White
Median resident age - Females - Black or African American
Median resident age - Females - Asian
Median resident age - Females - Hispanic or Latino
Median resident age - Females - American Indian and Alaska Native
Median resident age - Females - Multirace
Median resident age - Females - Other Race
Commute - mean travel time to work (minutes)
Travel time to work - Less than 5 minutes (%)
Travel time to work - Less than 5 minutes (% change since 2000)
Travel time to work - 5 to 9 minutes (%)
Travel time to work - 5 to 9 minutes (% change since 2000)
Travel time to work - 10 to 19 minutes (%)
Travel time to work - 10 to 19 minutes (% change since 2000)
Travel time to work - 20 to 29 minutes (%)
Travel time to work - 20 to 29 minutes (% change since 2000)
Travel time to work - 30 to 39 minutes (%)
Travel time to work - 30 to 39 minutes (% change since 2000)
Travel time to work - 40 to 59 minutes (%)
Travel time to work - 40 to 59 minutes (% change since 2000)
Travel time to work - 60 to 89 minutes (%)
Travel time to work - 60 to 89 minutes (% change since 2000)
Travel time to work - 90 or more minutes (%)
Travel time to work - 90 or more minutes (% change since 2000)
Marital status - Never married (%)
Marital status - Now married (%)
Marital status - Separated (%)
Marital status - Widowed (%)
Marital status - Divorced (%)
Median family income ($)
Median family income (% change since 2000)
Median non-family income ($)
Median non-family income (% change since 2000)
Median per capita income ($)
Median per capita income (% change since 2000)
Median family income ($) - White
Median family income ($) - Black or African American
Median family income ($) - Asian
Median family income ($) - Hispanic or Latino
Median family income ($) - American Indian and Alaska Native
Median family income ($) - Multirace
Median family income ($) - Other Race
Median year house/condo built
Median year apartment built
Year house built - Built 2005 or later (%)
Year house built - Built 2000 to 2004 (%)
Year house built - Built 1990 to 1999 (%)
Year house built - Built 1980 to 1989 (%)
Year house built - Built 1970 to 1979 (%)
Year house built - Built 1960 to 1969 (%)
Year house built - Built 1950 to 1959 (%)
Year house built - Built 1940 to 1949 (%)
Year house built - Built 1939 or earlier (%)
Average household size
Household density (households per square mile)
Average household size - White
Average household size - Black or African American
Average household size - Asian
Average household size - Hispanic or Latino
Average household size - American Indian and Alaska Native
Average household size - Multirace
Average household size - Other Race
Occupied housing units (%)
Vacant housing units (%)
Owner occupied housing units (%)
Renter occupied housing units (%)
Vacancy status - For rent (%)
Vacancy status - For sale only (%)
Vacancy status - Rented or sold, not occupied (%)
Vacancy status - For seasonal, recreational, or occasional use (%)
Vacancy status - For migrant workers (%)
Vacancy status - Other vacant (%)
Residents with income below the poverty level (%)
Residents with income below 50% of the poverty level (%)
Children below poverty level (%)
Poor families by family type - Married-couple family (%)
Poor families by family type - Male, no wife present (%)
Poor families by family type - Female, no husband present (%)
Poverty status for native-born residents (%)
Poverty status for foreign-born residents (%)
Poverty among high school graduates not in families (%)
Poverty among people who did not graduate high school not in families (%)
Residents with income below the poverty level (%) - White
Residents with income below the poverty level (%) - Black or African American
Residents with income below the poverty level (%) - Asian
Residents with income below the poverty level (%) - Hispanic or Latino
Residents with income below the poverty level (%) - American Indian and Alaska Native
Residents with income below the poverty level (%) - Multirace
Residents with income below the poverty level (%) - Other Race
Air pollution - Air Quality Index (AQI)
Air pollution - CO
Air pollution - NO2
Air pollution - SO2
Air pollution - Ozone
Air pollution - PM10
Air pollution - PM25
Air pollution - Pb
Crime - Murders per 100,000 population
Crime - Rapes per 100,000 population
Crime - Robberies per 100,000 population
Crime - Assaults per 100,000 population
Crime - Burglaries per 100,000 population
Crime - Thefts per 100,000 population
Crime - Auto thefts per 100,000 population
Crime - Arson per 100,000 population
Crime - City-data.com crime index
Crime - Violent crime index
Crime - Property crime index
Crime - Murders per 100,000 population (5 year average)
Crime - Rapes per 100,000 population (5 year average)
Crime - Robberies per 100,000 population (5 year average)
Crime - Assaults per 100,000 population (5 year average)
Crime - Burglaries per 100,000 population (5 year average)
Crime - Thefts per 100,000 population (5 year average)
Crime - Auto thefts per 100,000 population (5 year average)
Crime - Arson per 100,000 population (5 year average)
Crime - City-data.com crime index (5 year average)
Crime - Violent crime index (5 year average)
Crime - Property crime index (5 year average)
1996 Presidential Elections Results (%) - Democratic Party (Clinton)
1996 Presidential Elections Results (%) - Republican Party (Dole)
1996 Presidential Elections Results (%) - Other
2000 Presidential Elections Results (%) - Democratic Party (Gore)
2000 Presidential Elections Results (%) - Republican Party (Bush)
2000 Presidential Elections Results (%) - Other
2004 Presidential Elections Results (%) - Democratic Party (Kerry)
2004 Presidential Elections Results (%) - Republican Party (Bush)
2004 Presidential Elections Results (%) - Other
2008 Presidential Elections Results (%) - Democratic Party (Obama)
2008 Presidential Elections Results (%) - Republican Party (McCain)
2008 Presidential Elections Results (%) - Other
2012 Presidential Elections Results (%) - Democratic Party (Obama)
2012 Presidential Elections Results (%) - Republican Party (Romney)
2012 Presidential Elections Results (%) - Other
2016 Presidential Elections Results (%) - Democratic Party (Clinton)
2016 Presidential Elections Results (%) - Republican Party (Trump)
2016 Presidential Elections Results (%) - Other
2020 Presidential Elections Results (%) - Democratic Party (Biden)
2020 Presidential Elections Results (%) - Republican Party (Trump)
2020 Presidential Elections Results (%) - Other
Ancestries Reported - Arab (%)
Ancestries Reported - Czech (%)
Ancestries Reported - Danish (%)
Ancestries Reported - Dutch (%)
Ancestries Reported - English (%)
Ancestries Reported - French (%)
Ancestries Reported - French Canadian (%)
Ancestries Reported - German (%)
Ancestries Reported - Greek (%)
Ancestries Reported - Hungarian (%)
Ancestries Reported - Irish (%)
Ancestries Reported - Italian (%)
Ancestries Reported - Lithuanian (%)
Ancestries Reported - Norwegian (%)
Ancestries Reported - Polish (%)
Ancestries Reported - Portuguese (%)
Ancestries Reported - Russian (%)
Ancestries Reported - Scotch-Irish (%)
Ancestries Reported - Scottish (%)
Ancestries Reported - Slovak (%)
Ancestries Reported - Subsaharan African (%)
Ancestries Reported - Swedish (%)
Ancestries Reported - Swiss (%)
Ancestries Reported - Ukrainian (%)
Ancestries Reported - United States (%)
Ancestries Reported - Welsh (%)
Ancestries Reported - West Indian (%)
Ancestries Reported - Other (%)
Educational Attainment - No schooling completed (%)
Educational Attainment - Less than high school (%)
Educational Attainment - High school or equivalent (%)
Educational Attainment - Less than 1 year of college (%)
Educational Attainment - 1 or more years of college (%)
Educational Attainment - Associate degree (%)
Educational Attainment - Bachelor's degree (%)
Educational Attainment - Master's degree (%)
Educational Attainment - Professional school degree (%)
Educational Attainment - Doctorate degree (%)
School Enrollment - Nursery, preschool (%)
School Enrollment - Kindergarten (%)
School Enrollment - Grade 1 to 4 (%)
School Enrollment - Grade 5 to 8 (%)
School Enrollment - Grade 9 to 12 (%)
School Enrollment - College undergrad (%)
School Enrollment - Graduate or professional (%)
School Enrollment - Not enrolled in school (%)
School enrollment - Public schools (%)
School enrollment - Private schools (%)
School enrollment - Not enrolled (%)
Median number of rooms in houses and condos
Median number of rooms in apartments
Housing units lacking complete plumbing facilities (%)
Housing units lacking complete kitchen facilities (%)
Density of houses
Urban houses (%)
Rural houses (%)
Households with people 60 years and over (%)
Households with people 65 years and over (%)
Households with people 75 years and over (%)
Households with one or more nonrelatives (%)
Households with no nonrelatives (%)
Population in households (%)
Family households (%)
Nonfamily households (%)
Population in families (%)
Family households with own children (%)
Median number of bedrooms in owner occupied houses
Mean number of bedrooms in owner occupied houses
Median number of bedrooms in renter occupied houses
Mean number of bedrooms in renter occupied houses
Median number of vehichles in owner occupied houses
Mean number of vehichles in owner occupied houses
Median number of vehichles in renter occupied houses
Mean number of vehichles in renter occupied houses
Mortgage status - with mortgage (%)
Mortgage status - with second mortgage (%)
Mortgage status - with home equity loan (%)
Mortgage status - with both second mortgage and home equity loan (%)
Mortgage status - without a mortgage (%)
Average family size
Average family size - White
Average family size - Black or African American
Average family size - Asian
Average family size - Hispanic or Latino
Average family size - American Indian and Alaska Native
Average family size - Multirace
Average family size - Other Race
Geographical mobility - Same house 1 year ago (%)
Geographical mobility - Moved within same county (%)
Geographical mobility - Moved from different county within same state (%)
Geographical mobility - Moved from different state (%)
Geographical mobility - Moved from abroad (%)
Place of birth - Born in state of residence (%)
Place of birth - Born in other state (%)
Place of birth - Native, outside of US (%)
Place of birth - Foreign born (%)
Housing units in structures - 1, detached (%)
Housing units in structures - 1, attached (%)
Housing units in structures - 2 (%)
Housing units in structures - 3 or 4 (%)
Housing units in structures - 5 to 9 (%)
Housing units in structures - 10 to 19 (%)
Housing units in structures - 20 to 49 (%)
Housing units in structures - 50 or more (%)
Housing units in structures - Mobile home (%)
Housing units in structures - Boat, RV, van, etc. (%)
House/condo owner moved in on average (years ago)
Renter moved in on average (years ago)
Year householder moved into unit - Moved in 1999 to March 2000 (%)
Year householder moved into unit - Moved in 1995 to 1998 (%)
Year householder moved into unit - Moved in 1990 to 1994 (%)
Year householder moved into unit - Moved in 1980 to 1989 (%)
Year householder moved into unit - Moved in 1970 to 1979 (%)
Year householder moved into unit - Moved in 1969 or earlier (%)
Means of transportation to work - Drove car alone (%)
Means of transportation to work - Carpooled (%)
Means of transportation to work - Public transportation (%)
Means of transportation to work - Bus or trolley bus (%)
Means of transportation to work - Streetcar or trolley car (%)
Means of transportation to work - Subway or elevated (%)
Means of transportation to work - Railroad (%)
Means of transportation to work - Ferryboat (%)
Means of transportation to work - Taxicab (%)
Means of transportation to work - Motorcycle (%)
Means of transportation to work - Bicycle (%)
Means of transportation to work - Walked (%)
Means of transportation to work - Other means (%)
Working at home (%)
Industry diversity
Most Common Industries - Agriculture, forestry, fishing and hunting, and mining (%)
Most Common Industries - Agriculture, forestry, fishing and hunting (%)
Most Common Industries - Mining, quarrying, and oil and gas extraction (%)
Most Common Industries - Construction (%)
Most Common Industries - Manufacturing (%)
Most Common Industries - Wholesale trade (%)
Most Common Industries - Retail trade (%)
Most Common Industries - Transportation and warehousing, and utilities (%)
Most Common Industries - Transportation and warehousing (%)
Most Common Industries - Utilities (%)
Most Common Industries - Information (%)
Most Common Industries - Finance and insurance, and real estate and rental and leasing (%)
Most Common Industries - Finance and insurance (%)
Most Common Industries - Real estate and rental and leasing (%)
Most Common Industries - Professional, scientific, and management, and administrative and waste management services (%)
Most Common Industries - Professional, scientific, and technical services (%)
Most Common Industries - Management of companies and enterprises (%)
Most Common Industries - Administrative and support and waste management services (%)
Most Common Industries - Educational services, and health care and social assistance (%)
Most Common Industries - Educational services (%)
Most Common Industries - Health care and social assistance (%)
Most Common Industries - Arts, entertainment, and recreation, and accommodation and food services (%)
Most Common Industries - Arts, entertainment, and recreation (%)
Most Common Industries - Accommodation and food services (%)
Most Common Industries - Other services, except public administration (%)
Most Common Industries - Public administration (%)
Occupation diversity
Most Common Occupations - Management, business, science, and arts occupations (%)
Most Common Occupations - Management, business, and financial occupations (%)
Most Common Occupations - Management occupations (%)
Most Common Occupations - Business and financial operations occupations (%)
Most Common Occupations - Computer, engineering, and science occupations (%)
Most Common Occupations - Computer and mathematical occupations (%)
Most Common Occupations - Architecture and engineering occupations (%)
Most Common Occupations - Life, physical, and social science occupations (%)
Most Common Occupations - Education, legal, community service, arts, and media occupations (%)
Most Common Occupations - Community and social service occupations (%)
Most Common Occupations - Legal occupations (%)
Most Common Occupations - Education, training, and library occupations (%)
Most Common Occupations - Arts, design, entertainment, sports, and media occupations (%)
Most Common Occupations - Healthcare practitioners and technical occupations (%)
Most Common Occupations - Health diagnosing and treating practitioners and other technical occupations (%)
Most Common Occupations - Health technologists and technicians (%)
Most Common Occupations - Service occupations (%)
Most Common Occupations - Healthcare support occupations (%)
Most Common Occupations - Protective service occupations (%)
Most Common Occupations - Fire fighting and prevention, and other protective service workers including supervisors (%)
Most Common Occupations - Law enforcement workers including supervisors (%)
Most Common Occupations - Food preparation and serving related occupations (%)
Most Common Occupations - Building and grounds cleaning and maintenance occupations (%)
Most Common Occupations - Personal care and service occupations (%)
Most Common Occupations - Sales and office occupations (%)
Most Common Occupations - Sales and related occupations (%)
Most Common Occupations - Office and administrative support occupations (%)
Most Common Occupations - Natural resources, construction, and maintenance occupations (%)
Most Common Occupations - Farming, fishing, and forestry occupations (%)
Most Common Occupations - Construction and extraction occupations (%)
Most Common Occupations - Installation, maintenance, and repair occupations (%)
Most Common Occupations - Production, transportation, and material moving occupations (%)
Most Common Occupations - Production occupations (%)
Most Common Occupations - Transportation occupations (%)
Most Common Occupations - Material moving occupations (%)
People in Group quarters - Institutionalized population (%)
People in Group quarters - Correctional institutions (%)
People in Group quarters - Federal prisons and detention centers (%)
People in Group quarters - Halfway houses (%)
People in Group quarters - Local jails and other confinement facilities (including police lockups) (%)
People in Group quarters - Military disciplinary barracks (%)
People in Group quarters - State prisons (%)
People in Group quarters - Other types of correctional institutions (%)
People in Group quarters - Nursing homes (%)
People in Group quarters - Hospitals/wards, hospices, and schools for the handicapped (%)
People in Group quarters - Hospitals/wards and hospices for chronically ill (%)
People in Group quarters - Hospices or homes for chronically ill (%)
People in Group quarters - Military hospitals or wards for chronically ill (%)
People in Group quarters - Other hospitals or wards for chronically ill (%)
People in Group quarters - Hospitals or wards for drug/alcohol abuse (%)
People in Group quarters - Mental (Psychiatric) hospitals or wards (%)
People in Group quarters - Schools, hospitals, or wards for the mentally retarded (%)
People in Group quarters - Schools, hospitals, or wards for the physically handicapped (%)
People in Group quarters - Institutions for the deaf (%)
People in Group quarters - Institutions for the blind (%)
People in Group quarters - Orthopedic wards and institutions for the physically handicapped (%)
People in Group quarters - Wards in general hospitals for patients who have no usual home elsewhere (%)
People in Group quarters - Wards in military hospitals for patients who have no usual home elsewhere (%)
People in Group quarters - Juvenile institutions (%)
People in Group quarters - Long-term care (%)
People in Group quarters - Homes for abused, dependent, and neglected children (%)
People in Group quarters - Residential treatment centers for emotionally disturbed children (%)
People in Group quarters - Training schools for juvenile delinquents (%)
People in Group quarters - Short-term care, detention or diagnostic centers for delinquent children (%)
People in Group quarters - Type of juvenile institution unknown (%)
People in Group quarters - Noninstitutionalized population (%)
People in Group quarters - College dormitories (includes college quarters off campus) (%)
People in Group quarters - Military quarters (%)
People in Group quarters - On base (%)
People in Group quarters - Barracks, unaccompanied personnel housing (UPH), (Enlisted/Officer), ;and similar group living quarters for military personnel (%)
People in Group quarters - Transient quarters for temporary residents (%)
People in Group quarters - Military ships (%)
People in Group quarters - Group homes (%)
People in Group quarters - Homes or halfway houses for drug/alcohol abuse (%)
People in Group quarters - Homes for the mentally ill (%)
People in Group quarters - Homes for the mentally retarded (%)
People in Group quarters - Homes for the physically handicapped (%)
People in Group quarters - Other group homes (%)
People in Group quarters - Religious group quarters (%)
People in Group quarters - Dormitories (%)
People in Group quarters - Agriculture workers' dormitories on farms (%)
People in Group quarters - Job Corps and vocational training facilities (%)
People in Group quarters - Other workers' dormitories (%)
People in Group quarters - Crews of maritime vessels (%)
People in Group quarters - Other nonhousehold living situations (%)
People in Group quarters - Other noninstitutional group quarters (%)
Residents speaking English at home (%)
Residents speaking English at home - Born in the United States (%)
Residents speaking English at home - Native, born elsewhere (%)
Residents speaking English at home - Foreign born (%)
Residents speaking Spanish at home (%)
Residents speaking Spanish at home - Born in the United States (%)
Residents speaking Spanish at home - Native, born elsewhere (%)
Residents speaking Spanish at home - Foreign born (%)
Residents speaking other language at home (%)
Residents speaking other language at home - Born in the United States (%)
Residents speaking other language at home - Native, born elsewhere (%)
Residents speaking other language at home - Foreign born (%)
Class of Workers - Employee of private company (%)
Class of Workers - Self-employed in own incorporated business (%)
Class of Workers - Private not-for-profit wage and salary workers (%)
Class of Workers - Local government workers (%)
Class of Workers - State government workers (%)
Class of Workers - Federal government workers (%)
Class of Workers - Self-employed workers in own not incorporated business and Unpaid family workers (%)
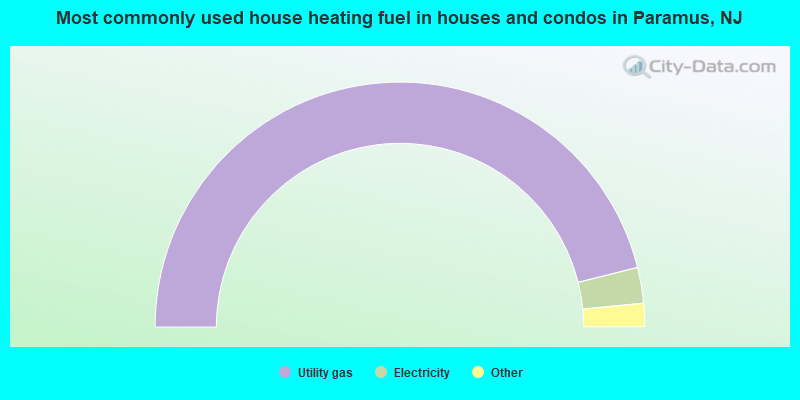
House heating fuel used in houses and condos - Utility gas (%)
House heating fuel used in houses and condos - Bottled, tank, or LP gas (%)
House heating fuel used in houses and condos - Electricity (%)
House heating fuel used in houses and condos - Fuel oil, kerosene, etc. (%)
House heating fuel used in houses and condos - Coal or coke (%)
House heating fuel used in houses and condos - Wood (%)
House heating fuel used in houses and condos - Solar energy (%)
House heating fuel used in houses and condos - Other fuel (%)
House heating fuel used in houses and condos - No fuel used (%)
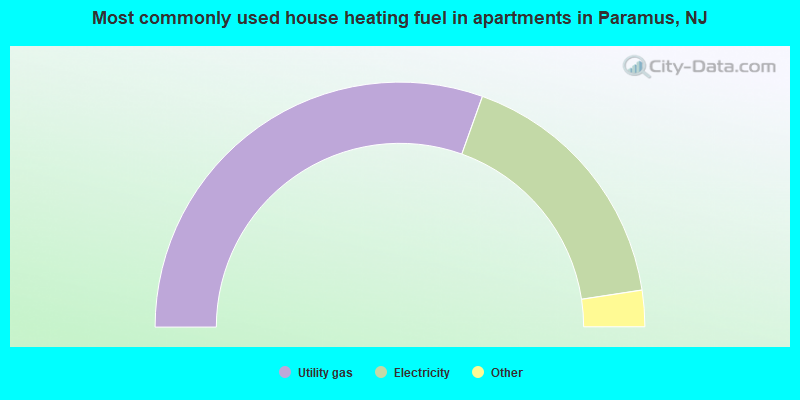
House heating fuel used in apartments - Utility gas (%)
House heating fuel used in apartments - Bottled, tank, or LP gas (%)
House heating fuel used in apartments - Electricity (%)
House heating fuel used in apartments - Fuel oil, kerosene, etc. (%)
House heating fuel used in apartments - Coal or coke (%)
House heating fuel used in apartments - Wood (%)
House heating fuel used in apartments - Solar energy (%)
House heating fuel used in apartments - Other fuel (%)
House heating fuel used in apartments - No fuel used (%)
Armed forces status - In Armed Forces (%)
Armed forces status - Civilian (%)
Armed forces status - Civilian - Veteran (%)
Armed forces status - Civilian - Nonveteran (%)
Fatal accidents locations in years 2005-2021
Fatal accidents locations in 2005
Fatal accidents locations in 2006
Fatal accidents locations in 2007
Fatal accidents locations in 2008
Fatal accidents locations in 2009
Fatal accidents locations in 2010
Fatal accidents locations in 2011
Fatal accidents locations in 2012
Fatal accidents locations in 2013
Fatal accidents locations in 2014
Fatal accidents locations in 2015
Fatal accidents locations in 2016
Fatal accidents locations in 2017
Fatal accidents locations in 2018
Fatal accidents locations in 2019
Fatal accidents locations in 2020
Fatal accidents locations in 2021
Alcohol use - People drinking some alcohol every month (%)
Alcohol use - People not drinking at all (%)
Alcohol use - Average days/month drinking alcohol
Alcohol use - Average drinks/week
Alcohol use - Average days/year people drink much
Audiometry - Average condition of hearing (%)
Audiometry - People that can hear a whisper from across a quiet room (%)
Audiometry - People that can hear normal voice from across a quiet room (%)
Audiometry - Ears ringing, roaring, buzzing (%)
Audiometry - Had a job exposure to loud noise (%)
Audiometry - Had off-work exposure to loud noise (%)
Blood Pressure & Cholesterol - Has high blood pressure (%)
Blood Pressure & Cholesterol - Checking blood pressure at home (%)
Blood Pressure & Cholesterol - Frequently checking blood cholesterol (%)
Blood Pressure & Cholesterol - Has high cholesterol level (%)
Consumer Behavior - Money monthly spent on food at supermarket/grocery store
Consumer Behavior - Money monthly spent on food at other stores
Consumer Behavior - Money monthly spent on eating out
Consumer Behavior - Money monthly spent on carryout/delivered foods
Consumer Behavior - Income spent on food at supermarket/grocery store (%)
Consumer Behavior - Income spent on food at other stores (%)
Consumer Behavior - Income spent on eating out (%)
Consumer Behavior - Income spent on carryout/delivered foods (%)
Current Health Status - General health condition (%)
Current Health Status - Blood donors (%)
Current Health Status - Has blood ever tested for HIV virus (%)
Current Health Status - Left-handed people (%)
Dermatology - People using sunscreen (%)
Diabetes - Diabetics (%)
Diabetes - Had a blood test for high blood sugar (%)
Diabetes - People taking insulin (%)
Diet Behavior & Nutrition - Diet health (%)
Diet Behavior & Nutrition - Milk product consumption (# of products/month)
Diet Behavior & Nutrition - Meals not home prepared (#/week)
Diet Behavior & Nutrition - Meals from fast food or pizza place (#/week)
Diet Behavior & Nutrition - Ready-to-eat foods (#/month)
Diet Behavior & Nutrition - Frozen meals/pizza (#/month)
Drug Use - People that ever used marijuana or hashish (%)
Drug Use - Ever used hard drugs (%)
Drug Use - Ever used any form of cocaine (%)
Drug Use - Ever used heroin (%)
Drug Use - Ever used methamphetamine (%)
Health Insurance - People covered by health insurance (%)
Kidney Conditions-Urology - Avg. # of times urinating at night
Medical Conditions - People with asthma (%)
Medical Conditions - People with anemia (%)
Medical Conditions - People with psoriasis (%)
Medical Conditions - People with overweight (%)
Medical Conditions - Elderly people having difficulties in thinking or remembering (%)
Medical Conditions - People who ever received blood transfusion (%)
Medical Conditions - People having trouble seeing even with glass/contacts (%)
Medical Conditions - People with arthritis (%)
Medical Conditions - People with gout (%)
Medical Conditions - People with congestive heart failure (%)
Medical Conditions - People with coronary heart disease (%)
Medical Conditions - People with angina pectoris (%)
Medical Conditions - People who ever had heart attack (%)
Medical Conditions - People who ever had stroke (%)
Medical Conditions - People with emphysema (%)
Medical Conditions - People with thyroid problem (%)
Medical Conditions - People with chronic bronchitis (%)
Medical Conditions - People with any liver condition (%)
Medical Conditions - People who ever had cancer or malignancy (%)
Mental Health - People who have little interest in doing things (%)
Mental Health - People feeling down, depressed, or hopeless (%)
Mental Health - People who have trouble sleeping or sleeping too much (%)
Mental Health - People feeling tired or having little energy (%)
Mental Health - People with poor appetite or overeating (%)
Mental Health - People feeling bad about themself (%)
Mental Health - People who have trouble concentrating on things (%)
Mental Health - People moving or speaking slowly or too fast (%)
Mental Health - People having thoughts they would be better off dead (%)
Oral Health - Average years since last visit a dentist
Oral Health - People embarrassed because of mouth (%)
Oral Health - People with gum disease (%)
Oral Health - General health of teeth and gums (%)
Oral Health - Average days a week using dental floss/device
Oral Health - Average days a week using mouthwash for dental problem
Oral Health - Average number of teeth
Pesticide Use - Households using pesticides to control insects (%)
Pesticide Use - Households using pesticides to kill weeds (%)
Physical Activity - People doing vigorous-intensity work activities (%)
Physical Activity - People doing moderate-intensity work activities (%)
Physical Activity - People walking or bicycling (%)
Physical Activity - People doing vigorous-intensity recreational activities (%)
Physical Activity - People doing moderate-intensity recreational activities (%)
Physical Activity - Average hours a day doing sedentary activities
Physical Activity - Average hours a day watching TV or videos
Physical Activity - Average hours a day using computer
Physical Functioning - People having limitations keeping them from working (%)
Physical Functioning - People limited in amount of work they can do (%)
Physical Functioning - People that need special equipment to walk (%)
Physical Functioning - People experiencing confusion/memory problems (%)
Physical Functioning - People requiring special healthcare equipment (%)
Prescription Medications - Average number of prescription medicines taking
Preventive Aspirin Use - Adults 40+ taking low-dose aspirin (%)
Reproductive Health - Vaginal deliveries (%)
Reproductive Health - Cesarean deliveries (%)
Reproductive Health - Deliveries resulted in a live birth (%)
Reproductive Health - Pregnancies resulted in a delivery (%)
Reproductive Health - Women breastfeeding newborns (%)
Reproductive Health - Women that had a hysterectomy (%)
Reproductive Health - Women that had both ovaries removed (%)
Reproductive Health - Women that have ever taken birth control pills (%)
Reproductive Health - Women taking birth control pills (%)
Reproductive Health - Women that have ever used Depo-Provera or injectables (%)
Reproductive Health - Women that have ever used female hormones (%)
Sexual Behavior - People 18+ that ever had sex (vaginal, anal, or oral) (%)
Sexual Behavior - Males 18+ that ever had vaginal sex with a woman (%)
Sexual Behavior - Males 18+ that ever performed oral sex on a woman (%)
Sexual Behavior - Males 18+ that ever had anal sex with a woman (%)
Sexual Behavior - Males 18+ that ever had any sex with a man (%)
Sexual Behavior - Females 18+ that ever had vaginal sex with a man (%)
Sexual Behavior - Females 18+ that ever performed oral sex on a man (%)
Sexual Behavior - Females 18+ that ever had anal sex with a man (%)
Sexual Behavior - Females 18+ that ever had any kind of sex with a woman (%)
Sexual Behavior - Average age people first had sex
Sexual Behavior - Average number of female sex partners in lifetime (males 18+)
Sexual Behavior - Average number of female vaginal sex partners in lifetime (males 18+)
Sexual Behavior - Average age people first performed oral sex on a woman (18+)
Sexual Behavior - Average number of woman performed oral sex on in lifetime (18+)
Sexual Behavior - Average number of male sex partners in lifetime (males 18+)
Sexual Behavior - Average number of male anal sex partners in lifetime (males 18+)
Sexual Behavior - Average age people first performed oral sex on a man (18+)
Sexual Behavior - Average number of male oral sex partners in lifetime (18+)
Sexual Behavior - People using protection when performing oral sex (%)
Sexual Behavior - Average number of times people have vaginal or anal sex a year
Sexual Behavior - People having sex without condom (%)
Sexual Behavior - Average number of male sex partners in lifetime (females 18+)
Sexual Behavior - Average number of male vaginal sex partners in lifetime (females 18+)
Sexual Behavior - Average number of female sex partners in lifetime (females 18+)
Sexual Behavior - Circumcised males 18+ (%)
Sleep Disorders - Average hours sleeping at night
Sleep Disorders - People that has trouble sleeping (%)
Smoking-Cigarette Use - People smoking cigarettes (%)
Taste & Smell - People 40+ having problems with smell (%)
Taste & Smell - People 40+ having problems with taste (%)
Taste & Smell - People 40+ that ever had wisdom teeth removed (%)
Taste & Smell - People 40+ that ever had tonsils teeth removed (%)
Taste & Smell - People 40+ that ever had a loss of consciousness because of a head injury (%)
Taste & Smell - People 40+ that ever had a broken nose or other serious injury to face or skull (%)
Taste & Smell - People 40+ that ever had two or more sinus infections (%)
Weight - Average height (inches)
Weight - Average weight (pounds)
Weight - Average BMI
Weight - People that are obese (%)
Weight - People that ever were obese (%)
Weight - People trying to lose weight (%)
According to our research of New Jersey and other state lists, there were 3 registered sex offenders living in Paramus, New Jersey as of June 05, 2024 . The ratio of all residents to sex offenders in Paramus is 9,016 to 1.The ratio of registered sex offenders to all residents in this city is much lower than the state average.
Officers per 1,000 residents here:
3.65New Jersey average:
5.53
Latest news from Paramus, NJ collected exclusively by city-data.com from local newspapers, TV, and radio stations
Ancestries: Italian (13.4%), Irish (5.6%), American (3.4%), Polish (2.1%), German (2.0%), Austrian (1.8%).
Current Local Time:
Land area: 10.5 square miles.
Population density: 2,517 people per square mile (average).
8,302 residents are foreign born (19.5% Asia , 5.4% Europe , 4.8% Latin America ).
This borough:
31.2%New Jersey:
23.2%
Median real estate property taxes paid for housing units with mortgages in 2022: $10,001 (1.3%)Median real estate property taxes paid for housing units with no mortgage in 2022: $9,617 (1.5%)
Nearest city with pop. 50,000+: Paterson, NJ
Nearest city with pop. 200,000+: Bronx, NY
Nearest cities:
Latitude: 40.95 N, Longitude: 74.07 W
Daytime population change due to commuting: +23,392 (+88.0%)Workers who live and work in this borough: 4,438 (36.7%)
Paramus tourist attractions:
Unemployment in December 2023:
Population change in the 1990s: +787 (+3.2%).
Most common occupations in Paramus, NJ (%)
Both Males Females
Other sales and related occupations, including supervisors (5.6%)
Retail sales workers, except cashiers (5.2%)
Other management occupations, except farmers and farm managers (4.5%)
Secretaries and administrative assistants (4.4%)
Preschool, kindergarten, elementary, and middle school teachers (4.2%)
Other office and administrative support workers, including supervisors (3.9%)
Sales representatives, services, wholesale and manufacturing (3.6%)
Other sales and related occupations, including supervisors (6.6%)
Other management occupations, except farmers and farm managers (6.0%)
Retail sales workers, except cashiers (5.4%)
Computer specialists (4.2%)
Sales representatives, services, wholesale and manufacturing (3.8%)
Top executives (3.7%)
Electrical equipment mechanics and other installation, maintenance, and repair workers, including supervisors (3.6%)
Secretaries and administrative assistants (9.4%)
Preschool, kindergarten, elementary, and middle school teachers (7.3%)
Registered nurses (6.6%)
Other office and administrative support workers, including supervisors (5.9%)
Retail sales workers, except cashiers (4.9%)
Other sales and related occupations, including supervisors (4.4%)
Bookkeeping, accounting, and auditing clerks (3.6%)
Tornado activity:
Paramus-area historical tornado activity is near New Jersey state average. It is 36% smaller than the overall U.S. average.
On 5/28/1973, a category F3 (max. wind speeds 158-206 mph) tornado 24.7 miles away from the Paramus borough center caused between $50,000 and $500,000 in damages.
On 8/7/1962, a category F2 (max. wind speeds 113-157 mph) tornado 1.2 miles away from the borough center caused between $50,000 and $500,000 in damages.
Earthquake activity:
Paramus-area historical earthquake activity is significantly above New Jersey state average. It is 68% smaller than the overall U.S. average. On 8/23/2011 at 17:51:04, a magnitude 5.8 (5.8 MW, Depth: 3.7 mi, Class: Moderate, Intensity: VI - VII) earthquake occurred 294.6 miles away from the city center On 10/7/1983 at 10:18:46, a magnitude 5.3 (5.1 MB, 5.3 LG, 5.1 ML) earthquake occurred 208.4 miles away from the city center On 4/20/2002 at 10:50:47, a magnitude 5.3 (5.3 ML, Depth: 3.0 mi) earthquake occurred 247.3 miles away from the city center On 1/16/1994 at 01:49:16, a magnitude 4.6 (4.6 MB, 4.6 LG, Depth: 3.1 mi, Class: Light, Intensity: IV - V) earthquake occurred 111.7 miles away from Paramus center On 4/20/2002 at 10:50:47, a magnitude 5.2 (5.2 MB, 4.2 MS, 5.2 MW, 5.0 MW) earthquake occurred 245.5 miles away from the city center On 1/16/1994 at 00:42:43, a magnitude 4.2 (4.2 MB, 4.0 LG, Depth: 3.1 mi) earthquake occurred 110.3 miles away from Paramus center Magnitude types: regional Lg-wave magnitude (LG), body-wave magnitude (MB), local magnitude (ML), surface-wave magnitude (MS), moment magnitude (MW) Natural disasters: The number of natural disasters in Bergen County (29) is a lot greater than the US average (15).Major Disasters (Presidential) Declared: 18Emergencies Declared: 10Floods: 7, Hurricanes: 7, Storms: 6, Heavy Rains: 4, Snowstorms: 4, Winter Storms: 3, Blizzards: 2, Water Shortages: 2, Power Outage: 1, Tornado: 1, Tropical Storm: 1, Wind: 1, Other: 3 (Note: some incidents may be assigned to more than one category). Main business address for: HUDSON CITY BANCORP INC SAVINGS INSTITUTIONS, NOT FEDERALLY CHARTERED ), MOVADO GROUP INC WATCHES, CLOCKS, CLOCKWORK OPERATED DEVICES/PARTS ), WIRELESS TELECOM GROUP INC INSTRUMENTS FOR MEAS & TESTING OF ELECTRICITY & ELEC SIGNALS ).
Hospitals in Paramus: BERGEN REGIONAL MEDICAL CENTER (Government - Local, provides emergency services, 230 EAST RIDGEWOOD AVE) LIFE SOURCE SERVICES HOSPICE (230 EAST RIDGEWOOD AVENUE) YANKEE SURGICAL CENTER DBA PARAMUS SURGICAL CENTER (30 WEST CENTURY ROAD) Home Health Centers in Paramus: VALLEY HOME CARE INC. (15 ESSEX ROAD) Nursing Homes in Paramus: BERGEN PINES CO HOSP (RIDGEWOOD RD) BERGEN REGIONAL MEDICAL CENTER (230 E RIDGEWOOD AVE) CARE ONE AT RIDGEWOOD AVENUE (W-90 RIDGEWOOD AVE) DELLRIDGE HEALTH AND REHABILITATION CENTER (532 FARVIEW AVE) DELLRIDGE NURSING HOME (532 FAIRVIEW AVE) N J VETERANS MEM HOME PARAMUS (1 VETERANS DRIVE) PARAMUS CARE CENTER (593 PARAMUS RD) Heliports located in Paramus: Amtrak stations near Paramus: 9 miles: YONKERS (FOOT OF DOCK ST. & WELLS AVE.) Services: fully wheelchair accessible, enclosed waiting area, public restrooms, public payphones, snack bar, paid short-term parking, paid long-term parking, call for car rental service, taxi stand, public transit connection.
15 miles: NEW YORK (PENN STA) (NEW YORK, 7TH AVE. & W. 32ND ST.) Services: ticket office, fully wheelchair accessible, enclosed waiting area, public restrooms, public payphones, full-service food facilities, snack bar, vending machines, ATM, paid short-term parking, paid long-term parking, call for car rental service, taxi stand, public transit connection.
16 miles: NEW ROCHELLE (DEPOT PLAZA NORTH) Services: enclosed waiting area, public restrooms, public payphones, paid short-term parking, paid long-term parking, call for car rental service, taxi stand, public transit connection.
Colleges/Universities in Paramus: Bergen Community College Full-time enrollment: 11,826; Location: 400 Paramus Rd; Public; Website: www.bergen.edu)
Lincoln Technical Institute-Paramus Full-time enrollment: 618; Location: 240 Bergen Town Center; Private, for-profit; Website: www.lincolntech.com)
Capri Institute of Hair Design-Paramus Full-time enrollment: 188; Location: 615 Winters Ave; Private, for-profit; Website: www.capriinstitute.com)
Empire Beauty School-Paramus Full-time enrollment: 160; Location: 332 Rt 4 E; Private, for-profit; Website: www.empire.edu)
Other colleges/universities with over 2000 students near Paramus:
Fairleigh Dickinson University-Metropolitan Campus (about 5 miles; Teaneck, NJ ; Full-time enrollment: 5,349)
Ramapo College of New Jersey (about 5 miles; Mahwah, NJ ; FT enrollment: 5,864)
Passaic County Community College (about 6 miles; Paterson, NJ ; FT enrollment: 6,351)
Jersey College (about 6 miles; Teterboro, NJ ; FT enrollment: 2,073)
William Paterson University of New Jersey (about 7 miles; Wayne, NJ ; FT enrollment: 10,198)
Berkeley College-Woodland Park (about 7 miles; Woodland Park, NJ ; FT enrollment: 2,938)
Montclair State University (about 10 miles; Montclair, NJ ; FT enrollment: 16,277)
Biggest public high schools in Paramus: PARAMUS HIGH SCHOOL Students: 1,410, Location: 99 EAST CENTURY RD, Grades: PK-12)BERGEN CO JUVENILE DETENTION CENTER Location: 296 E RIDGEWOOD AVE, Grades: 8-11)
AUTISTIC Location: 355 EAST RIDGEWOOD AVE, Grades: PK-12)HEARING IMPAIRED Location: 327 EAST RIDGEWOOD AVENUE, Grades: PK-12)EMOTIONALLY DISTURBED Location: 327 EAST RIDGEWOOD AVE, Grades: PK-12)LIFE SKILLS Location: 327 EAST RIDGEWOOD AVE, Grades: PK-12)N. A. BLESHMAN REGIONAL DAY SCHOOL Location: 333 EAST RIDGEWOOD AVENUE, Grades: PK-12)MULTIPLY HANDICAPED Location: 327 EAST RIDGEWOOD AVENUE, Grades: PK-12)BERGEN COUNTY TECHNICAL HIGH SCHOOL - PARAMUS Location: E.285 PASCACK ROAD, Grades: 9-12)
BERGEN COUNTY TECHNICAL HIGH SCHOOL - PARAMUS Location: E.285 PASCACK ROAD, Grades: 9-12)
Private high schools in Paramus: PARAMUS CATHOLIC HIGH SCHOOL Students: 1,520, Location: 425 PARAMUS RD, Grades: 9-12)
THE FRISCH SCHOOL Students: 584, Location: 120 W CENTURY RD, Grades: 9-12)
PALISADES REGIONAL ACADEMY Students: 55, Location: 304 E MIDLAND AVE, Grades: 8-12)
NEW ALLIANCE ACADEMY Students: 12, Location: 49 EAST MIDLAND AVENUE STE 2, Grades: 10-12)
Public elementary/middle schools in Paramus: WEST BROOK MIDDLE SCHOOL Students: 709, Location: 560 ROOSEVELT BLVD, Grades: 5-8)EAST BROOK MIDDLE SCHOOL Students: 604, Location: 190 SPRING VALLEY RD, Grades: 5-8)RIDGE RANCH ELEMENTARY SCHOOL Students: 390, Location: 345 LOCKWOOD DRIVE, Grades: PK-4)MIDLAND ELEMENTARY SCHOOL Students: 277, Location: 241 WEST MIDLAND AVENUE, Grades: KG-4)STONY LANE ELEMENTARY SCHOOL Students: 241, Location: W 110 RIDGEWOOD AVE, Grades: KG-4)MEMORIAL ELEMENTARY SCHOOL Location: EAST 203 MIDLAND AVE, Grades: KG-4)
PARKWAY ELEMENTARY SCHOOL Location: 145 E RIDGEWOOD AVENUE, Grades: PK-4)
Private elementary/middle schools in Paramus: YAVNEH ACADEMY Students: 679, Location: 155 N FARVIEW AVE, Grades: PK-8)
VISITATION ACADEMY Students: 306, Location: 222 N FARVIEW AVE, Grades: PK-8)
BEN PORAT YOSEF Students: 229, Location: E 243 FRISCH CT, Grades: PK-6)
See full list of schools located in Paramus Library in Paramus: PARAMUS PUBLIC LIBRARY Operating income: $3,200,018; Location: E. 116 CENTURY ROAD; 100,388 books ; 6,980 audio materials ; 11,278 video materials ; 9 local licensed databases ; 22 state licensed databases ; 3 other licensed databases ; 344 print serial subscriptions ; 7 electronic serial subscriptions )
User-submitted facts and corrections:
Berkeley College is located at 64 East Midland Avenue, Paramus, NJ 201-967-9667. Berkeley College is a fully accredited college awarding both Associate and Baccalaureate degrees.
Notable locations in Paramus: (A) , Ridgewood Golf Club (B) , Saddle River Golf Club (C) , Arcola Golf Club (D) , Mount Saint Andrews (E) , Paramus Volunteer Ambulance Corps (F) , Eden Ambulance Corporation (G) , Paramus Rescue Squad (H) , Paramus Fire Company 1 (I) , Paramus Fire Company 3 (J) , Paramus Fire Company 2 (K) , Paramus Fire Department Company 4 (L) , Paramus Public Library (M) , Paramus Municipal Building (N) , Charles E Reid Branch Paramus Public Library (O) . Display/hide their locations on the map
Shopping Centers: (1) , Paramus Place Shopping Center (2) , Garden State Plaza Shopping Center (3) , Fashion Center Shopping Center (4) , Paramus Park Shopping Center (5) . Display/hide their locations on the map
Main business address in Paramus include: (A) , MOVADO GROUP INC (B) , WIRELESS TELECOM GROUP INC (C) . Display/hide their locations on the map
Churches in Paramus include: (A) , Christ Lutheran Church (B) , Saint Matthew's Episcopal Church (C) , Church of the Savior (D) . Display/hide their locations on the map
Cemetery: (1) . Display/hide its location on the map
Streams, rivers, and creeks: (A) , Van Saun Mill Brook (B) , Coles Brook (C) , Behnke Brook (D) , Saint Andrews Brook (E) . Display/hide their locations on the map
Parks in Paramus include: (1) , Fireman's Park (2) , Waymele Park (3) , Sirianni Park (4) , Paramus Park (5) , Petruska Park (6) , Van Saun County Park (7) , George W Hodgins Stadium (8) . Display/hide their locations on the map
Tourist attractions:
Hotels:
Birthplace of: Elaine Zayak - Figure skater, Michael Groveman - Chief executive.
Bergen County has a predicted average indoor radon screening level between 2 and 4 pCi/L (pico curies per liter) - Moderate Potential Average household size: This borough:
2.9 peopleNew Jersey:
2.7 people
Percentage of family households: This borough:
80.4%Whole state:
69.3%
Percentage of households with unmarried partners: This borough:
1.7%Whole state:
5.9%
Likely homosexual households (counted as self-reported same-sex unmarried-partner households)
Lesbian couples: 0.3% of all households Gay men: 0.1% of all households
People in group quarters in Paramus in 2010:
572 people in hospitals with patients who have no usual home elsewhere
521 people in nursing facilities/skilled-nursing facilities
27 people in residential treatment centers for adults
18 people in group homes intended for adults
9 people in correctional facilities intended for juveniles
8 people in residential treatment centers for juveniles (non-correctional)
5 people in workers' group living quarters and job corps centers
5 people in other noninstitutional facilities
People in group quarters in Paramus in 2000:
651 people in nursing homes
454 people in hospitals/wards and hospices for chronically ill
454 people in other hospitals or wards for chronically ill
80 people in other group homes
77 people in mental (psychiatric) hospitals or wards
53 people in other noninstitutional group quarters
36 people in homes for the mentally ill
35 people in other nonhousehold living situations
34 people in hospitals or wards for drug/alcohol abuse
28 people in short-term care, detention or diagnostic centers for delinquent children
21 people in religious group quarters
16 people in other workers' dormitories
15 people in homes or halfway houses for drug/alcohol abuse
7 people in homes for the mentally retarded
Banks with most branches in Paramus (2011 data):
JPMorgan Chase Bank, National Association: Bergen Mall Banking Center Branch, Paramus - Private Banking, Midland Avenue, Paramus Branch. Info updated 2011/11/10: Bank assets: $1,811,678.0 mil, Deposits: $1,190,738.0 mil, headquarters in Columbus, OH, positive income , International Specialization, 5577 total offices , Holding Company: Jpmorgan Chase & Co.
Valley National Bank: Bergen Mall Branch, North Paramus Branch, Midland Avenue Branch, 80 East Ridgewood Avenue Branch. Info updated 2012/01/10: Bank assets: $14,186.7 mil, Deposits: $9,715.7 mil, headquarters in Wayne, NJ, positive income , Commercial Lending Specialization, 219 total offices , Holding Company: Valley National Bancorp
TD Bank, National Association: Paramus Branch, Paramus Mall Branch, Paramus Road Branch. Info updated 2010/10/04: Bank assets: $188,912.6 mil, Deposits: $153,149.8 mil, headquarters in Wilmington, DE, positive income , 1314 total offices , Holding Company: Toronto-Dominion Bank, The
Bank of America, National Association: Paramus Drive-Up Branch, Paramus - Forest Avenue Branch, Paramus - Garden State Plaza Branch. Info updated 2009/11/18: Bank assets: $1,451,969.3 mil, Deposits: $1,077,176.8 mil, headquarters in Charlotte, NC, positive income , 5782 total offices , Holding Company: Bank Of America Corporation
Columbia Bank: Farview Branch, Bergen Town Center Branch, Route 17 Branch. Info updated 2011/07/21: Bank assets: $4,478.2 mil, Deposits: $2,795.4 mil, headquarters in Fair Lawn, NJ, positive income , Commercial Lending Specialization, 44 total offices
Citibank, National Association: Paramus Branch at 231 Route 4 West, branch established on 2006/10/01; Paramus Branch at 700 Route 17, branch established on 2005/12/05. Info updated 2012/01/10: Bank assets: $1,288,658.0 mil, Deposits: $882,541.0 mil, headquarters in Sioux Falls, SD, positive income , International Specialization, 1048 total offices , Holding Company: Citigroup Inc.
Wells Fargo Bank, National Association: Paramus Pb Branch at 95 Route 17 S, branch established on 2010/04/28; Paramus-Linwood Branch at 859 Route 17, branch established on 1976/11/08. Info updated 2011/04/05: Bank assets: $1,161,490.0 mil, Deposits: $905,653.0 mil, headquarters in Sioux Falls, SD, positive income , 6395 total offices , Holding Company: Wells Fargo & Company
MARINERS BANK: Paramus Branch at 242 Oradell Avenue, branch established on 2008/08/08. Info updated 2010/07/21: Bank assets: $295.9 mil, Deposits: $268.5 mil, headquarters in Edgewater, NJ, positive income , Commercial Lending Specialization, 7 total offices , Holding Company: Mariner's Bancorp
Beal Bank, SSB: Paramus Branch at 370 N State Highwy 17, branch established on 2011/08/01. Info updated 2011/10/26: Bank assets: $3,750.0 mil, Deposits: $2,445.6 mil, headquarters in Plano, TX, positive income , Mortgage Lending Specialization, 38 total offices
2 other banks with 2 local branches
For population 15 years and over in Paramus:
Never married: 30.1%Now married: 54.5%Separated: 1.0%Widowed: 8.4%Divorced: 5.9% For population 25 years and over in Paramus:
High school or higher: 94.6%Bachelor's degree or higher: 50.3%Graduate or professional degree: 17.8%Unemployed: 2.3%Mean travel time to work (commute): 22.7 minutes
Education Gini index (Inequality in education) Here:
11.4New Jersey average:
12.8
Religion statistics for Paramus, NJ (based on Bergen County data)
Religion Adherents Congregations Catholic 430,007 80 Other 53,728 120 Mainline Protestant 45,613 210 Evangelical Protestant 33,419 234 Orthodox 14,373 20 Black Protestant 6,286 17 None 321,690 -
Source: Clifford Grammich, Kirk Hadaway, Richard Houseal, Dale E.Jones, Alexei Krindatch, Richie Stanley and Richard H.Taylor. 2012. 2010 U.S.Religion Census: Religious Congregations & Membership Study. Association of Statisticians of American Religious Bodies. Jones, Dale E., et al. 2002. Congregations and Membership in the United States 2000. Nashville, TN: Glenmary Research Center. Graphs represent county-level data
Food Environment Statistics: Number of grocery stores : 258Bergen County :
2.90 / 10,000 pop.New Jersey :
2.90 / 10,000 pop.
Number of supercenters and club stores : 5Bergen County :
0.06 / 10,000 pop.State :
0.06 / 10,000 pop.
Number of convenience stores (no gas) : 134Bergen County :
1.51 / 10,000 pop.New Jersey :
1.76 / 10,000 pop.
Number of convenience stores (with gas) : 95Bergen County :
1.07 / 10,000 pop.New Jersey :
0.81 / 10,000 pop.
Number of full-service restaurants : 718This county :
8.07 / 10,000 pop.State :
7.15 / 10,000 pop.
Adult diabetes rate : This county :
8.0%New Jersey :
8.3%
Low-income preschool obesity rate : Bergen County :
17.9%State :
18.0%
Health and Nutrition: Healthy diet rate : Here:
56.8%New Jersey:
50.6%
Average overall health of teeth and gums : This city:
54.4%New Jersey:
48.5%
Average BMI : Paramus:
27.7New Jersey:
28.5
People feeling badly about themselves : People not drinking alcohol at all : Average hours sleeping at night : General health condition : This city:
60.5%New Jersey:
56.9%
Average condition of hearing : Paramus:
79.1%New Jersey:
80.0%
More about Health and Nutrition of Paramus, NJ Residents
Local government employment and payroll (March 2022)
Function
Full-time employees
Monthly full-time payroll
Average yearly full-time wage
Part-time employees
Monthly part-time payroll
Police Protection - Officers
99 $1,403,859 $170,165 0 $0 Other and Unallocable
40 $259,109 $77,733 9 $18,146 Solid Waste Management
26 $137,788 $63,594 4 $6,098 Local Libraries
23 $139,925 $73,004 34 $33,899 Natural Resources
22 $126,442 $68,968 1 $2,022 Parks and Recreation
22 $116,316 $63,445 45 $20,487 Police - Other
18 $108,066 $72,044 57 $82,092 Streets and Highways
18 $100,974 $67,316 3 $5,784 Other Government Administration
15 $63,887 $51,110 1 $1,914 Financial Administration
14 $105,134 $90,115 1 $795 Judicial and Legal
11 $44,966 $49,054 0 $0 Health
9 $55,067 $73,423 45 $104,160 Firefighters
7 $46,757 $80,155 0 $0 Welfare
6 $39,377 $78,754 5 $7,161 Sewerage
5 $29,860 $71,664 0 $0
Totals for Government
335 $2,777,527 $99,494 205 $282,557
Paramus government finances - Expenditure in 2021 (per resident):
Construction - General - Other: $1,112,000 ($42.19)
Parks and Recreation: $531,000 ($20.14)Regular Highways: $32,000 ($1.21)Current Operations - General - Other: $22,182,000 ($841.53)
Police Protection: $12,674,000 ($480.82)Libraries: $2,736,000 ($103.80)Parks and Recreation: $2,646,000 ($100.38)Solid Waste Management: $2,266,000 ($85.97)Regular Highways: $1,806,000 ($68.52)Judicial and Legal Services: $1,577,000 ($59.83)Health - Other: $1,444,000 ($54.78)Local Fire Protection: $1,123,000 ($42.60)Central Staff Services: $897,000 ($34.03)Financial Administration: $874,000 ($33.16)Protective Inspection and Regulation - Other: $541,000 ($20.52)General Public Buildings: $535,000 ($20.30)Public Welfare - Other: $76,000 ($2.88)General - Interest on Debt: $136,000 ($5.16)
Intergovernmental to Local - Other - Sewerage: $3,196,000 ($121.25)
Total Salaries and Wages: $1,481,000 ($56.19)
Paramus government finances - Revenue in 2021 (per resident):
Charges - Parks and Recreation: $1,955,000 ($74.17)
Other: $1,212,000 ($45.98)Sewerage: $1,087,000 ($41.24)Solid Waste Management: $3,000 ($0.11)Local Intergovernmental - Other: $343,000 ($13.01)
Miscellaneous - Fines and Forfeits: $517,000 ($19.61)
General Revenue - Other: $461,000 ($17.49)Interest Earnings: $44,000 ($1.67)State Intergovernmental - General Local Government Support: $4,359,000 ($165.37)
Other: $460,000 ($17.45)Highways: $80,000 ($3.04)Tax - Property: $44,839,000 ($1701.09)
Other License: $3,034,000 ($115.10)Occupation and Business License - Other: $475,000 ($18.02)Other Selective Sales: $437,000 ($16.58)Public Utilities Sales: $373,000 ($14.15)Alcoholic Beverage License: $92,000 ($3.49)
Paramus government finances - Debt in 2021 (per resident):
Long Term Debt - Beginning Outstanding - Unspecified Public Purpose: $484,000 ($18.36)
Retired Unspecified Public Purpose: $484,000 ($18.36)
Paramus government finances - Cash and Securities in 2021 (per resident):
Bond Funds - Cash and Securities: $2,293,000 ($86.99)
Other Funds - Cash and Securities: $16,063,000 ($609.39)
6.00% of this county's 2021 resident taxpayers lived in other counties in 2020 ($117,506 average adjusted gross income )
Here:
6.00%New Jersey average:
6.70%
0.01% of residents moved from foreign countries ($60 average AGI )Bergen County:
0.01%New Jersey average:
0.01%
Top counties from which taxpayers relocated into this county between 2020 and 2021:
6.43% of this county's 2020 resident taxpayers moved to other counties in 2021 ($129,044 average adjusted gross income )
Here:
6.43%New Jersey average:
7.02%
0.01% of residents moved to foreign countries ($163 average AGI )Bergen County:
0.01%New Jersey average:
0.02%
Top counties to which taxpayers relocated from this county between 2020 and 2021:
Businesses in Paramus, NJ
Name Count Name Count
24 Hour Fitness 1 J. Jill 1 ALDO 3 J.Crew 2 AT&T 6 JCPenney 1 Abercrombie & Fitch 2 Jamba Juice 1 Abercrombie Kids 1 JoS. A. Bank 1 Aeropostale 3 Johnny Rockets 1 Aerosoles 1 Jones New York 7 American Eagle Outfitters 1 Journeys 1 Ann Taylor 3 Juicy Couture 1 Apple Store 1 Justice 2 Applebee's 1 KFC 1 Ashley Furniture 1 Kmart 1 Audi 1 Kohl's 1 Avenue 1 Kroger 1 Bakers 2 La Quinta 1 Banana Republic 2 La-Z-Boy 2 Barnes & Noble 1 LensCrafters 5 Baskin-Robbins 3 Lowe's 1 Bath & Body Works 2 Macy's 3 Bebe 1 Marriott 1 Bed Bath & Beyond 2 Marshalls 1 Brookstone 2 MasterBrand Cabinets 5 Budget Car Rental 1 McDonald's 4 Burlington Coat Factory 1 Men's Wearhouse 3 Buybuy BABY 1 Motherhood Maternity 3 CVS 1 New Balance 6 Cache 1 New York & Co 2 Casual Male XL 1 Nike 30 Catherines 1 Nissan 1 Century 21 1 Nordstrom 2 Charlotte Russe 2 Office Depot 1 Chevrolet 1 Old Navy 2 Chick-Fil-A 1 On The Border 1 Chico's 1 Pac Sun 1 Chipotle 1 Panera Bread 2 Cinnabon 2 Payless 3 Circle K 1 Penske 1 Clarks 1 PetSmart 1 Cold Stone Creamery 1 Pier 1 Imports 2 Coldwater Creek 1 Pizza Hut 1 Comfort Inn 1 Popeyes 2 Crate & Barrel 1 Qdoba Mexican Grill 1 Curves 1 RadioShack 2 Decora Cabinetry 2 Raymour & Flanigan 1 DressBarn 2 Red Lobster 1 Dressbarn 2 Ruby Tuesday 1 Dunkin Donuts 9 SAS Shoes 1 Express 2 Sears 3 Famous Footwear 1 Sephora 2 FedEx 10 Skechers USA 2 Finish Line 1 Soma Intimates 2 Foot Locker 2 Spencer Gifts 1 Ford 1 Sprint Nextel 5 Forever 21 1 Staples 2 GNC 3 Starbucks 5 GameStop 6 Stop & Shop 1 Gap 5 T.J.Maxx 1 Goodwill 1 Talbots 1 Gymboree 3 Target 1 H&M 2 The Room Place 5 H&R Block 1 Toys"R"Us 5 Haagen-Dazs 2 Trader Joe's 1 Harmon Face Values 1 UPS 16 Holiday Inn 2 Urban Outfitters 1 Hollister Co. 2 Vans 6 Home Depot 1 Verizon Wireless 5 Honda 1 Victoria's Secret 2 Hot Topic 1 Wendy's 4 Houlihan's 1 Wet Seal 1 Hyatt 1 Whole Foods Market 1 Hyundai 1 World Gym 1
Strongest AM radio stations in Paramus:
WABC (770 AM; 50 kW; NEW YORK, NY; Owner: WABC-AM RADIO, INC.)
WWRV (1330 AM; 10 kW; NEW YORK, NY; Owner: RADIO VISION CRISTIANA MANAGEMENT CORP.)
WOR (710 AM; 50 kW; NEW YORK, NY; Owner: BUCKLEY BROADCASTING CORPORATION)
WADO (1280 AM; 50 kW; NEW YORK, NY; Owner: WADO-AM LICENSE CORP.)
WEPN (1050 AM; 50 kW; NEW YORK, NY; Owner: NEW YORK AM RADIO, LLC)
WBBR (1130 AM; 50 kW; NEW YORK, NY; Owner: BLOOMBERG COMMUNICATIONS INC.)
WINS (1010 AM; 50 kW; NEW YORK, NY; Owner: INFINITY BROADCASTING OPERATIONS, INC.)
WWDJ (970 AM; 5 kW; HACKENSACK, NJ; Owner: SALEM MEDIA OF NEW YORK, LLC)
WMCA (570 AM; 50 kW; NEW YORK, NY; Owner: SALEM MEDIA OF NEW YORK, LLC)
WFAN (660 AM; 50 kW; NEW YORK, NY; Owner: INFINITY BROADCASTING OPERATIONS, INC.)
WLIB (1190 AM; 30 kW; NEW YORK, NY; Owner: ICBC BROADCAST HOLDINGS-NY, INC.)
WCBS (880 AM; 50 kW; NEW YORK, NY; Owner: INFINITY BROADCASTING OPERATIONS, INC.)
WSNR (620 AM; 20 kW; JERSEY CITY, NJ)
Strongest FM radio stations in Paramus:
WPLJ (95.5 FM; NEW YORK, NY; Owner: WPLJ-FM RADIO, INC.)
WNEW (102.7 FM; NEW YORK, NY; Owner: INFINITY BROADCASTING OPERATIONS, INC.)
WKCR-FM (89.9 FM; NEW YORK, NY; Owner: TRUSTEES OF COLUMBIA UNIVERSITY IN NEW YORK)
WKTU (103.5 FM; LAKE SUCCESS, NY; Owner: AMFM RADIO LICENSES, LLC)
WAXQ (104.3 FM; NEW YORK, NY; Owner: AMFM NEW YORK LICENSES, LLC)
WHTZ (100.3 FM; NEWARK, NJ; Owner: AMFM RADIO LICENSES, L.L.C.)
WWPR-FM (105.1 FM; NEW YORK, NY; Owner: AMFM RADIO LICENSES, L.L.C.)
WQCD (101.9 FM; NEW YORK, NY; Owner: EMMIS RADIO LICENSE CORPORATION)
WCBS-FM (101.1 FM; NEW YORK, NY; Owner: INFINITY BROADCASTING OPERATIONS, INC.)
WCAA (105.9 FM; NEWARK, NJ; Owner: WADO-AM LICENSE CORP. ("WADO"))
WBAI (99.5 FM; NEW YORK, NY; Owner: PACIFICA FOUNDATION, INC.)
WBLS (107.5 FM; NEW YORK, NY; Owner: ICBC BROADCAST HOLDINGS-NY, INC.)
WLTW (106.7 FM; NEW YORK, NY; Owner: AMFM NEW YORK LICENSES, LLC)
WQXR-FM (96.3 FM; NEW YORK, NY; Owner: THE NEW YORK TIMES ELECTRONIC MEDIA COMPANY)
WSKQ-FM (97.9 FM; NEW YORK, NY; Owner: WSKQ LICENSING, INC.)
WXRK (92.3 FM; NEW YORK, NY; Owner: INFINITY BROADCASTING OPERATIONS, INC.)
WQHT (97.1 FM; NEW YORK, NY; Owner: EMMIS LICENSE CORPORATION OF NEW YORK)
WRKS (98.7 FM; NEW YORK, NY; Owner: EMMIS RADIO LICENSE CORP OF NEW YORK)
WMSC (90.3 FM; UPPER MONTCLAIR, NJ; Owner: MONTCLAIR STATE UNIVERSITY)
WNYC-FM (93.9 FM; NEW YORK, NY; Owner: WNYC RADIO)
TV broadcast stations around Paramus:
WNYW (Channel 5; NEW YORK, NY; Owner: FOX TELEVISION STATIONS, INC.)
WCBS-TV (Channel 2; NEW YORK, NY; Owner: CBS BROADCASTING INC.)
W68DN (Channel 68; CHERRY HILL, ETC., NJ; Owner: MARCIA COHEN)
WABC-TV (Channel 7; NEW YORK, NY; Owner: AMERICAN BROADCASTING COMPANIES, INC)
WPIX (Channel 11; NEW YORK, NY; Owner: WPIX, INC.)
WWOR-TV (Channel 9; SECAUCUS, NJ; Owner: FOX TELEVISION STATIONS, INC.)
WNJU (Channel 47; LINDEN, NJ; Owner: WNJU LICENSE CORPORATION)
WFUT (Channel 68; NEWARK, NJ; Owner: UNIVISION NEW YORK LLC)
WNYE-TV (Channel 25; NEW YORK, NY; Owner: NEW YORK CITY BOARD OF EDUCATION)
WPXN-TV (Channel 31; NEW YORK, NY; Owner: PAXSON COMMUNICATIONS LICENSE COMPANY, LLC)
WXNY-LP (Channel 32; NEW YORK, NY; Owner: ISLAND BROADCASTING COMPANY)
WPXO-LP (Channel 34; EAST ORANGE, NJ; Owner: PAXSON COMMUNICATIONS LPTV, INC.)
WNBC (Channel 4; NEW YORK, NY; Owner: NATIONAL BROADCASTING COMPANY, INC.)
WNET (Channel 13; NEWARK, NJ; Owner: EDUCATIONAL BROADCASTING CORPORATION)
WXTV (Channel 41; PATERSON, NJ; Owner: WXTV LICENSE PARTNERSHIP, G.P.)
WKOB-LP (Channel 53; NEW YORK, NY; Owner: WKOB COMMUNICATIONS, INC.)
WEBR-CA (Channel 17; MANHATTAN, NY; Owner: K LICENSEE INC.)
WRNN-LP (Channel 57; NYACK, NY; Owner: LP NYACK LIMITED PARTNERSHIP)
WFME-TV (Channel 66; WEST MILFORD, NJ; Owner: FAMILY STATIONS, INC.)
W60AI (Channel 60; NEW YORK, NY; Owner: VENTANA TELEVISION, INC.)
WNXY-LP (Channel 26; NEW YORK, NY; Owner: ISLAND BROADCASTING COMPANY)
W33BS (Channel 33; DARIEN, CT; Owner: CT&T BROADCASTING, INC.)
WNYN-LP (Channel 39; NEW YORK, NY; Owner: ISLAND BROADCASTING COMPANY)
WNYX-LP (Channel 35; NEW YORK, NY; Owner: ISLAND BROADCASTING COMPANY)
W38CL (Channel 38; BRONX, NY; Owner: RENARD COMMUNICATIONS CORP.)
National Bridge Inventory (NBI) Statistics 94 Number of bridges902ft / 275m Total length $13,246,000 Total costs5,425,978 Total average daily traffic200,785 Total average daily truck traffic
New bridges - historical statistics
3 1930-1939 2 1940-1949 38 1950-1959 9 1960-1969 5 1970-1979 2 1980-1989 22 1990-1999 1 2000-2009 12 2010-2019
See full National Bridge Inventory statistics for Paramus, NJ
Home Mortgage Disclosure Act Aggregated Statistics For Year 2009(Based on 5 full tracts) A) FHA, FSA/RHS & VA B) Conventional C) Refinancings D) Home Improvement Loans E) Loans on Dwellings For 5+ Families F) Non-occupant Loans on Number Average Value Number Average Value Number Average Value Number Average Value Number Average Value Number Average Value
LOANS ORIGINATED 16 $462,188 156 $382,577 687 $335,968 50 $180,120 0 $0 14 $302,786 APPLICATIONS APPROVED, NOT ACCEPTED 0 $0 17 $428,765 68 $353,750 7 $23,429 0 $0 4 $306,250 APPLICATIONS DENIED 5 $402,400 36 $392,611 222 $397,761 27 $105,667 1 $390,000 5 $291,000 APPLICATIONS WITHDRAWN 4 $435,750 26 $378,885 135 $378,511 9 $105,444 0 $0 3 $280,333 FILES CLOSED FOR INCOMPLETENESS 1 $350,000 11 $425,545 41 $387,756 3 $48,333 0 $0 0 $0
Aggregated Statistics For Year 2008(Based on 5 full tracts) A) FHA, FSA/RHS & VA B) Conventional C) Refinancings D) Home Improvement Loans E) Loans on Dwellings For 5+ Families F) Non-occupant Loans on G) Loans On Manufactured Number Average Value Number Average Value Number Average Value Number Average Value Number Average Value Number Average Value Number Average Value
LOANS ORIGINATED 6 $475,667 171 $401,602 299 $338,970 62 $162,000 0 $0 25 $308,040 0 $0 APPLICATIONS APPROVED, NOT ACCEPTED 1 $436,000 39 $383,436 49 $342,694 20 $137,600 0 $0 1 $75,000 0 $0 APPLICATIONS DENIED 5 $364,600 38 $445,658 158 $428,797 44 $130,477 1 $452,000 10 $361,200 1 $465,000 APPLICATIONS WITHDRAWN 2 $528,500 28 $434,071 67 $390,478 6 $197,500 0 $0 1 $245,000 0 $0 FILES CLOSED FOR INCOMPLETENESS 1 $433,000 6 $661,500 25 $409,360 2 $182,500 0 $0 2 $429,000 0 $0
Aggregated Statistics For Year 2007(Based on 5 full tracts) B) Conventional C) Refinancings D) Home Improvement Loans E) Loans on Dwellings For 5+ Families F) Non-occupant Loans on G) Loans On Manufactured Number Average Value Number Average Value Number Average Value Number Average Value Number Average Value Number Average Value
LOANS ORIGINATED 286 $423,801 393 $344,684 94 $127,521 1 $1,225,000 27 $345,222 0 $0 APPLICATIONS APPROVED, NOT ACCEPTED 55 $400,309 91 $367,154 26 $137,654 0 $0 8 $455,375 0 $0 APPLICATIONS DENIED 78 $489,449 211 $409,095 54 $144,352 0 $0 10 $462,800 0 $0 APPLICATIONS WITHDRAWN 42 $460,262 88 $354,625 13 $88,308 0 $0 6 $224,667 1 $875,000 FILES CLOSED FOR INCOMPLETENESS 13 $462,462 47 $412,191 3 $231,667 0 $0 1 $329,000 0 $0
Aggregated Statistics For Year 2006(Based on 5 full tracts) B) Conventional C) Refinancings D) Home Improvement Loans E) Loans on Dwellings For 5+ Families F) Non-occupant Loans on Number Average Value Number Average Value Number Average Value Number Average Value Number Average Value
LOANS ORIGINATED 299 $433,639 477 $342,585 144 $158,472 0 $0 32 $422,125 APPLICATIONS APPROVED, NOT ACCEPTED 41 $438,951 101 $286,119 15 $93,467 0 $0 4 $345,000 APPLICATIONS DENIED 66 $500,364 181 $417,591 72 $170,833 1 $500,000 6 $348,667 APPLICATIONS WITHDRAWN 43 $491,326 146 $376,219 12 $232,833 0 $0 7 $437,571 FILES CLOSED FOR INCOMPLETENESS 6 $244,500 23 $421,913 3 $85,000 0 $0 5 $301,800
Aggregated Statistics For Year 2005(Based on 5 full tracts) B) Conventional C) Refinancings D) Home Improvement Loans F) Non-occupant Loans on Number Average Value Number Average Value Number Average Value Number Average Value
LOANS ORIGINATED 353 $424,280 602 $338,578 136 $131,559 41 $368,780 APPLICATIONS APPROVED, NOT ACCEPTED 55 $422,491 109 $278,917 11 $96,273 3 $253,667 APPLICATIONS DENIED 68 $352,559 201 $357,179 52 $165,423 16 $318,000 APPLICATIONS WITHDRAWN 99 $356,152 232 $344,582 22 $237,045 16 $378,062 FILES CLOSED FOR INCOMPLETENESS 12 $298,417 43 $367,093 4 $276,000 4 $201,750
Aggregated Statistics For Year 2004(Based on 5 full tracts) A) FHA, FSA/RHS & VA B) Conventional C) Refinancings D) Home Improvement Loans E) Loans on Dwellings For 5+ Families F) Non-occupant Loans on G) Loans On Manufactured Number Average Value Number Average Value Number Average Value Number Average Value Number Average Value Number Average Value Number Average Value
LOANS ORIGINATED 1 $359,000 309 $366,447 573 $264,318 91 $130,571 0 $0 41 $256,854 0 $0 APPLICATIONS APPROVED, NOT ACCEPTED 0 $0 42 $382,333 111 $278,459 25 $126,760 0 $0 4 $260,000 0 $0 APPLICATIONS DENIED 1 $294,000 43 $394,837 137 $309,146 44 $114,295 1 $345,000 7 $252,857 1 $250,000 APPLICATIONS WITHDRAWN 0 $0 43 $384,140 107 $270,280 13 $96,692 0 $0 4 $287,750 0 $0 FILES CLOSED FOR INCOMPLETENESS 0 $0 9 $288,444 38 $296,921 8 $119,375 0 $0 4 $231,250 0 $0
Aggregated Statistics For Year 2003(Based on 5 full tracts) A) FHA, FSA/RHS & VA B) Conventional C) Refinancings D) Home Improvement Loans E) Loans on Dwellings For 5+ Families F) Non-occupant Loans on Number Average Value Number Average Value Number Average Value Number Average Value Number Average Value Number Average Value
LOANS ORIGINATED 1 $274,000 378 $311,265 1,735 $232,613 91 $90,077 0 $0 52 $243,423 APPLICATIONS APPROVED, NOT ACCEPTED 0 $0 45 $345,711 229 $228,066 28 $94,393 0 $0 12 $272,500 APPLICATIONS DENIED 0 $0 55 $351,091 302 $281,695 35 $98,457 0 $0 15 $225,000 APPLICATIONS WITHDRAWN 0 $0 39 $314,538 194 $255,959 12 $83,333 1 $1,350,000 0 $0 FILES CLOSED FOR INCOMPLETENESS 0 $0 21 $380,571 48 $244,417 5 $70,800 0 $0 2 $250,000
Aggregated Statistics For Year 2002(Based on 2 full tracts) A) FHA, FSA/RHS & VA B) Conventional C) Refinancings D) Home Improvement Loans F) Non-occupant Loans on Number Average Value Number Average Value Number Average Value Number Average Value Number Average Value
LOANS ORIGINATED 1 $166,000 159 $308,774 544 $203,366 96 $75,198 14 $213,929 APPLICATIONS APPROVED, NOT ACCEPTED 0 $0 20 $286,200 93 $177,484 31 $85,871 2 $86,000 APPLICATIONS DENIED 0 $0 20 $243,900 88 $213,852 26 $89,346 6 $301,000 APPLICATIONS WITHDRAWN 0 $0 20 $412,000 60 $608,917 8 $159,375 2 $391,000 FILES CLOSED FOR INCOMPLETENESS 0 $0 8 $228,000 42 $251,500 5 $120,000 1 $199,000
Aggregated Statistics For Year 2001(Based on 2 full tracts) A) FHA, FSA/RHS & VA B) Conventional C) Refinancings D) Home Improvement Loans F) Non-occupant Loans on Number Average Value Number Average Value Number Average Value Number Average Value Number Average Value
LOANS ORIGINATED 1 $137,000 149 $245,591 323 $199,269 80 $60,350 15 $168,400 APPLICATIONS APPROVED, NOT ACCEPTED 1 $203,000 21 $239,095 56 $172,821 18 $50,111 1 $53,000 APPLICATIONS DENIED 0 $0 8 $383,750 68 $191,735 22 $62,773 5 $110,200 APPLICATIONS WITHDRAWN 1 $190,000 9 $290,444 64 $182,531 12 $87,417 0 $0 FILES CLOSED FOR INCOMPLETENESS 0 $0 4 $299,000 20 $173,100 5 $32,000 0 $0
Aggregated Statistics For Year 2000(Based on 2 full tracts) A) FHA, FSA/RHS & VA B) Conventional C) Refinancings D) Home Improvement Loans F) Non-occupant Loans on Number Average Value Number Average Value Number Average Value Number Average Value Number Average Value
LOANS ORIGINATED 3 $182,333 137 $225,416 80 $155,612 62 $48,290 0 $0 APPLICATIONS APPROVED, NOT ACCEPTED 0 $0 15 $296,067 32 $163,531 25 $62,280 1 $112,000 APPLICATIONS DENIED 0 $0 14 $252,500 57 $176,035 36 $57,972 5 $119,000 APPLICATIONS WITHDRAWN 0 $0 21 $225,857 44 $123,273 6 $87,500 1 $207,000 FILES CLOSED FOR INCOMPLETENESS 0 $0 1 $372,000 8 $153,250 5 $83,400 0 $0
Aggregated Statistics For Year 1999(Based on 5 full tracts) A) FHA, FSA/RHS & VA B) Conventional C) Refinancings D) Home Improvement Loans E) Loans on Dwellings For 5+ Families F) Non-occupant Loans on Number Average Value Number Average Value Number Average Value Number Average Value Number Average Value Number Average Value
LOANS ORIGINATED 2 $192,645 317 $214,877 476 $156,665 132 $43,043 1 $652,390 22 $137,573 APPLICATIONS APPROVED, NOT ACCEPTED 0 $0 45 $238,287 101 $148,698 25 $47,585 0 $0 0 $0 APPLICATIONS DENIED 1 $218,940 29 $228,260 120 $153,203 57 $52,725 0 $0 1 $170,100 APPLICATIONS WITHDRAWN 1 $202,970 32 $212,782 127 $138,138 16 $108,109 0 $0 2 $135,480 FILES CLOSED FOR INCOMPLETENESS 0 $0 4 $313,468 38 $173,300 4 $87,935 0 $0 0 $0
Detailed HMDA statistics for the following Tracts:
0421.00
, 0423.01 , 0423.02 , 0424.00 , 0425.00
Private Mortgage Insurance Companies Aggregated Statistics For Year 2009(Based on 5 full tracts) A) Conventional B) Refinancings Number Average Value Number Average Value
LOANS ORIGINATED 15 $400,267 4 $416,750 APPLICATIONS APPROVED, NOT ACCEPTED 11 $391,273 4 $375,250 APPLICATIONS DENIED 5 $421,600 0 $0 APPLICATIONS WITHDRAWN 2 $518,000 2 $591,500 FILES CLOSED FOR INCOMPLETENESS 0 $0 0 $0
Aggregated Statistics For Year 2008(Based on 5 full tracts) A) Conventional B) Refinancings C) Non-occupant Loans on Number Average Value Number Average Value Number Average Value
LOANS ORIGINATED 17 $463,882 5 $511,200 0 $0 APPLICATIONS APPROVED, NOT ACCEPTED 13 $415,615 3 $551,333 0 $0 APPLICATIONS DENIED 4 $452,500 1 $417,000 2 $389,500 APPLICATIONS WITHDRAWN 2 $505,500 1 $377,000 0 $0 FILES CLOSED FOR INCOMPLETENESS 0 $0 0 $0 0 $0
Aggregated Statistics For Year 2007(Based on 5 full tracts) A) Conventional B) Refinancings Number Average Value Number Average Value
LOANS ORIGINATED 10 $467,400 4 $523,250 APPLICATIONS APPROVED, NOT ACCEPTED 5 $447,200 0 $0 APPLICATIONS DENIED 0 $0 0 $0 APPLICATIONS WITHDRAWN 1 $495,000 0 $0 FILES CLOSED FOR INCOMPLETENESS 0 $0 0 $0
Aggregated Statistics For Year 2006(Based on 4 full tracts) A) Conventional C) Non-occupant Loans on Number Average Value Number Average Value
LOANS ORIGINATED 6 $427,000 1 $234,000 APPLICATIONS APPROVED, NOT ACCEPTED 2 $874,000 0 $0 APPLICATIONS DENIED 1 $806,000 0 $0 APPLICATIONS WITHDRAWN 0 $0 0 $0 FILES CLOSED FOR INCOMPLETENESS 0 $0 0 $0
Aggregated Statistics For Year 2005(Based on 5 full tracts) A) Conventional B) Refinancings C) Non-occupant Loans on Number Average Value Number Average Value Number Average Value
LOANS ORIGINATED 14 $431,786 1 $489,000 2 $441,000 APPLICATIONS APPROVED, NOT ACCEPTED 6 $447,667 1 $368,000 0 $0 APPLICATIONS DENIED 0 $0 0 $0 0 $0 APPLICATIONS WITHDRAWN 1 $482,000 0 $0 0 $0 FILES CLOSED FOR INCOMPLETENESS 0 $0 0 $0 0 $0
Aggregated Statistics For Year 2004(Based on 5 full tracts) A) Conventional B) Refinancings C) Non-occupant Loans on Number Average Value Number Average Value Number Average Value
LOANS ORIGINATED 16 $413,750 4 $558,500 2 $358,500 APPLICATIONS APPROVED, NOT ACCEPTED 7 $383,857 3 $299,667 0 $0 APPLICATIONS DENIED 1 $456,000 1 $630,000 0 $0 APPLICATIONS WITHDRAWN 6 $381,167 2 $472,500 2 $292,000 FILES CLOSED FOR INCOMPLETENESS 0 $0 0 $0 0 $0
Aggregated Statistics For Year 2003(Based on 5 full tracts) A) Conventional B) Refinancings C) Non-occupant Loans on Number Average Value Number Average Value Number Average Value
LOANS ORIGINATED 36 $359,972 7 $364,000 2 $299,500 APPLICATIONS APPROVED, NOT ACCEPTED 12 $423,833 4 $276,250 2 $367,000 APPLICATIONS DENIED 1 $371,000 0 $0 1 $371,000 APPLICATIONS WITHDRAWN 4 $431,500 0 $0 0 $0 FILES CLOSED FOR INCOMPLETENESS 0 $0 0 $0 0 $0
Aggregated Statistics For Year 2002(Based on 2 full tracts) A) Conventional B) Refinancings C) Non-occupant Loans on Number Average Value Number Average Value Number Average Value
LOANS ORIGINATED 18 $313,889 2 $269,000 2 $269,500 APPLICATIONS APPROVED, NOT ACCEPTED 5 $352,400 4 $306,250 0 $0 APPLICATIONS DENIED 0 $0 0 $0 0 $0 APPLICATIONS WITHDRAWN 2 $283,000 2 $279,500 2 $289,000 FILES CLOSED FOR INCOMPLETENESS 0 $0 0 $0 0 $0
Aggregated Statistics For Year 2001(Based on 2 full tracts) A) Conventional B) Refinancings C) Non-occupant Loans on Number Average Value Number Average Value Number Average Value
LOANS ORIGINATED 21 $280,810 6 $326,000 2 $229,500 APPLICATIONS APPROVED, NOT ACCEPTED 10 $257,500 3 $355,333 0 $0 APPLICATIONS DENIED 0 $0 0 $0 0 $0 APPLICATIONS WITHDRAWN 1 $288,000 0 $0 0 $0 FILES CLOSED FOR INCOMPLETENESS 0 $0 0 $0 0 $0
Aggregated Statistics For Year 2000(Based on 2 full tracts) A) Conventional B) Refinancings C) Non-occupant Loans on Number Average Value Number Average Value Number Average Value
LOANS ORIGINATED 24 $237,833 3 $267,000 0 $0 APPLICATIONS APPROVED, NOT ACCEPTED 4 $207,000 2 $204,000 0 $0 APPLICATIONS DENIED 0 $0 0 $0 0 $0 APPLICATIONS WITHDRAWN 1 $270,000 0 $0 1 $270,000 FILES CLOSED FOR INCOMPLETENESS 0 $0 0 $0 0 $0
Aggregated Statistics For Year 1999(Based on 5 full tracts) A) Conventional B) Refinancings C) Non-occupant Loans on Number Average Value Number Average Value Number Average Value
LOANS ORIGINATED 46 $249,143 15 $225,849 1 $231,960 APPLICATIONS APPROVED, NOT ACCEPTED 11 $254,300 1 $195,110 0 $0 APPLICATIONS DENIED 2 $330,600 3 $309,743 0 $0 APPLICATIONS WITHDRAWN 1 $217,000 3 $326,497 0 $0 FILES CLOSED FOR INCOMPLETENESS 1 $217,000 1 $373,470 0 $0
Detailed PMIC statistics for the following Tracts:
0421.00
, 0423.01 , 0423.02 , 0424.00 , 0425.00 Fire-safe hotels and motels in Paramus, New Jersey:
Fairfield Inn & Suites Paramus, 601 From Rd, Paramus, New Jersey 07652 Phone: (201) 262-6900
La Quinta Inn, 393 Rt 17, Paramus, New Jersey 07652 Phone: (201) 265-4200, Fax: (201) 265-0247
Holiday Inn Express, 50 Rt 17 North, Paramus, New Jersey 07652 Phone: (201) 843-5400, Fax: (201) 712-0434
Comfort Inn & Suites, 211 Rt 17 S, Paramus, New Jersey 07652 Phone: (201) 261-8686, Fax: (201) 261-0372
Courtyard By Marriott Paramus, 320 Rt 17 N, Paramus, New Jersey 07652 Phone: (201) 599-1414, Fax: (201) 599-1818
All 5 fire-safe hotels and motels in Paramus, New Jersey
Most common first names in Paramus, NJ among deceased individuals Name Count Lived (average)
John 322 74.4 years Mary 295 83.9 years Joseph 213 76.4 years William 212 77.1 years Anna 178 85.5 years Margaret 154 83.0 years Helen 147 81.8 years George 142 74.4 years Rose 127 84.6 years Charles 124 73.9 years
Most common last names in Paramus, NJ among deceased individuals Last name Count Lived (average)
Smith 51 79.5 years Johnson 30 79.4 years Miller 28 81.0 years Kim 25 81.6 years Schmidt 22 78.4 years Jones 21 76.9 years Murray 20 79.1 years Brown 19 80.9 years Lee 18 79.0 years Walsh 18 80.8 years
Paramus compared to New Jersey state average:
Median house value above state average. Unemployed percentage significantly below state average. Black race population percentage significantly below state average. Median age above state average. Renting percentage significantly below state average. Length of stay since moving in significantly above state average. Number of rooms per house above state average. Institutionalized population percentage above state average. Percentage of population with a bachelor's degree or higher above state average.
#17 on the list of "Top 101 cities with the largest percentage of people in other hospitals or wards for chronically ill (population 1,000+)"
#19 on the list of "Top 101 cities with the largest percentage of people in hospitals/wards and hospices for chronically ill (population 1,000+)"
#35 on the list of "Top 101 cities with the most local government spending on current operations of libraries per resident (population 10,000+)"
#44 on the list of "Top 101 cities with the most residents born in Lebanon (population 500+)"
#61 on the list of "Top 101 cities with the most residents born in Korea (population 500+)"
#78 on the list of "Top 101 cities with the most residents born in Turkey (population 500+)"
#84 on the list of "Top 101 cities that people commute into (largest positive percentage daily daytime population change due to commuting) (population 5,000+)"
#91 on the list of "Top 101 cities with the most residents born in Other Southern Europe (population 500+)"
#94 on the list of "Top 101 cities with the biggest property tax revenues per resident (population 10,000+)"
#96 on the list of "Top 101 cities with the largest percentage of people in hospitals or wards for drug/alcohol abuse (population 1,000+)"
#11 on the list of "Top 101 counties with the largest number of people without health insurance coverage in 2000 (pop. 50,000+)"
#11 on the list of "Top 101 counties with the most Orthodox adherents"
#14 on the list of "Top 101 counties with the lowest number of infant deaths per 1000 residents 2007-2013 (pop. 50,000+)"
#16 on the list of "Top 101 counties with the most Orthodox congregations"
#19 on the list of "Top 101 counties with the most Mainline Protestant congregations"
Top Patent Applicants
Susan Halpern (24)
Peter Chi-Hsiung Liu (16)
Ting-Chao Chou (12)
Joe Petruzzelli (12)
Abhijit Bose (12)
Jenn S. Shih (6)
Satoshi Terada (6)
Yun Mao (6)
Fei Su (5)
Peter Tulkis (5)
Total of 275 patent applications in 2008-2024.
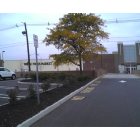
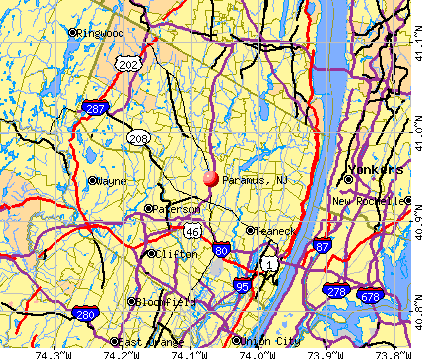


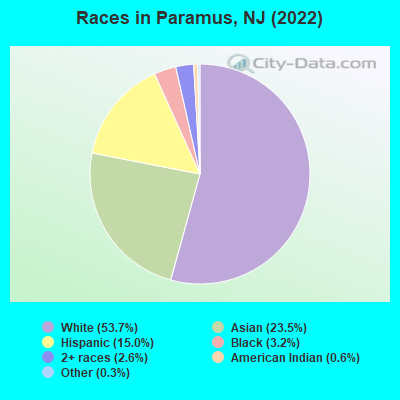
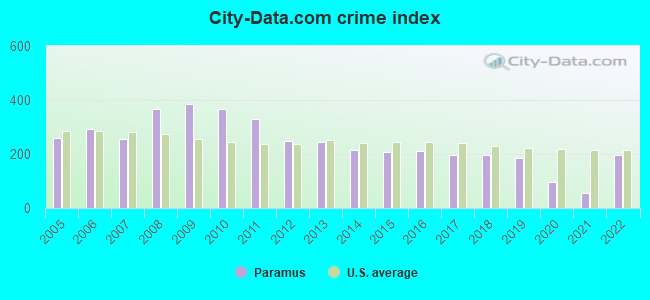
 Recent articles from our blog. Our writers, many of them Ph.D. graduates or candidates, create easy-to-read articles on a wide variety of topics.

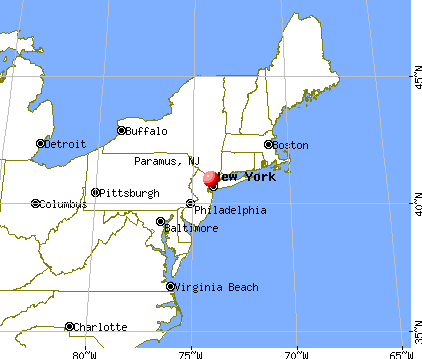
 (5.3 miles
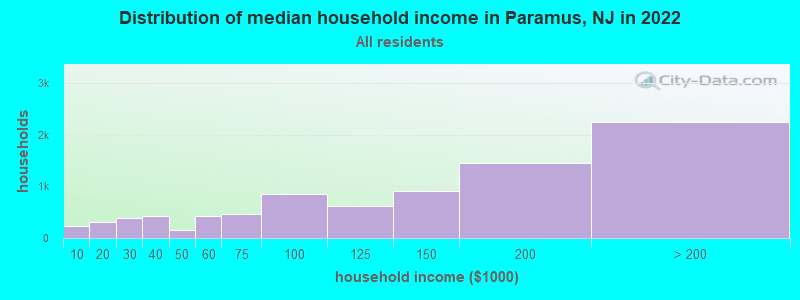
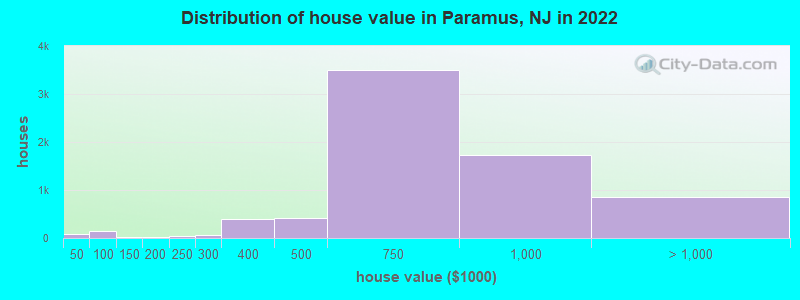

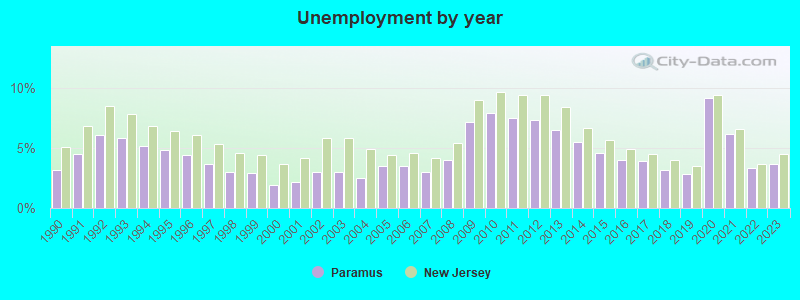
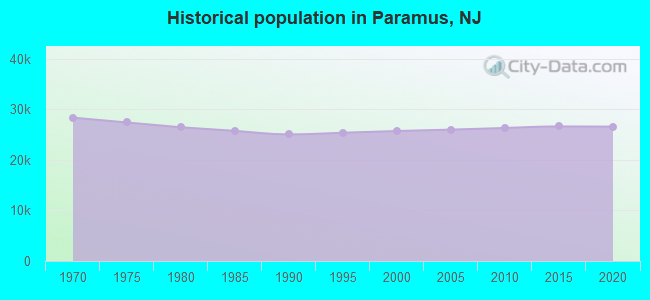
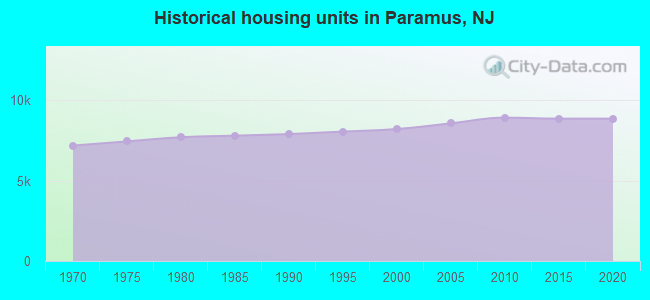
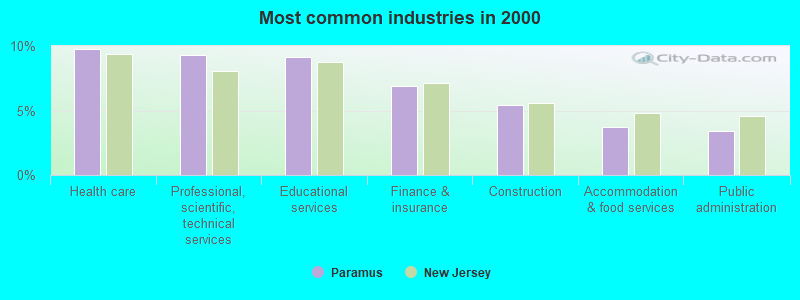
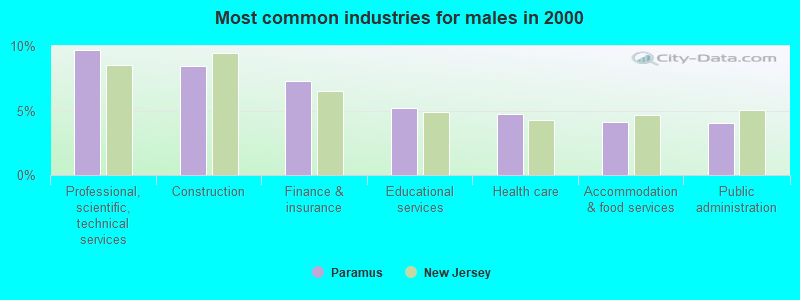
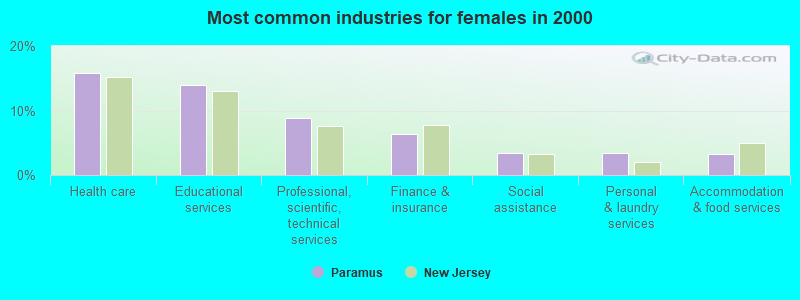
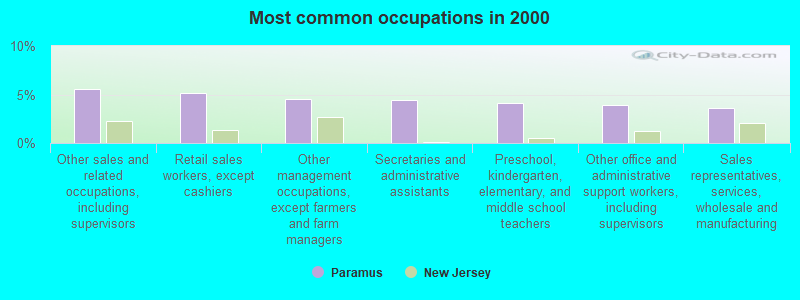
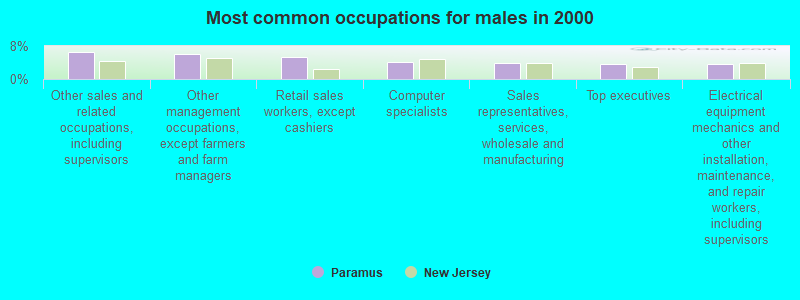
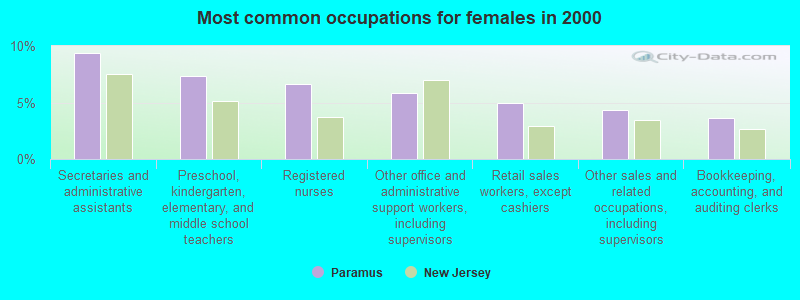


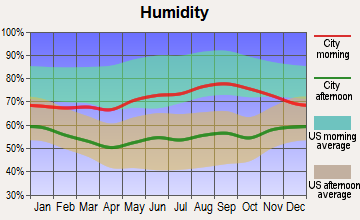


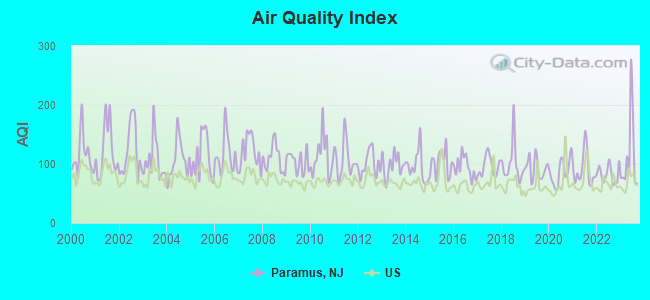
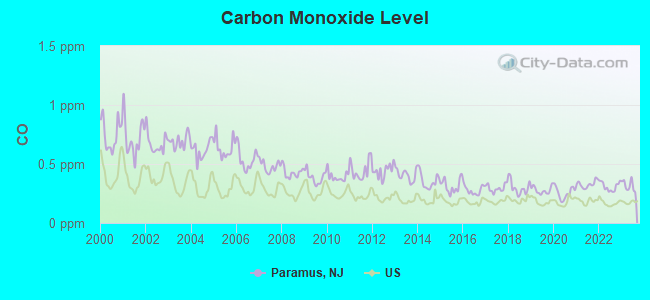
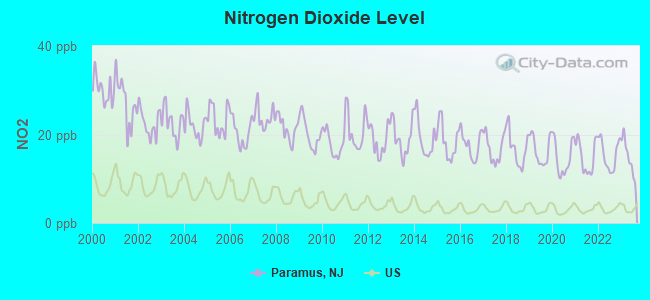
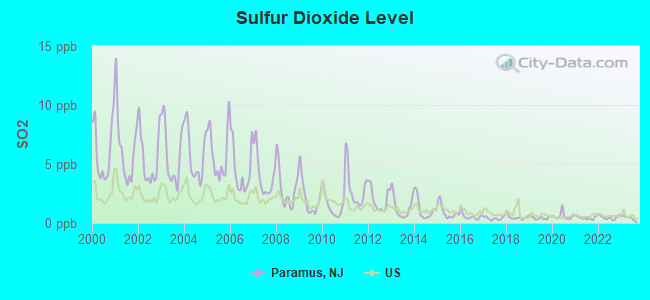
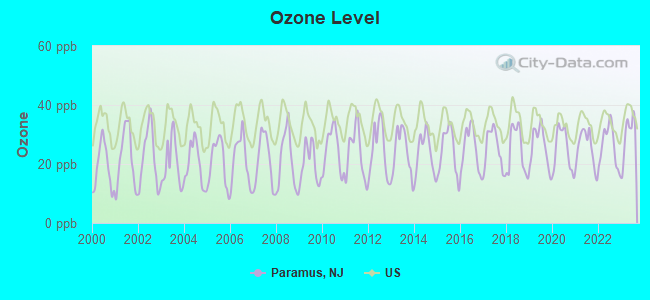
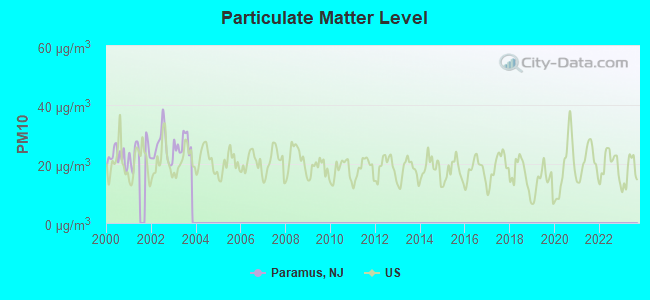
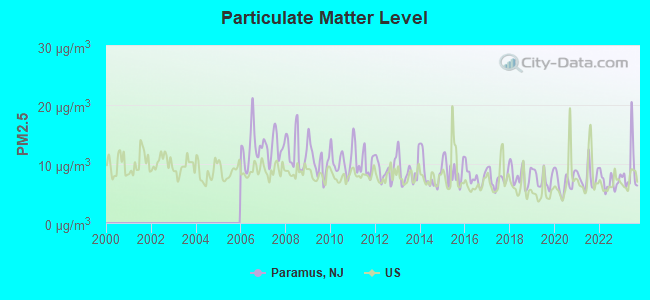
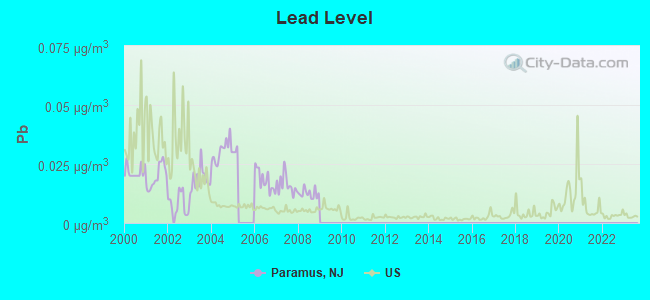
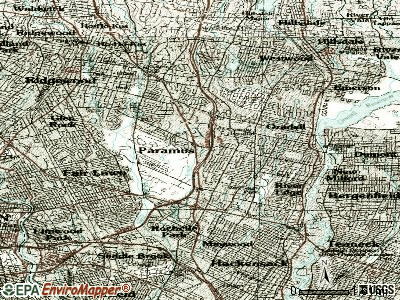
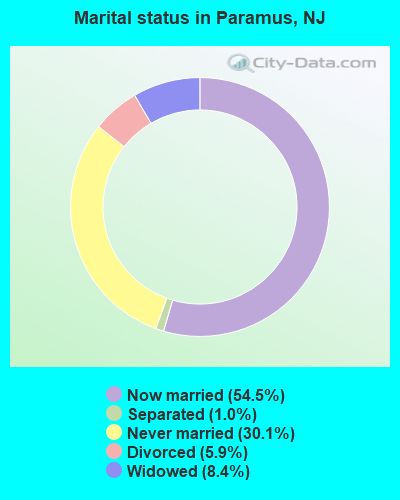
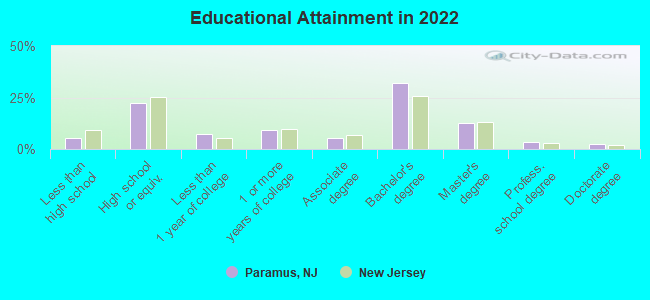
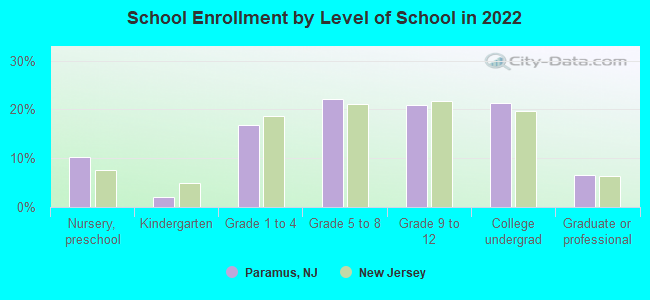
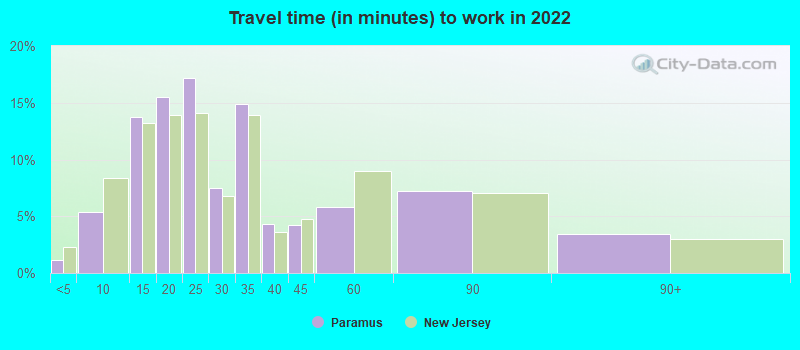
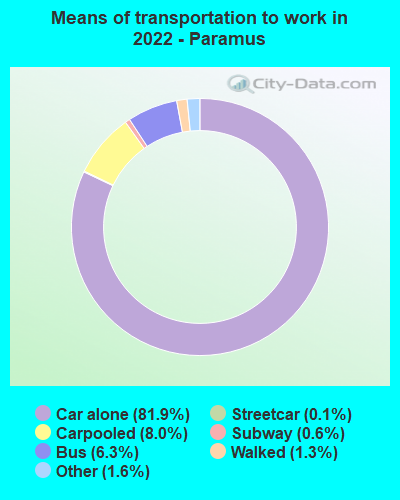
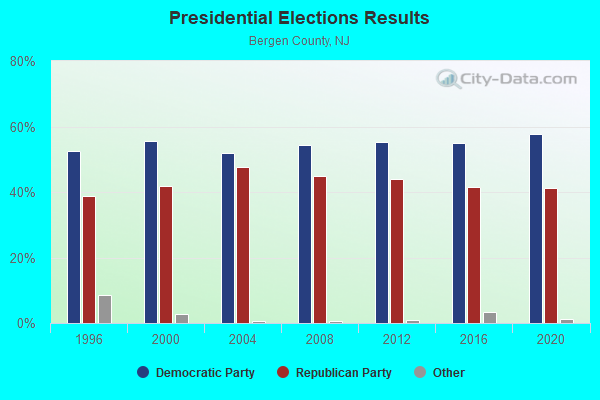
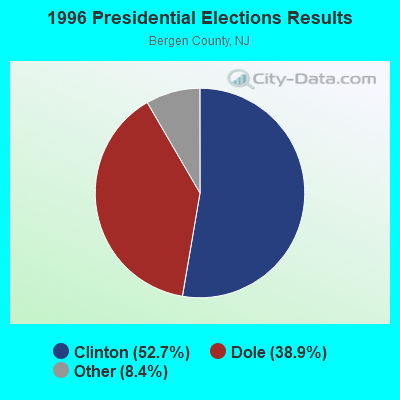
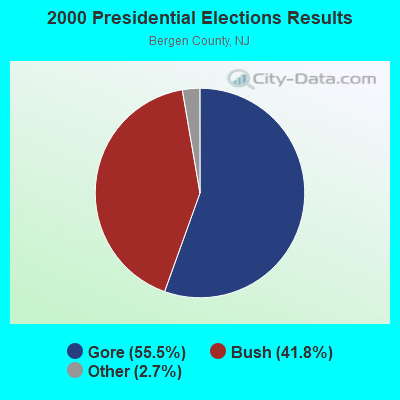
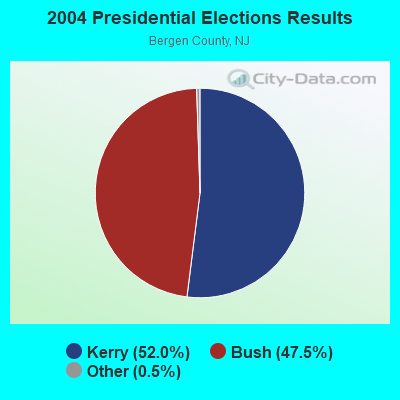
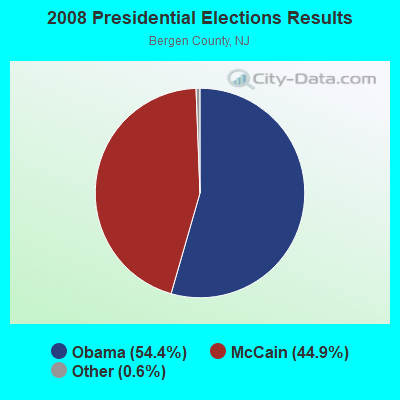


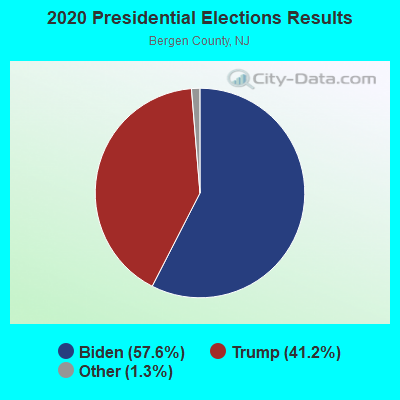
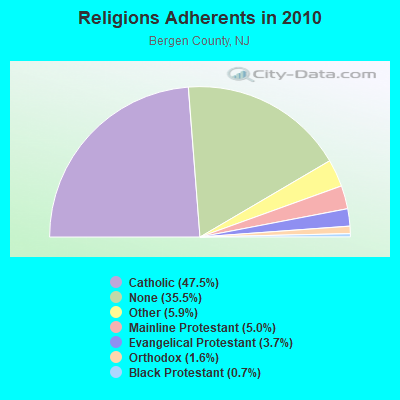
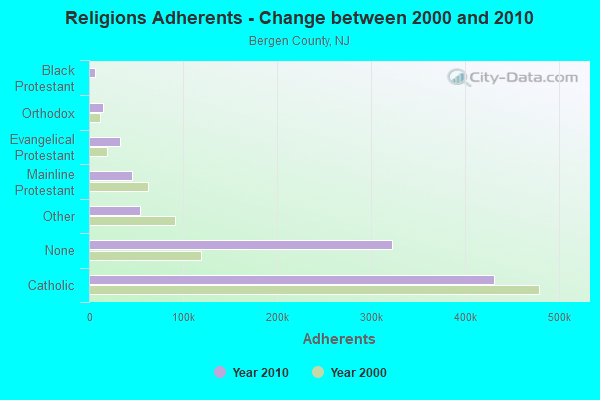
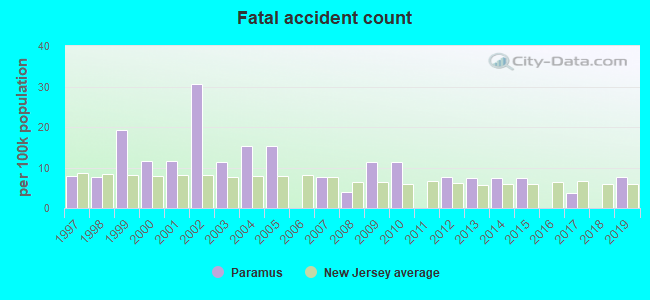
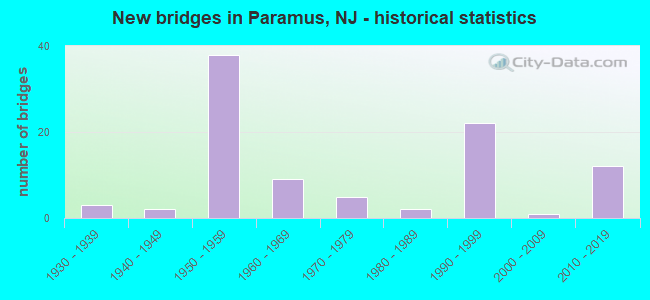
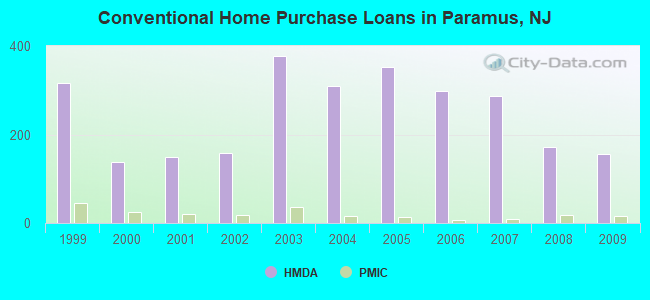
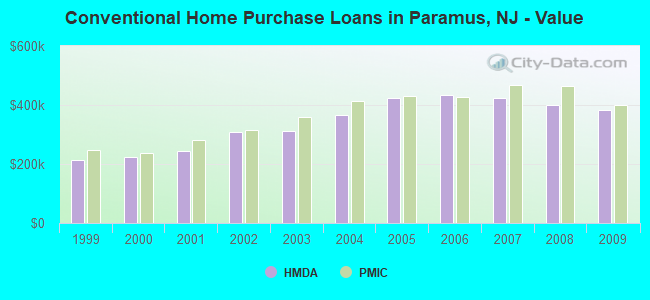
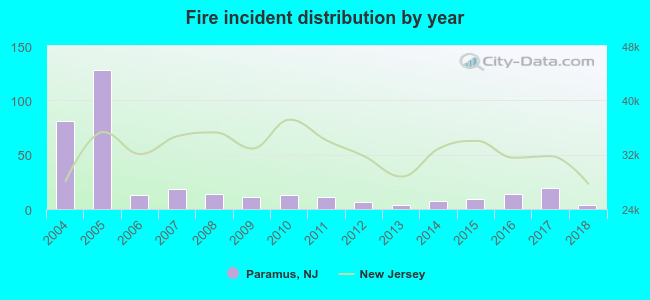 Based on the data from the years 2004 - 2018 the average number of fires per year is 23. The highest number of reported fire incidents - 128 took place in 2005, and the least - 4 in 2013. The data has a decreasing trend.
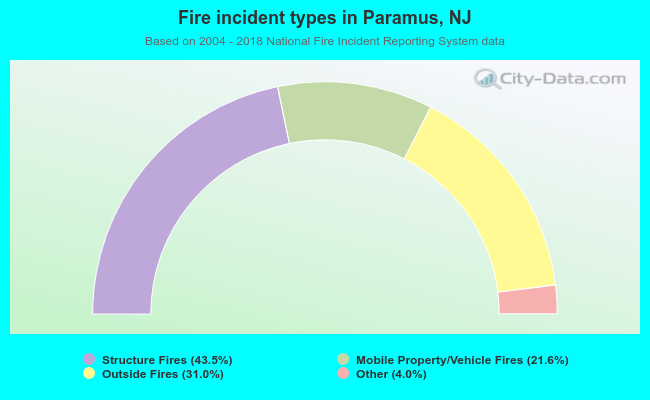 When looking into fire subcategories, the most incidents belonged to: Structure Fires (43.5%), and Outside Fires (31.0%).