Races in Paramus, New Jersey (NJ) Detailed Stats
Data:
Races - White alone (%)
Races - White alone (% change since 2000)
Races - Black alone (%)
Races - Black alone (% change since 2000)
Races - American Indian alone (%)
Races - American Indian alone (% change since 2000)
Races - Asian alone (%)
Races - Asian alone (% change since 2000)
Races - Hispanic (%)
Races - Hispanic (% change since 2000)
Races - Native Hawaiian and Other Pacific Islander alone (%)
Races - Native Hawaiian and Other Pacific Islander alone (% change since 2000)
Races - Two or more races(%)
Races - Two or more races(% change since 2000)
Races - Other race alone (%)
Races - Other race alone (% change since 2000)
Racial diversity
Place of birth - Born in state of residence (%)
Place of birth - Born in state of residence (%) - White
Place of birth - Born in state of residence (%) - Black or African American
Place of birth - Born in state of residence (%) - Asian
Place of birth - Born in state of residence (%) - Hispanic or Latino
Place of birth - Born in state of residence (%) - American Indian and Alaska Native
Place of birth - Born in state of residence (%) - Multirace
Place of birth - Born in state of residence (%) - Other Race
Place of birth - Born in other state (%)
Place of birth - Born in other state (%) - White
Place of birth - Born in other state (%) - Black or African American
Place of birth - Born in other state (%) - Asian
Place of birth - Born in other state (%) - Hispanic or Latino
Place of birth - Born in other state (%) - American Indian and Alaska Native
Place of birth - Born in other state (%) - Multirace
Place of birth - Born in other state (%) - Other Race
Place of birth - Native, outside of US (%)
Place of birth - Native, outside of US (%) - White
Place of birth - Native, outside of US (%) - Black or African American
Place of birth - Native, outside of US (%) - Asian
Place of birth - Native, outside of US (%) - Hispanic or Latino
Place of birth - Native, outside of US (%) - American Indian and Alaska Native
Place of birth - Native, outside of US (%) - Multirace
Place of birth - Native, outside of US (%) - Other Race
Place of birth - Foreign born (%)
Place of birth - Foreign born (%) - White
Place of birth - Foreign born (%) - Black or African American
Place of birth - Foreign born (%) - Asian
Place of birth - Foreign born (%) - Hispanic or Latino
Place of birth - Foreign born (%) - American Indian and Alaska Native
Place of birth - Foreign born (%) - Multirace
Place of birth - Foreign born (%) - Other Race
Residents speaking English at home (%)
Residents speaking English at home - Born in the United States (%)
Residents speaking English at home - Native, born elsewhere (%)
Residents speaking English at home - Foreign born (%)
Residents speaking Spanish at home (%)
Residents speaking Spanish at home - Born in the United States (%)
Residents speaking Spanish at home - Native, born elsewhere (%)
Residents speaking Spanish at home - Foreign born (%)
Residents speaking other language at home (%)
Residents speaking other language at home - Born in the United States (%)
Residents speaking other language at home - Native, born elsewhere (%)
Residents speaking other language at home - Foreign born (%)
Marital status - Never married (%)
Marital status - Now married (%)
Marital status - Separated (%)
Marital status - Widowed (%)
Marital status - Divorced (%)
Ancestries Reported - Arab (%)
Ancestries Reported - Czech (%)
Ancestries Reported - Danish (%)
Ancestries Reported - Dutch (%)
Ancestries Reported - English (%)
Ancestries Reported - French (%)
Ancestries Reported - French Canadian (%)
Ancestries Reported - German (%)
Ancestries Reported - Greek (%)
Ancestries Reported - Hungarian (%)
Ancestries Reported - Irish (%)
Ancestries Reported - Italian (%)
Ancestries Reported - Lithuanian (%)
Ancestries Reported - Norwegian (%)
Ancestries Reported - Polish (%)
Ancestries Reported - Portuguese (%)
Ancestries Reported - Russian (%)
Ancestries Reported - Scotch-Irish (%)
Ancestries Reported - Scottish (%)
Ancestries Reported - Slovak (%)
Ancestries Reported - Subsaharan African (%)
Ancestries Reported - Swedish (%)
Ancestries Reported - Swiss (%)
Ancestries Reported - Ukrainian (%)
Ancestries Reported - United States (%)
Ancestries Reported - Welsh (%)
Ancestries Reported - West Indian (%)
Ancestries Reported - Other (%)
Geographical mobility - Same house 1 year ago (%)
Geographical mobility - Same house 1 year ago (%) - White
Geographical mobility - Same house 1 year ago (%) - Black or African American
Geographical mobility - Same house 1 year ago (%) - Asian
Geographical mobility - Same house 1 year ago (%) - Hispanic or Latino
Geographical mobility - Same house 1 year ago (%) - American Indian and Alaska Native
Geographical mobility - Same house 1 year ago (%) - Multirace
Geographical mobility - Same house 1 year ago (%) - Other Race
Geographical mobility - Moved within same county (%)
Geographical mobility - Moved within same county (%) - White
Geographical mobility - Moved within same county (%) - Black or African American
Geographical mobility - Moved within same county (%) - Asian
Geographical mobility - Moved within same county (%) - Hispanic or Latino
Geographical mobility - Moved within same county (%) - American Indian and Alaska Native
Geographical mobility - Moved within same county (%) - Multirace
Geographical mobility - Moved within same county (%) - Other Race
Geographical mobility - Moved from different county within same state (%)
Geographical mobility - Moved from different county within same state (%) - White
Geographical mobility - Moved from different county within same state (%) - Black or African American
Geographical mobility - Moved from different county within same state (%) - Asian
Geographical mobility - Moved from different county within same state (%) - Hispanic or Latino
Geographical mobility - Moved from different county within same state (%) - American Indian and Alaska Native
Geographical mobility - Moved from different county within same state (%) - Multirace
Geographical mobility - Moved from different county within same state (%) - Other Race
Geographical mobility - Moved from different state (%)
Geographical mobility - Moved from different state (%) - White
Geographical mobility - Moved from different state (%) - Black or African American
Geographical mobility - Moved from different state (%) - Asian
Geographical mobility - Moved from different state (%) - Hispanic or Latino
Geographical mobility - Moved from different state (%) - American Indian and Alaska Native
Geographical mobility - Moved from different state (%) - Multirace
Geographical mobility - Moved from different state (%) - Other Race
Geographical mobility - Moved from abroad (%)
Geographical mobility - Moved from abroad (%) - White
Geographical mobility - Moved from abroad (%) - Black or African American
Geographical mobility - Moved from abroad (%) - Asian
Geographical mobility - Moved from abroad (%) - Hispanic or Latino
Geographical mobility - Moved from abroad (%) - American Indian and Alaska Native
Geographical mobility - Moved from abroad (%) - Multirace
Geographical mobility - Moved from abroad (%) - Other Race
Place of birth for the foreign-born population - Ireland (%)
Place of birth for the foreign-born population - Denmark (%)
Place of birth for the foreign-born population - Norway (%)
Place of birth for the foreign-born population - Sweden (%)
Place of birth for the foreign-born population - United Kingdom (%)
Place of birth for the foreign-born population - England (%)
Place of birth for the foreign-born population - Scotland (%)
Place of birth for the foreign-born population - Other Northern Europe (%)
Place of birth for the foreign-born population - Austria (%)
Place of birth for the foreign-born population - Belgium (%)
Place of birth for the foreign-born population - France (%)
Place of birth for the foreign-born population - Germany (%)
Place of birth for the foreign-born population - Netherlands (%)
Place of birth for the foreign-born population - Switzerland (%)
Place of birth for the foreign-born population - Other Western Europe (%)
Place of birth for the foreign-born population - Greece (%)
Place of birth for the foreign-born population - Italy (%)
Place of birth for the foreign-born population - Portugal (%)
Place of birth for the foreign-born population - Spain (%)
Place of birth for the foreign-born population - Other Southern Europe (%)
Place of birth for the foreign-born population - Albania (%)
Place of birth for the foreign-born population - Belarus (%)
Place of birth for the foreign-born population - Bosnia and Herzegovina (%)
Place of birth for the foreign-born population - Bulgaria (%)
Place of birth for the foreign-born population - Croatia (%)
Place of birth for the foreign-born population - Czechoslovakia (%)
Place of birth for the foreign-born population - Hungary (%)
Place of birth for the foreign-born population - Latvia (%)
Place of birth for the foreign-born population - Lithuania (%)
Place of birth for the foreign-born population - North Macedonia (Macedonia) (%)
Place of birth for the foreign-born population - Moldova (%)
Place of birth for the foreign-born population - Poland (%)
Place of birth for the foreign-born population - Romania (%)
Place of birth for the foreign-born population - Russia (%)
Place of birth for the foreign-born population - Serbia (%)
Place of birth for the foreign-born population - Ukraine (%)
Place of birth for the foreign-born population - Other Eastern Europe (%)
Place of birth for the foreign-born population - China (%)
Place of birth for the foreign-born population - Hong Kong (%)
Place of birth for the foreign-born population - Taiwan (%)
Place of birth for the foreign-born population - Japan (%)
Place of birth for the foreign-born population - Korea (%)
Place of birth for the foreign-born population - Other Eastern Asia (%)
Place of birth for the foreign-born population - Afghanistan (%)
Place of birth for the foreign-born population - Bangladesh (%)
Place of birth for the foreign-born population - India (%)
Place of birth for the foreign-born population - Iran (%)
Place of birth for the foreign-born population - Kazakhstan (%)
Place of birth for the foreign-born population - Nepal (%)
Place of birth for the foreign-born population - Pakistan (%)
Place of birth for the foreign-born population - Sri Lanka (%)
Place of birth for the foreign-born population - Uzbekistan (%)
Place of birth for the foreign-born population - Other South Central Asia (%)
Place of birth for the foreign-born population - Burma (%)
Place of birth for the foreign-born population - Cambodia (%)
Place of birth for the foreign-born population - Indonesia (%)
Place of birth for the foreign-born population - Laos (%)
Place of birth for the foreign-born population - Malaysia (%)
Place of birth for the foreign-born population - Philippines (%)
Place of birth for the foreign-born population - Singapore (%)
Place of birth for the foreign-born population - Thailand (%)
Place of birth for the foreign-born population - Vietnam (%)
Place of birth for the foreign-born population - Other South Eastern Asia (%)
Place of birth for the foreign-born population - Armenia (%)
Place of birth for the foreign-born population - Iraq (%)
Place of birth for the foreign-born population - Israel (%)
Place of birth for the foreign-born population - Jordan (%)
Place of birth for the foreign-born population - Kuwait (%)
Place of birth for the foreign-born population - Lebanon (%)
Place of birth for the foreign-born population - Saudi Arabia (%)
Place of birth for the foreign-born population - Syria (%)
Place of birth for the foreign-born population - Turkey (%)
Place of birth for the foreign-born population - Yemen (%)
Place of birth for the foreign-born population - Other Western Asia (%)
Place of birth for the foreign-born population - Eritrea (%)
Place of birth for the foreign-born population - Ethiopia (%)
Place of birth for the foreign-born population - Kenya (%)
Place of birth for the foreign-born population - Somalia (%)
Place of birth for the foreign-born population - Uganda (%)
Place of birth for the foreign-born population - Zimbabwe (%)
Place of birth for the foreign-born population - Other Eastern Africa (%)
Place of birth for the foreign-born population - Cameroon (%)
Place of birth for the foreign-born population - Congo (%)
Place of birth for the foreign-born population - Democratic Republic of Congo (Zaire) (%)
Place of birth for the foreign-born population - Other Middle Africa (%)
Place of birth for the foreign-born population - Egypt (%)
Place of birth for the foreign-born population - Morocco (%)
Place of birth for the foreign-born population - Sudan (%)
Place of birth for the foreign-born population - Other Northern Africa (%)
Place of birth for the foreign-born population - South Africa (%)
Place of birth for the foreign-born population - Other Southern Africa (%)
Place of birth for the foreign-born population - Cabo Verde (%)
Place of birth for the foreign-born population - Ghana (%)
Place of birth for the foreign-born population - Liberia (%)
Place of birth for the foreign-born population - Nigeria (%)
Place of birth for the foreign-born population - Senegal (%)
Place of birth for the foreign-born population - Sierra Leone (%)
Place of birth for the foreign-born population - Other Western Africa (%)
Place of birth for the foreign-born population - Australia (%)
Place of birth for the foreign-born population - New Zealand (%)
Place of birth for the foreign-born population - Fiji (%)
Place of birth for the foreign-born population - Micronesia (%)
Place of birth for the foreign-born population - Bahamas (%)
Place of birth for the foreign-born population - Barbados (%)
Place of birth for the foreign-born population - Cuba (%)
Place of birth for the foreign-born population - Dominica (%)
Place of birth for the foreign-born population - Dominican Republic (%)
Place of birth for the foreign-born population - Grenada (%)
Place of birth for the foreign-born population - Haiti (%)
Place of birth for the foreign-born population - Jamaica (%)
Place of birth for the foreign-born population - St. Vincent and the Grenadines (%)
Place of birth for the foreign-born population - Trinidad and Tobago (%)
Place of birth for the foreign-born population - West Indies (%)
Place of birth for the foreign-born population - Other Caribbean (%)
Place of birth for the foreign-born population - Belize (%)
Place of birth for the foreign-born population - Costa Rica (%)
Place of birth for the foreign-born population - El Salvador (%)
Place of birth for the foreign-born population - Guatemala (%)
Place of birth for the foreign-born population - Honduras (%)
Place of birth for the foreign-born population - Mexico (%)
Place of birth for the foreign-born population - Nicaragua (%)
Place of birth for the foreign-born population - Panama (%)
Place of birth for the foreign-born population - Other Central America (%)
Place of birth for the foreign-born population - Argentina (%)
Place of birth for the foreign-born population - Bolivia (%)
Place of birth for the foreign-born population - Brazil (%)
Place of birth for the foreign-born population - Chile (%)
Place of birth for the foreign-born population - Colombia (%)
Place of birth for the foreign-born population - Ecuador (%)
Place of birth for the foreign-born population - Guyana (%)
Place of birth for the foreign-born population - Peru (%)
Place of birth for the foreign-born population - Uruguay (%)
Place of birth for the foreign-born population - Venezuela (%)
Place of birth for the foreign-born population - Other South America (%)
Place of birth for the foreign-born population - Canada (%)
Place of birth for the foreign-born population - Other Northern America (%)
Place of birth for the foreign-born population - Other (%)
Latest news about races in Paramus, NJ collected exclusively by city-data.com from local newspapers, TV, and radio stations
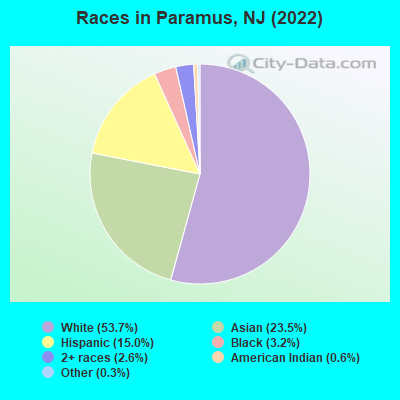
According to 2022 data, the most numerous races in Paramus, NJ are White alone (14,284 residents), Hispanic (3,993 residents), and Black alone (857 residents). 59.5% of Paramus residents speak English at home. 31.2% of Paramus, NJ residents are foreign-born (19.5% born in Asia, 5.4% born in Europe, 4.8% born in Latin America), which is 26.4% greater than the foreign-born rate of 23.0% across the entire state of New Jersey.
Race distribution in Paramus
2000 2022
5,557,209 66.0% White alone 1,117,191 13.3% Hispanic 1,096,171 13.0% Black alone 477,012 5.7% Asian alone 133,689 1.6% Two or more races 19,565 0.2% Other race alone 11,338 0.1% American Indian alone 2,175 0.03% Native Hawaiian and Other
4,766,476 51.5% White alone 2,028,470 21.9% Hispanic 1,111,632 12.0% Black alone 923,546 10.0% Asian alone 332,237 3.6% Two or more races 89,847 1.0% Other race alone 8,557 0.09% American Indian alone 934 0.01% Native Hawaiian and Other
Income and house value in Paramus Median household income in 2022 $131,624 White non-Hispanic householders$137,697 Asian householders$89,159 Two or more races householders$141,440 Hispanic or Latino race householdersMedian 2022 house value $690,866 White Non-Hispanic householdersover $1,000,000 Black or African American householders $779,597 Asian householders$599,178 Some other race householders$865,863 Two or more races householders$718,964 Hispanic or Latino householders
Median age by race in Paramus
55.1 Median age for White residents52.1 57.1 47.8 Median age for Black or African American residents42.6 54.6 32.0 Median age for American Indian / Alaska Native residents43.7 -753,722,794.2 49.0 Median age for Asian residents46.0 52.0 -510,460,250.5 Median age for Native Hawaiian / Pacific Islander residents-514,767,932.0 -713,070,378.3 41.4 Median age for Other race residents50.7 35.7 31.6 Median age for Two or more races residents31.8 35.5 55.2 Median age for White alone residents54.1 56.5 39.7 Median age for Hispanic or Latino residents38.7 40.1
Owner/renter occupied households by race in Paramus
House owners and renters - White residents 4,552 87.0% Owner occupied682 13.0% Renter occupiedHouse owners and renters - Black or African American residents 40 17.7% Owner occupied188 82.3% Renter occupiedHouse owners and renters - American Indian / Alaska Native residents 73 67.1% Owner occupied36 32.9% Renter occupiedHouse owners and renters - Asian residents 1,552 83.0% Owner occupied318 17.0% Renter occupiedHouse owners and renters - Other race residents 204 97.6% Owner occupied5 2.4% Renter occupiedHouse owners and renters - Two or more races residents 447 61.8% Owner occupied277 38.2% Renter occupiedHouse owners and renters - White alone residents 4,405 85.4% Owner occupied753 14.6% Renter occupiedHouse owners and renters - Hispanic or Latino residents 747 76.5% Owner occupied229 23.5% Renter occupied
Language usage in Paramus
English speakers - Total 59.5% of residents of Paramus speak English at home.
9.0% of residents speak Spanish at home 1,689 72.9% Speak English very well629 27.1% Speak English less than very well30.8% of residents speak other language at home 5,073 64.2% Speak English very well2,828 35.8% Speak English less than very well
English speakers - Born in the United States 80.2% of residents of Paramus speak English at home.
6.9% of residents speak Spanish at home 415 97.9% Speak English very well9 2.1% Speak English less than very well12.0% of residents speak other language at home 689 92.9% Speak English very well53 7.1% Speak English less than very well
English speakers - Native, born elsewhere 40.5% of residents of Paramus speak English at home.
20.9% of residents speak Spanish at home 82 92.1% Speak English very well7 7.9% Speak English less than very well31.1% of residents speak other language at home 84 63.6% Speak English very well48 36.4% Speak English less than very well
English speakers - Foreign-born 14.2% of residents of Paramus speak English at home.
12.7% of residents speak Spanish at home 524 49.8% Speak English very well529 50.2% Speak English less than very well72.1% of residents speak other language at home 3,360 56.3% Speak English very well2,608 43.7% Speak English less than very well
White (Caucasian) - Speak only English Native:
92.1% (10,996)Foreign-born:
30.6% (643)
White (Caucasian) - Speak another language Native:
8.4% (1,006)Foreign-born:
71.5% (1,501)
Black or African American - Speak only English Native:
99.9% (884)Foreign-born:
80.8% (36)
Asian - Speak only English Native:
33.7% (604)Foreign-born:
3.9% (167)
Asian - Speak another language Native:
65.8% (1,181)Foreign-born:
96.4% (4,133)
Other race - Speak only English Native:
21.2% (122)Foreign-born:
5.2% (22)
Other race - Speak another language Native:
79.9% (458)Foreign-born:
95.0% (405)
Two or more races - Speak only English Native:
76.0% (1,313)Foreign-born:
35.6% (407)
Two or more races - Speak another language Native:
21.7% (374)Foreign-born:
60.5% (692)
White alone - Speak only English Native:
94.0% (10,874)Foreign-born:
28.6% (642)
White alone - Speak another language Native:
6.2% (713)Foreign-born:
71.2% (1,596)
Hispanic or Latino - Speak only English Native:
45.9% (1,113)Foreign-born:
20.1% (274)
Hispanic or Latino - Speak another language Native:
52.6% (1,277)Foreign-born:
81.7% (1,115)
Foreign-born residents in Paramus 8,302 residents are foreign born (19.5% Asia , 5.4% Europe , 4.8% Latin America ).
This city:
31.2%New Jersey:
23.2%
Marital status for residents in Paramus Marital status - White (Caucasian) population 15 years and over
Males 36.4% Never married53.2% Now married0.0% Separated3.1% Widowed7.3% DivorcedFemales 25.3% Never married50.5% Now married0.9% Separated16.1% Widowed7.1% DivorcedWomen who gave birth in the past 12 months Now married:
93.1% (78)Unmarried:
6.9% (6)
Women who did not give birth in the past 12 months Now married:
36.5% (703)Unmarried:
63.5% (1,223)
Marital status - Black or African American population 15 years and over
Males 58.9% Never married29.2% Now married0.0% Separated9.0% Widowed3.0% DivorcedFemales 34.8% Never married29.7% Now married1.6% Separated6.2% Widowed27.7% DivorcedWomen who did not give birth in the past 12 months Now married:
35.7% (51)Unmarried:
64.3% (93)
Marital status - American Indian / Alaska Native population 15 years and over
Males 31.4% Never married68.6% Now married0.0% Separated0.0% Widowed0.0% DivorcedFemales 68.4% Never married31.6% Now married0.0% Separated0.0% Widowed0.0% DivorcedWomen who did not give birth in the past 12 months Now married:
31.6% (39)Unmarried:
68.4% (83)
Marital status - Asian population 15 years and over
Males 31.5% Never married64.4% Now married0.0% Separated3.1% Widowed1.0% DivorcedFemales 20.2% Never married60.6% Now married1.5% Separated11.4% Widowed6.3% DivorcedWomen who gave birth in the past 12 months Now married:
100.0% (46)Unmarried:
0.0% (0)
Women who did not give birth in the past 12 months Now married:
51.3% (621)Unmarried:
48.7% (590)
Marital status - Other race population 15 years and over
Males 16.9% Never married70.1% Now married0.0% Separated0.0% Widowed13.0% DivorcedFemales 28.0% Never married72.0% Now married0.0% Separated0.0% Widowed0.0% DivorcedWomen who gave birth in the past 12 months Now married:
100.0% (28)Unmarried:
0.0% (0)
Women who did not give birth in the past 12 months Now married:
60.8% (200)Unmarried:
39.2% (129)
Marital status - Two or more races population 15 years and over
Males 32.5% Never married55.3% Now married3.0% Separated9.2% Widowed0.0% DivorcedFemales 27.8% Never married59.9% Now married0.0% Separated8.0% Widowed4.4% DivorcedWomen who gave birth in the past 12 months Now married:
100.0% (70)Unmarried:
0.0% (0)
Women who did not give birth in the past 12 months Now married:
57.8% (404)Unmarried:
42.2% (295)
Marital status - White alone, not Hispanic / Latino population 15 years and over
Males 37.4% Never married51.6% Now married0.0% Separated3.3% Widowed7.7% DivorcedFemales 26.1% Never married50.6% Now married0.8% Separated16.2% Widowed6.3% DivorcedWomen who gave birth in the past 12 months Now married:
93.1% (90)Unmarried:
6.9% (7)
Women who did not give birth in the past 12 months Now married:
35.0% (691)Unmarried:
65.0% (1,282)
Marital status - Hispanic or Latino population 15 years and over
Males 28.1% Never married62.8% Now married1.3% Separated4.5% Widowed3.3% DivorcedFemales 22.1% Never married59.8% Now married0.5% Separated9.0% Widowed8.7% DivorcedWomen who gave birth in the past 12 months Now married:
100.0% (61)Unmarried:
0.0% (0)
Women who did not give birth in the past 12 months Now married:
56.9% (435)Unmarried:
43.1% (329)
Ancestries in Paramus
2,084 12.5% Italian942 5.7% Irish740 4.5% American364 2.2% Polish338 2.0% German228 1.4% Iranian221 1.3% Greek186 1.1% Austrian146 0.9% Syrian139 0.8% Russian124 0.7% Armenian114 0.7% Arab99 0.6% Albanian95 0.6% Romanian80 0.5% Eastern European77 0.5% English72 0.4% Turkish66 0.4% Croatian61 0.4% Portuguese58 0.3% Ukrainian57 0.3% European57 0.3% Afghan52 0.3% Dutch49 0.3% Scottish47 0.3% Czechoslovakian44 0.3% Israeli38 0.2% Northern European37 0.2% Iraqi26 0.2% Egyptian23 0.1% French Canadian21 0.1% Scotch-Irish20 0.1% Hungarian19 0.1% Lebanese18 0.1% Nigerian18 0.1% Haitian16 0.10% Bulgarian13 0.08% British12 0.07% Moroccan11 0.07% French11 0.07% Brazilian11 0.07% Swedish10 0.06% Lithuanian9 0.05% Guyanese9 0.05% Canadian9 0.05% Jamaican7 0.04% Australian7 0.04% Norwegian2 0.01% Macedonian1 0.01% Kenyan1 0.01% Maltese1 0.01% Yugoslavian
Geographical mobility in Paramus Same house 1 year ago 13,475 94.1% White (Caucasian)649 71.4% Black or African American95 44.7% American Indian / Alaska Native5,934 94.8% Asian829 81.1% Other race2,701 91.6% Two or more races13,304 93.9% White alone, not Hispanic / Latino3,497 88.1% Hispanic or LatinoMoved within same county 369 2.6% White / Caucasian20 2.2% Black or African American166 77.7% American Indian / Alaska Native124 2.0% Asian134 13.1% Other race194 6.6% Two or more races386 2.7% White alone, not Hispanic / Latino282 7.1% Hispanic or LatinoMoved within same state 139 1.0% White / Caucasian85 9.4% Black or African American17 0.3% Asian36 1.2% Two or more races164 1.2% White alone, not Hispanic / Latino29 0.7% Hispanic or LatinoMoved from different state 321 2.2% White / Caucasian201 22.1% Black or African American59 0.9% Asian30 2.9% Other race280 2.0% White alone, not Hispanic / Latino126 3.2% Hispanic or LatinoMoved from abroad 8 0.1% White15 0.2% Asian12 0.1% White alone, not Hispanic / Latino
Children Nativity (place of birth) in Paramus
Children under 6 years - Living with two parents Both parents native 409 100.0% NativeBoth parents foreign-born 289 76.9% Native87 23.1% Foreign-bornOne native, one foreign-born parent 348 100.0% NativeChildren under 6 years - Living with one parent Native parent 57 100.0% NativeChildren 6 to 17 years - Living with two parents Both parents native 1,346 98.7% Native17 1.3% Foreign-bornBoth parents foreign-born 840 79.2% Native221 20.8% Foreign-bornOne native, one foreign-born parent 451 100.0% NativeChildren 6 to 17 years - Living with one parent Native parent 176 100.0% NativeForeign-born parent 423 50.7% Native412 49.3% Foreign-born
Place of birth for residents in Paramus
Grandparents responsible for own grandchildren in Paramus
Grandparents (30 to 59 years) White / Caucasian 6 100.0% Not responsible for grandchildrenAmerican Indian / Alaska Native 22 28.7% Responsible for grandchildren55 71.3% Not responsible for grandchildrenAsian 16 100.0% Not responsible for grandchildrenOther race 17 100.0% Not responsible for grandchildrenWhite alone, not Hispanic / Latino 8 100.0% Not responsible for grandchildrenHispanic or Latino 7 100.0% Not responsible for grandchildrenGrandparents (60 years and over) White / Caucasian 236 100.0% Not responsible for grandchildrenAsian 26 11.1% Responsible for grandchildren212 88.9% Not responsible for grandchildrenOther race 76 100.0% Not responsible for grandchildrenWhite alone, not Hispanic / Latino 214 100.0% Not responsible for grandchildrenHispanic or Latino 169 100.0% Not responsible for grandchildren