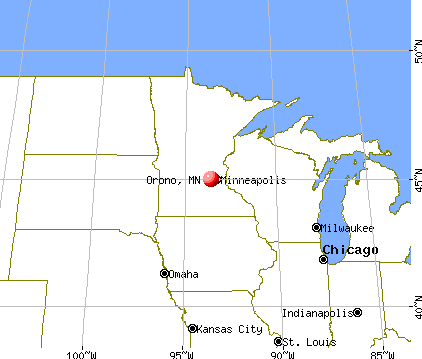
Orono, Minnesota
Orono: Early morning dew on the grass

Orono: Back yard maples in sunlight
Orono: Oak trees at Fairview Park
- add
your
Submit your own pictures of this city and show them to the world
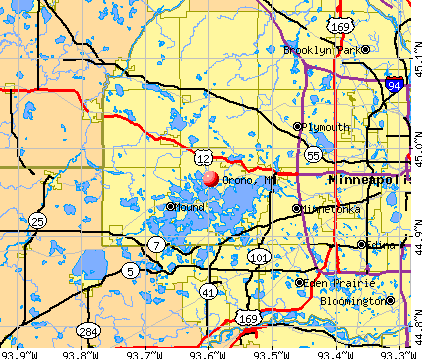
- OSM Map
- General Map
- Google Map
- MSN Map
Population change since 2000: +7.9%
 |
| Males: 4,578 | |
| Females: 3,557 |
| Median resident age: | 46.6 years |
| Minnesota median age: | 39.0 years |
Zip codes: 55384.
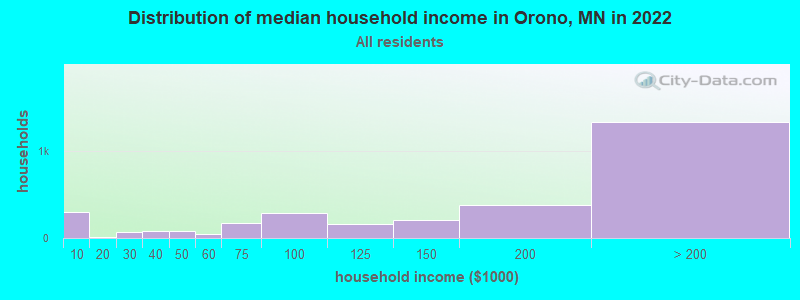
| Orono: | $167,231 |
| MN: | $82,338 |
Estimated per capita income in 2022: $136,403 (it was $65,825 in 2000)
Orono city income, earnings, and wages data
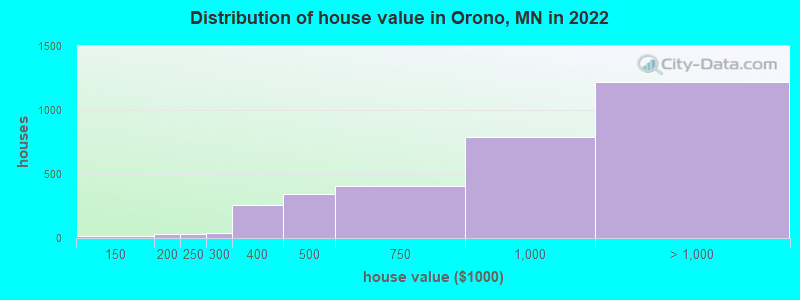
Estimated median house or condo value in 2022: $921,156 (it was $329,700 in 2000)
| Orono: | $921,156 |
| MN: | $314,600 |
Mean prices in 2022: all housing units: over $1,000,000; detached houses: over $1,000,000; townhouses or other attached units: over $1,000,000
Median gross rent in 2022: $1,640.
(7.3% for White Non-Hispanic residents, 100.0% for Black residents)
Detailed information about poverty and poor residents in Orono, MN

Compare current foreclosures near Orono, MN:
| Photo | Address | Area | Beds / Baths | Price | Details |
|---|---|---|---|---|---|

|
#1
Fairview Ln
Mound, MN 55364
|
2,112 sq. feet
|
2 baths 3 beds |
$389,900
|
show details |

|
#2
W 44th St Apt 7
Minneapolis, MN 55410
|
710 sq. feet
|
1 baths 2 beds |
$154,900
|
show details |

|
#3
1st Ave S
Minneapolis, MN 55408
|
1,932 sq. feet
|
2 baths 3 beds |
$354,900
|
show details |

|
#4
Parklawn Ave Apt 109
Minneapolis, MN 55435
|
1,121 sq. feet
|
2 baths 2 beds |
$105,000
|
show details |

|
#5
Quebec Ave N
Minneapolis, MN 55428
|
1,226 sq. feet
|
1 baths 2 beds |
$314,900
|
show details |

|
#6
Bedford Ave
Minneapolis, MN 55436
|
1,726 sq. feet
|
1 baths 3 beds |
$299,900
|
show details |

|
#7
Groveland Ave Apt 1708
Minneapolis, MN 55403
|
739 sq. feet
|
1 baths 1 beds |
$98,000
|
show details |

|
#8
York Ave S Apt 122
Minneapolis, MN 55435
|
956 sq. feet
|
1 baths 1 beds |
$157,000
|
show details |

|
#9
Newton Ave N
Minneapolis, MN 55412
|
828 sq. feet
|
1 baths 2 beds |
show details | |

|
#10
52nd Ave N
Minneapolis, MN 55446
|
1,244 sq. feet
|
2 baths 2 beds |
show details |
| Photo | Address | Area | Beds / Baths | Price | Details |
|---|---|---|---|---|---|

|
#11
Humboldt Ave N
Minneapolis, MN 55430
|
1,012 sq. feet
|
1 baths 2 beds |
show details | |

|
#12
Salem Ave
Minneapolis, MN 55416
|
925 sq. feet
|
2 baths 2 beds |
show details | |

|
#13
Knox Ave N
Minneapolis, MN 55411
|
1,118 sq. feet
|
1 baths 3 beds |
show details | |

|
#14
Fremont Ave N
Minneapolis, MN 55412
|
1,092 sq. feet
|
1 baths 3 beds |
show details | |

|
#15
Sommerville St S
Shakopee, MN 55379
|
1,123 sq. feet
|
1 baths 3 beds |
show details | |

|
#16
Garfield Ave
Minneapolis, MN 55419
|
1,729 sq. feet
|
2 baths 3 beds |
show details | |

|
#17
Toledo Ave N
Minneapolis, MN 55443
|
928 sq. feet
|
1 baths 2 beds |
show details | |

|
#18
Nicollet Mall Apt 602
Minneapolis, MN 55403
|
1,043 sq. feet
|
1 baths 1 beds |
show details | |

|
#19
Windsor Ln N
Minneapolis, MN 55443
|
1,353 sq. feet
|
1 baths 2 beds |
show details | |

|
#20
Chasewood Pkwy Apt 104
Hopkins, MN 55343
|
1,096 sq. feet
|
2 baths 2 beds |
show details |
| Photo | Address | Area | Beds / Baths | Price | Details |
|---|---|---|---|---|---|

|
#21
Hackberry Ct
Carver, MN 55315
|
2,307 sq. feet
|
2 baths 3 beds |
show details | |

|
#22
Irving Ave N
Minneapolis, MN 55411
|
1,278 sq. feet
|
2 baths 4 beds |
show details | |

|
#23
Irving Ave N
Minneapolis, MN 55411
|
1,729 sq. feet
|
1 baths 3 beds |
show details | |

|
#24
Bryant Ave N
Minneapolis, MN 55430
|
1,368 sq. feet
|
1 baths 3 beds |
show details | |

|
#25
Winnetka Ave N
Minneapolis, MN 55428
|
962 sq. feet
|
1 baths 3 beds |
show details | |

|
#26
Hampshire Ave N
Minneapolis, MN 55428
|
1,320 sq. feet
|
2 baths 2 beds |
show details | |

|
#27
N Maplebrook Cir
Minneapolis, MN 55445
|
928 sq. feet
|
2 baths 2 beds |
show details | |

|
#28
James Ave N
Minneapolis, MN 55412
|
1,197 sq. feet
|
1 baths 3 beds |
show details | |

|
#29
Joy Ln
Hopkins, MN 55305
|
2,168 sq. feet
|
2 baths 2 beds |
show details | |

|
#30
James Ave N
Minneapolis, MN 55412
|
918 sq. feet
|
1 baths 3 beds |
show details |
| Photo | Address | Area | Beds / Baths | Price | Details |
|---|---|---|---|---|---|

|
#31
Spencer St S
Shakopee, MN 55379
|
1,474 sq. feet
|
1 baths 4 beds |
show details | |

|
#32
Logan Ave N
Minneapolis, MN 55412
|
1,212 sq. feet
|
1 baths 3 beds |
show details | |

|
#33
25th Pl N Unit C
Minneapolis, MN 55447
|
1,344 sq. feet
|
3 baths 2 beds |
show details | |

|
#34
2nd Ave N
Minneapolis, MN 55405
|
1,092 sq. feet
|
1 baths 3 beds |
show details | |

|
#35
Knox Ave N
Minneapolis, MN 55430
|
552 sq. feet
|
1 baths 1 beds |
show details | |

|
#36
Florida Ave S
Minneapolis, MN 55426
|
1,273 sq. feet
|
2 baths 3 beds |
show details | |

|
#37
Willow Ave N
Minneapolis, MN 55411
|
2,556 sq. feet
|
2 baths 4 beds |
show details | |

|
#38
Cedar Lake Rd Apt 208
Hopkins, MN 55305
|
812 sq. feet
|
1 baths 1 beds |
show details | |

|
#39
Hampshire Ave S
Minneapolis, MN 55426
|
1,116 sq. feet
|
2 baths 3 beds |
show details | |

|
#40
Girard Ave N
Minneapolis, MN 55430
|
1,058 sq. feet
|
1 baths 2 beds |
show details |
| Photo | Address | Area | Beds / Baths | Price | Details |
|---|---|---|---|---|---|

|
#41
N 6th St
Minneapolis, MN 55430
|
1,040 sq. feet
|
2 baths 3 beds |
show details | |

|
#42
W 34 1/2 St
Minneapolis, MN 55426
|
1,387 sq. feet
|
1 baths 3 beds |
show details | |

|
#43
Oliver Ave N
Minneapolis, MN 55412
|
1,516 sq. feet
|
1 baths 3 beds |
show details | |

|
#44
Xenia Ave N
Minneapolis, MN 55422
|
780 sq. feet
|
1 baths 3 beds |
show details | |

|
#45
Newton Ave N
Minneapolis, MN 55412
|
1,220 sq. feet
|
1 baths 2 beds |
show details | |

|
#46
Bryant Ave N
Minneapolis, MN 55430
|
1,180 sq. feet
|
1 baths 3 beds |
show details | |

|
#47
Scott Ln
Minneapolis, MN 55422
|
1,686 sq. feet
|
3 baths 3 beds |
show details | |

|
#48
Larch Ln N
Osseo, MN 55369
|
1,845 sq. feet
|
3 baths 4 beds |
show details | |

|
#49
64th Ave N
Minneapolis, MN 55429
|
1,131 sq. feet
|
1 baths 3 beds |
show details | |

|
Check over 1 million property listings on Foreclosure.com!
|
browse all offers | |||


- 7,07286.7%White alone
- 4886.0%Asian alone
- 2793.4%Two or more races
- 2443.0%Other race alone
- 220.3%Hispanic
- 40.05%Black alone
- 30.04%American Indian alone
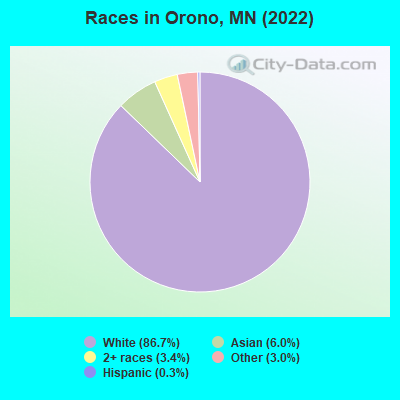
Races in Orono detailed stats: ancestries, foreign born residents, place of birth
Type |
2009 |
2010 |
2011 |
2012 |
2013 |
2014 |
2015 |
2016 |
2017 |
2018 |
2019 |
2020 |
2021 |
2022 |
|---|---|---|---|---|---|---|---|---|---|---|---|---|---|---|
| Murders (per 100,000) | 0 (0.0) | 0 (0.0) | 0 (0.0) | 0 (0.0) | 1 (4.7) | 0 (0.0) | 0 (0.0) | 0 (0.0) | 1 (5.0) | 0 (0.0) | 1 (4.9) | 0 (0.0) | 0 (0.0) | 1 (5.2) |
| Rapes (per 100,000) | 0 (0.0) | 0 (0.0) | 0 (0.0) | 0 (0.0) | 0 (0.0) | 2 (9.4) | 0 (0.0) | 1 (5.1) | 5 (25.1) | 3 (14.8) | 6 (29.5) | 6 (29.4) | 10 (49.4) | 5 (26.0) |
| Robberies (per 100,000) | 1 (8.3) | 0 (0.0) | 2 (17.4) | 0 (0.0) | 0 (0.0) | 0 (0.0) | 1 (4.7) | 0 (0.0) | 1 (5.0) | 1 (4.9) | 2 (9.8) | 1 (4.9) | 1 (4.9) | 1 (5.2) |
| Assaults (per 100,000) | 3 (25.0) | 5 (43.8) | 0 (0.0) | 6 (51.5) | 3 (14.2) | 3 (14.1) | 1 (4.7) | 2 (10.1) | 4 (20.1) | 2 (9.9) | 5 (24.6) | 8 (39.2) | 7 (34.6) | 16 (83.1) |
| Burglaries (per 100,000) | 32 (266.6) | 17 (149.0) | 19 (165.2) | 43 (369.2) | 44 (207.6) | 22 (103.3) | 23 (107.2) | 15 (75.8) | 18 (90.3) | 23 (113.7) | 25 (122.9) | 21 (103.0) | 14 (69.2) | 23 (119.5) |
| Thefts (per 100,000) | 97 (808.2) | 92 (806.1) | 99 (860.8) | 89 (764.2) | 197 (929.7) | 150 (704.6) | 124 (578.0) | 143 (722.3) | 99 (496.9) | 93 (459.8) | 100 (491.4) | 116 (569.0) | 106 (523.7) | 66 (342.9) |
| Auto thefts (per 100,000) | 5 (41.7) | 2 (17.5) | 1 (8.7) | 1 (8.6) | 5 (23.6) | 12 (56.4) | 4 (18.6) | 8 (40.4) | 5 (25.1) | 2 (9.9) | 0 (0.0) | 4 (19.6) | 17 (84.0) | 12 (62.4) |
| Arson (per 100,000) | 0 (0.0) | 0 (0.0) | 1 (8.7) | 0 (0.0) | 0 (0.0) | 1 (4.7) | 1 (4.7) | 1 (5.1) | 0 (0.0) | 0 (0.0) | 0 (0.0) | 0 (0.0) | 1 (4.9) | 0 (0.0) |
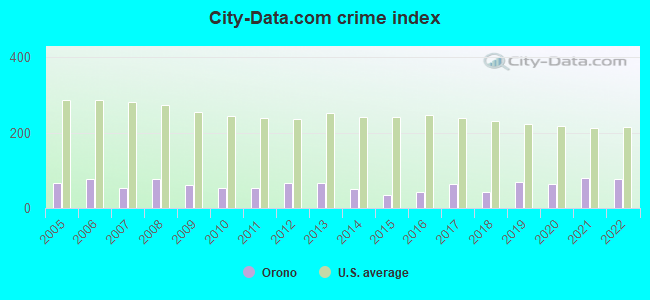
| City-Data.com crime index | 61.8 | 52.8 | 51.9 | 67.4 | 65.9 | 50.3 | 34.4 | 43.5 | 63.8 | 42.5 | 69.5 | 64.4 | 80.4 | 76.4 |
The City-Data.com crime index weighs serious crimes and violent crimes more heavily. Higher means more crime, U.S. average is 246.1. It adjusts for the number of visitors and daily workers commuting into cities.
Crime rate in Orono detailed stats: murders, rapes, robberies, assaults, burglaries, thefts, arson
Full-time law enforcement employees in 2021, including police officers: 31 (27 officers - 23 male; 4 female).
| Officers per 1,000 residents here: | 1.33 |
| Minnesota average: | 1.76 |
 Recent articles from our blog. Our writers, many of them Ph.D. graduates or candidates, create easy-to-read articles on a wide variety of topics.

 | Driving directions to Orono (1 reply) |
| Minnetonka vs Orono vs Wayzata (1 reply) |
| Orono or Minnetonka schools? (38 replies) |
| Orno vs Westonka Schools (1 reply) |
| Evening Commute from Hopkins to Orono? (2 replies) |
| Suggestions for places to live that aren't St. Cloud needed (29 replies) |
Latest news from Orono, MN collected exclusively by city-data.com from local newspapers, TV, and radio stations
Ancestries: German (15.9%), Norwegian (14.8%), Swedish (9.6%), American (7.9%), English (7.4%), Irish (6.9%).
Current Local Time: CST time zone
Incorporated in 1955
Elevation: 970 feet
Land area: 16.1 square miles.
Population density: 506 people per square mile (low).
454 residents are foreign born (3.9% Asia, 1.0% Europe).
| This city: | 5.6% |
| Minnesota: | 8.5% |
Median real estate property taxes paid for housing units with mortgages in 2022: $8,069 (0.9%)
Median real estate property taxes paid for housing units with no mortgage in 2022: $7,623 (0.9%)
Nearest city with pop. 50,000+: Minnetonka, MN  (7.0 miles , pop. 51,301).
Nearest city with pop. 200,000+: Minneapolis, MN (16.1 miles , pop. 382,618).
Nearest city with pop. 1,000,000+: Chicago, IL (367.4 miles , pop. 2,896,016).
Nearest cities:
), ), )Latitude: 44.96 N, Longitude: 93.60 W
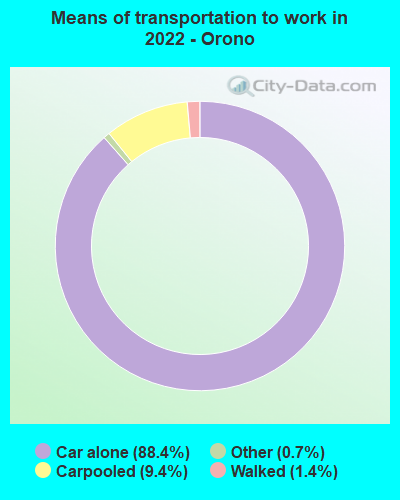
Daytime population change due to commuting: -449 (-5.5%)
Workers who live and work in this city: 1,673 (42.1%)

Orono, Minnesota accommodation & food services, waste management - Economy and Business Data
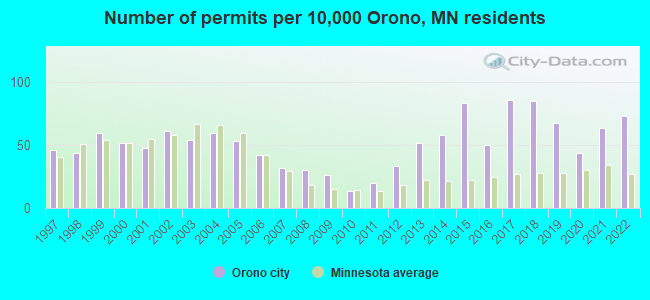
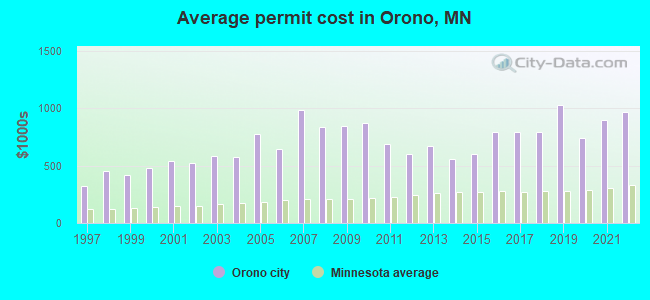
Single-family new house construction building permits:
- 2022: 55 buildings, average cost: $970,100
- 2021: 48 buildings, average cost: $898,200
- 2020: 33 buildings, average cost: $741,000
- 2019: 51 buildings, average cost: $1,029,500
- 2018: 64 buildings, average cost: $795,700
- 2017: 65 buildings, average cost: $789,500
- 2016: 38 buildings, average cost: $789,700
- 2015: 63 buildings, average cost: $598,400
- 2014: 44 buildings, average cost: $553,800
- 2013: 39 buildings, average cost: $673,900
- 2012: 25 buildings, average cost: $598,100
- 2011: 15 buildings, average cost: $686,600
- 2010: 10 buildings, average cost: $868,100
- 2009: 20 buildings, average cost: $844,900
- 2008: 23 buildings, average cost: $836,800
- 2007: 24 buildings, average cost: $986,200
- 2006: 32 buildings, average cost: $641,500
- 2005: 40 buildings, average cost: $777,500
- 2004: 45 buildings, average cost: $574,900
- 2003: 41 buildings, average cost: $582,500
- 2002: 46 buildings, average cost: $526,200
- 2001: 36 buildings, average cost: $538,200
- 2000: 39 buildings, average cost: $478,500
- 1999: 45 buildings, average cost: $419,300
- 1998: 33 buildings, average cost: $453,200
- 1997: 35 buildings, average cost: $324,000
| Here: | 2.2% |
| Minnesota: | 2.6% |
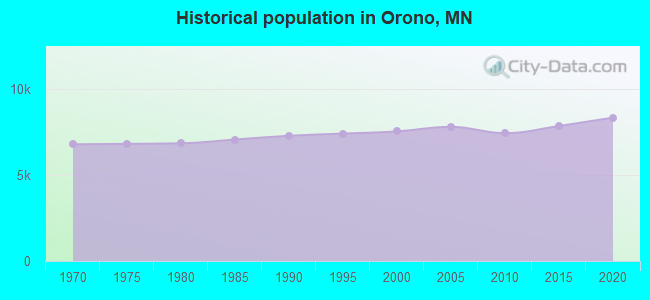
Population change in the 1990s: +114 (+1.5%).
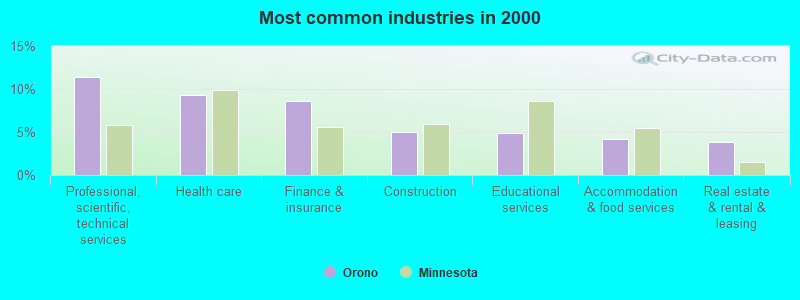
- Professional, scientific, technical services (11.4%)
- Health care (9.2%)
- Finance & insurance (8.6%)
- Construction (5.0%)
- Educational services (4.9%)
- Accommodation & food services (4.2%)
- Real estate & rental & leasing (3.8%)
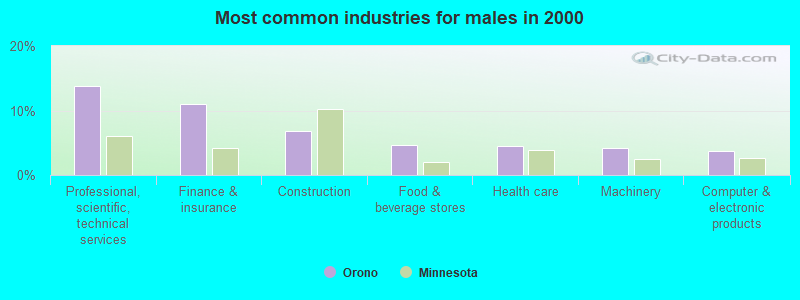
- Professional, scientific, technical services (13.8%)
- Finance & insurance (11.0%)
- Construction (6.8%)
- Food & beverage stores (4.7%)
- Health care (4.5%)
- Machinery (4.2%)
- Computer & electronic products (3.7%)
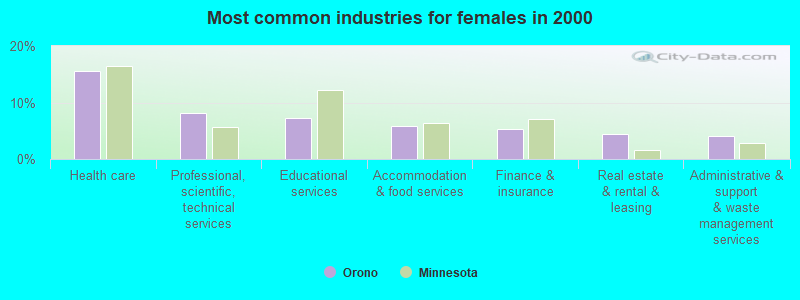
- Health care (15.6%)
- Professional, scientific, technical services (8.1%)
- Educational services (7.3%)
- Accommodation & food services (5.9%)
- Finance & insurance (5.3%)
- Real estate & rental & leasing (4.4%)
- Administrative & support & waste management services (4.1%)
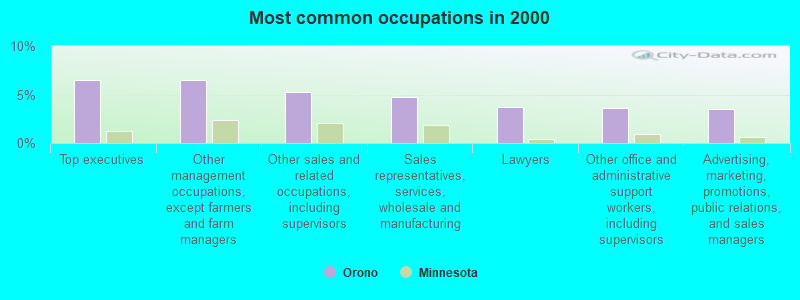
- Top executives (6.5%)
- Other management occupations, except farmers and farm managers (6.5%)
- Other sales and related occupations, including supervisors (5.3%)
- Sales representatives, services, wholesale and manufacturing (4.8%)
- Lawyers (3.7%)
- Other office and administrative support workers, including supervisors (3.6%)
- Advertising, marketing, promotions, public relations, and sales managers (3.5%)

- Top executives (10.8%)
- Sales representatives, services, wholesale and manufacturing (6.1%)
- Other sales and related occupations, including supervisors (5.9%)
- Other management occupations, except farmers and farm managers (5.6%)
- Lawyers (5.4%)
- Engineers (4.3%)
- Advertising, marketing, promotions, public relations, and sales managers (3.8%)
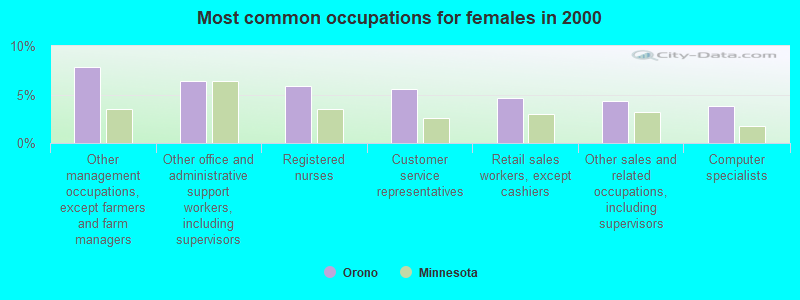
- Other management occupations, except farmers and farm managers (7.8%)
- Other office and administrative support workers, including supervisors (6.4%)
- Registered nurses (5.9%)
- Customer service representatives (5.5%)
- Retail sales workers, except cashiers (4.7%)
- Other sales and related occupations, including supervisors (4.4%)
- Computer specialists (3.8%)
Average climate in Orono, Minnesota
Based on data reported by over 4,000 weather stations


|
|

(lower is better)
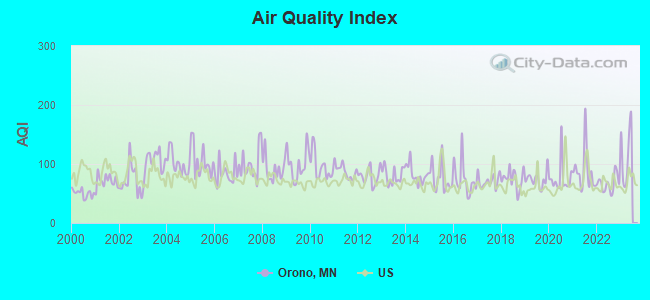
Air Quality Index (AQI) level in 2022 was 66.8. This is about average.
| City: | 66.8 |
| U.S.: | 72.6 |
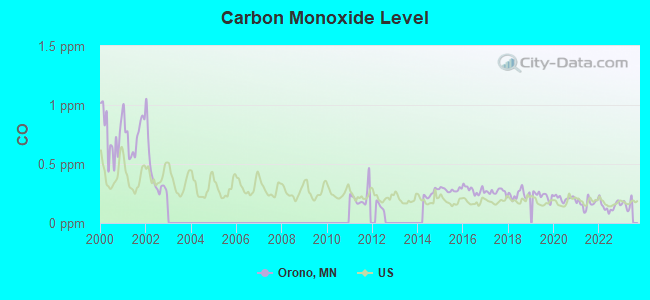
Carbon Monoxide (CO) [ppm] level in 2022 was 0.144. This is significantly better than average. Closest monitor was 15.3 miles away from the city center.
| City: | 0.144 |
| U.S.: | 0.251 |
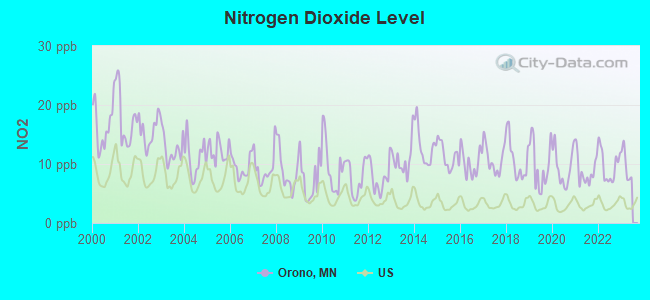
Nitrogen Dioxide (NO2) [ppb] level in 2022 was 9.71. This is significantly worse than average. Closest monitor was 8.4 miles away from the city center.
| City: | 9.71 |
| U.S.: | 5.11 |
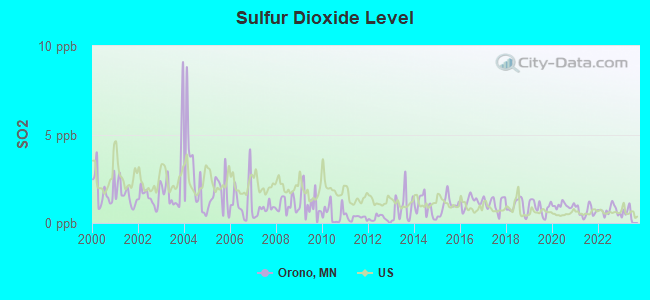
Sulfur Dioxide (SO2) [ppb] level in 2022 was 0.714. This is significantly better than average. Closest monitor was 8.4 miles away from the city center.
| City: | 0.714 |
| U.S.: | 1.515 |
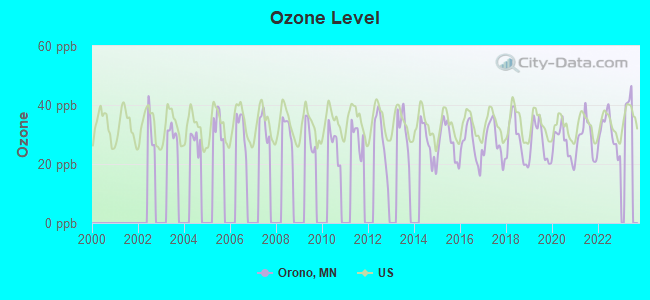
Ozone [ppb] level in 2022 was 30.7. This is about average. Closest monitor was 12.7 miles away from the city center.
| City: | 30.7 |
| U.S.: | 33.3 |
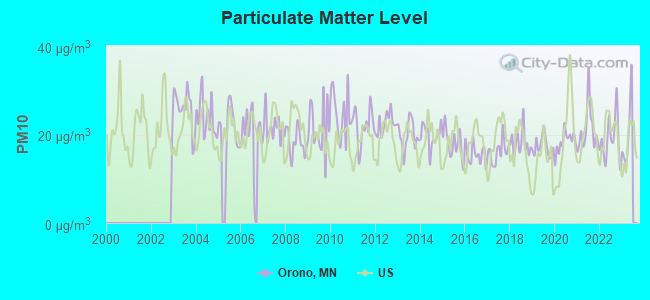
Particulate Matter (PM10) [µg/m3] level in 2022 was 18.9. This is about average. Closest monitor was 9.8 miles away from the city center.
| City: | 18.9 |
| U.S.: | 19.2 |
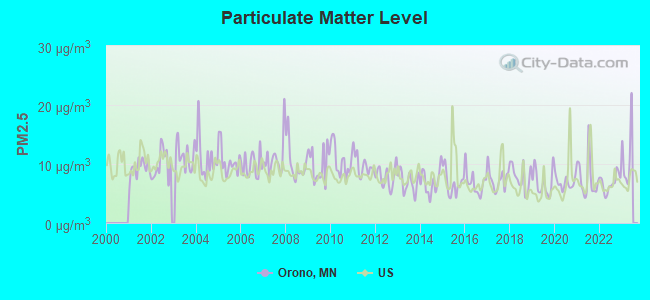
Particulate Matter (PM2.5) [µg/m3] level in 2022 was 6.80. This is about average. Closest monitor was 12.5 miles away from the city center.
| City: | 6.80 |
| U.S.: | 8.11 |
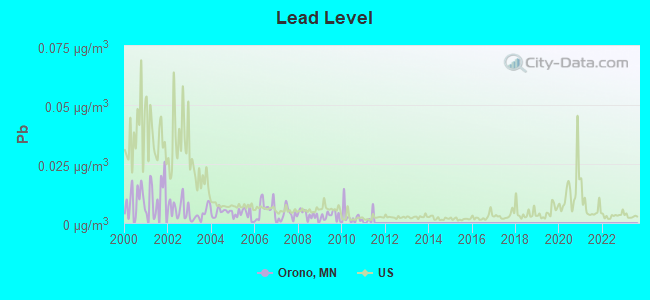
Lead (Pb) [µg/m3] level in 2010 was 0.00259. This is significantly better than average. Closest monitor was 4.2 miles away from the city center.
| City: | 0.00259 |
| U.S.: | 0.00931 |
Tornado activity:
Orono-area historical tornado activity is slightly above Minnesota state average. It is 28% greater than the overall U.S. average.
On 5/6/1965, a category F4 (max. wind speeds 207-260 mph) tornado 3.4 miles away from the Orono city center caused between $5,000,000 and $50,000,000 in damages.
On 5/6/1965, a category F4 tornado 6.5 miles away from the city center killed 3 people and injured 175 people and caused between $5,000,000 and $50,000,000 in damages.
Earthquake activity:
Orono-area historical earthquake activity is significantly above Minnesota state average. It is 53% smaller than the overall U.S. average.On 7/9/1975 at 14:54:15, a magnitude 4.6 (4.6 MB, Class: Light, Intensity: IV - V) earthquake occurred 128.5 miles away from the city center
On 6/5/1993 at 01:24:53, a magnitude 4.1 (4.1 LG, Depth: 6.2 mi) earthquake occurred 140.0 miles away from Orono center
On 3/4/1983 at 06:32:18, a magnitude 4.6 (4.4 MB, 4.6 LG, 4.4 ML) earthquake occurred 290.9 miles away from the city center
On 10/20/1995 at 15:57:18, a magnitude 3.7 (3.7 LG, Depth: 3.1 mi, Class: Light, Intensity: II - III) earthquake occurred 168.7 miles away from the city center
On 2/9/1994 at 08:45:35, a magnitude 3.1 (3.1 LG, Depth: 3.1 mi) earthquake occurred 68.7 miles away from Orono center
On 11/3/2002 at 20:41:56, a magnitude 4.3 (4.3 MB, Depth: 3.1 mi) earthquake occurred 304.7 miles away from Orono center
Magnitude types: regional Lg-wave magnitude (LG), body-wave magnitude (MB), local magnitude (ML)
Natural disasters:
The number of natural disasters in Hennepin County (17) is near the US average (15).Major Disasters (Presidential) Declared: 12
Emergencies Declared: 4
Causes of natural disasters: Floods: 11, Storms: 8, Tornadoes: 4, Winds: 3, Drought: 1, Hurricane: 1, Landslide: 1, Mudslide: 1, Other: 2 (Note: some incidents may be assigned to more than one category).
Hospitals and medical centers near Orono:
- LONG LAKE HEALTHCARE CENTER (Nursing Home, about 2 miles away; LONG LAKE, MN)
- LONG LAKE NURSING HOME (Nursing Home, about 2 miles away; LONG LAKE, MN)
- LAKE MINNETONKA SHORES (Nursing Home, about 3 miles away; SPRING PARK, MN)
- TWIN BIRCH HLTH CARE CTR (Nursing Home, about 3 miles away; SPRING PARK, MN)
- LAKE MINNETONKA CARE CENTER (Nursing Home, about 4 miles away; DEEPHAVEN, MN)
- MINNETONKA HEALTH CARE CENTER (Nursing Home, about 4 miles away; EXCELSIOR, MN)
- HAVEN HOMES OF MAPLE PLAIN (Nursing Home, about 5 miles away; MAPLE PLAIN, MN)
located in Orono:
See details about located in Orono, MNColleges/universities with over 2000 students nearest to Orono:
- Hennepin Technical College (about 14 miles; Brooklyn Park, MN; Full-time enrollment: 4,515)
- North Hennepin Community College (about 15 miles; Brooklyn Park, MN; FT enrollment: 4,943)
- Minneapolis Community and Technical College (about 16 miles; Minneapolis, MN; FT enrollment: 6,726)
- Normandale Community College (about 16 miles; Bloomington, MN; FT enrollment: 7,048)
- Capella University (about 17 miles; Minneapolis, MN; FT enrollment: 21,718)
- Walden University (about 17 miles; Minneapolis, MN; FT enrollment: 62,473)
- Augsburg College (about 18 miles; Minneapolis, MN; FT enrollment: 2,954)
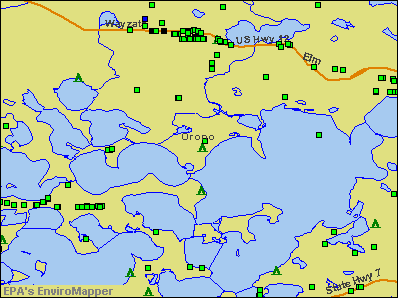
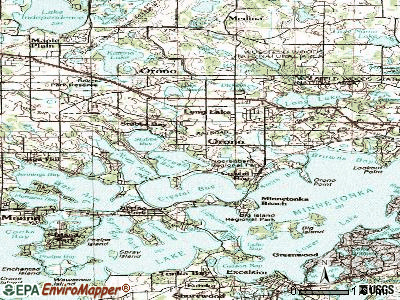
Points of interest:
Notable locations in Orono: Wayzata Country Club (A), Lakeview Golf Course (B), Orono Country Club (C), Lafayette Country Club (D), Long Lake Fire Department Station 2 (E), Long Lake Fire Department Station 1 (F), Orono Ice Arena (G), Orono City Hall (H), Minnetonka Beach City Hall (I), Long Lake City Hall (J). Display/hide their locations on the map
Shopping Center: Long Lake Town Center Shopping Center (1). Display/hide its location on the map
Churches in Orono include: Calvin Church (A), Trinity Church (B). Display/hide their locations on the map
Cemeteries: Long Lake Cemetery (1), Maxwell Family Cemetery (2). Display/hide their locations on the map
Lakes: Tanager Lake (A), Lydiard Lake (B), Long Lake (C), French Lake (D), Forest Lake (E), Dickeys Lake (F), Lake Classen (G). Display/hide their locations on the map
Creek: Long Lake Creek (A). Display/hide its location on the map
Parks in Orono include: Noerenberg Memorial County Park (1), Big Island Regional Park (2). Display/hide their locations on the map
| This city: | 2.6 people |
| Minnesota: | 2.5 people |
| This city: | 76.3% |
| Whole state: | 64.6% |
| This city: | 5.0% |
| Whole state: | 6.9% |
Likely homosexual households (counted as self-reported same-sex unmarried-partner households)
- Lesbian couples: 0.3% of all households
- Gay men: 0.4% of all households
6 people in homes for the mentally retarded in 2000
For population 15 years and over in Orono:
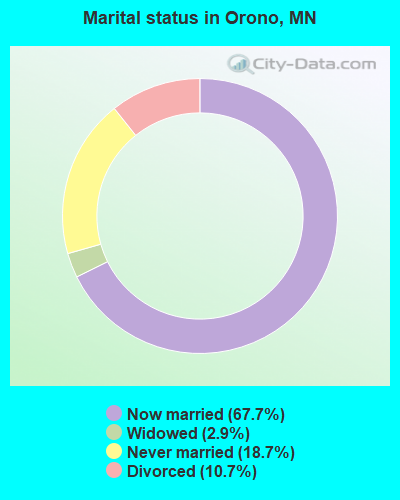
- Never married: 18.7%
- Now married: 67.7%
- Separated: 0.0%
- Widowed: 2.9%
- Divorced: 10.7%
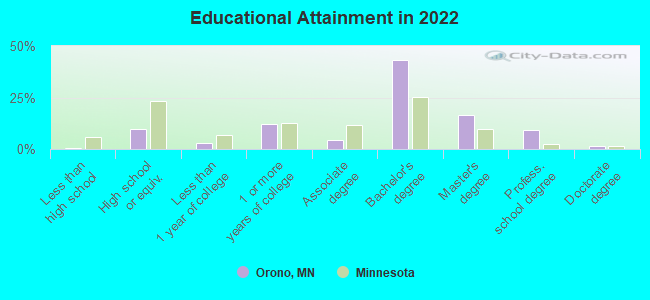
For population 25 years and over in Orono:
- High school or higher: 99.5%
- Bachelor's degree or higher: 69.3%
- Graduate or professional degree: 26.5%
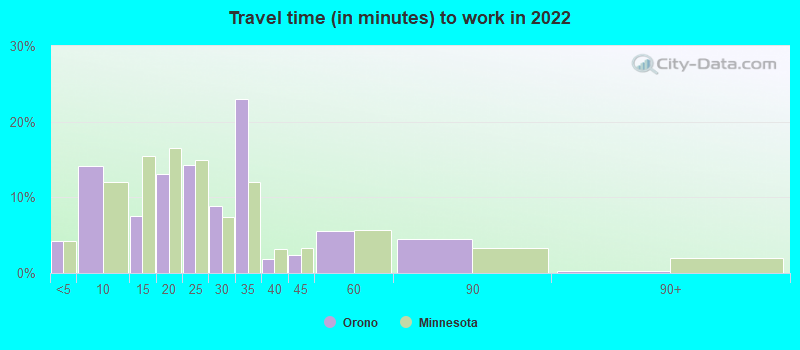
- Unemployed: 3.0%
- Mean travel time to work (commute): 15.1 minutes
| Here: | 7.7 |
| Minnesota average: | 10.9 |
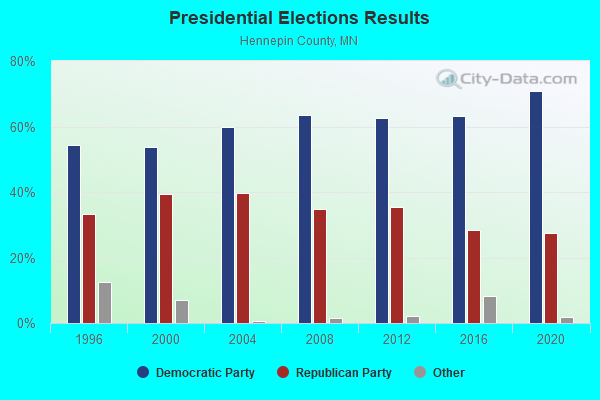
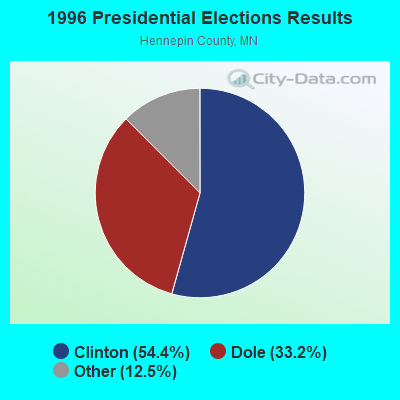
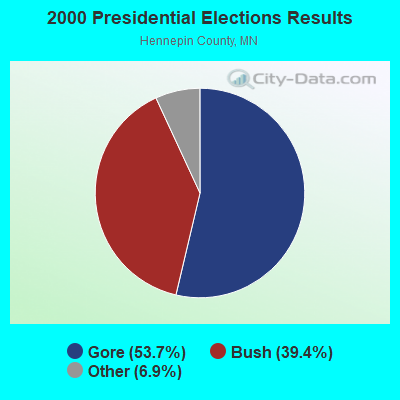
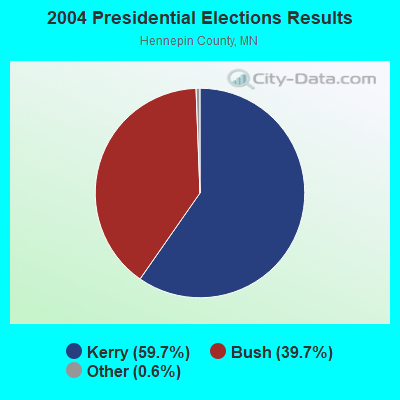
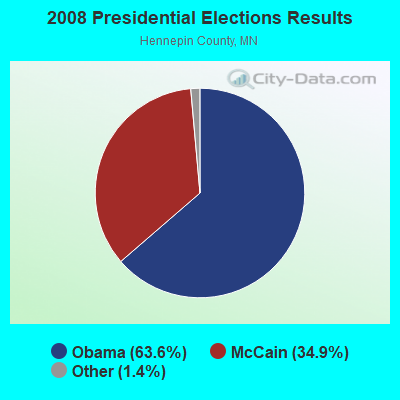
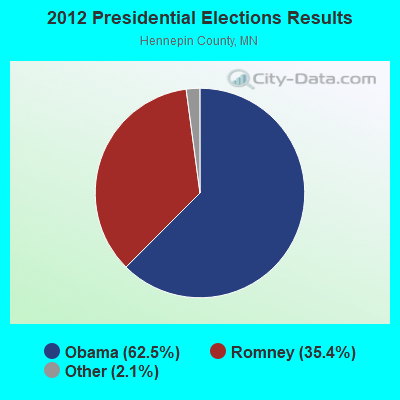
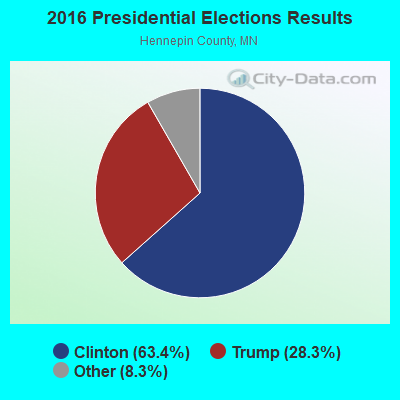
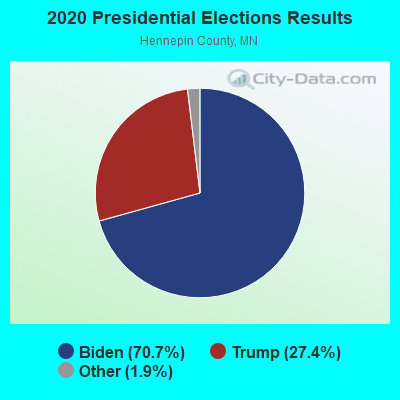
Graphs represent county-level data. Detailed 2008 Election Results
Religion statistics for Orono, MN (based on Hennepin County data)
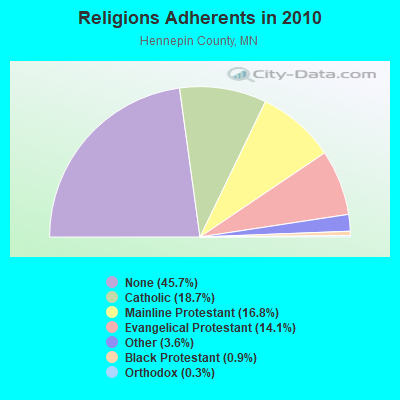
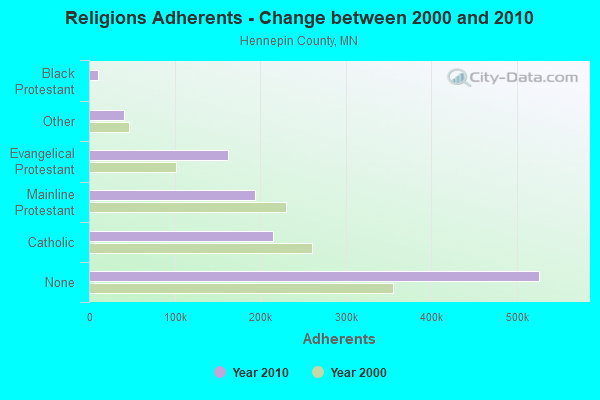
| Religion | Adherents | Congregations |
|---|---|---|
| Catholic | 215,205 | 74 |
| Mainline Protestant | 193,498 | 234 |
| Evangelical Protestant | 162,094 | 393 |
| Other | 41,287 | 110 |
| Black Protestant | 10,812 | 21 |
| Orthodox | 3,337 | 6 |
| None | 526,192 | - |
Food Environment Statistics:
| Hennepin County: | 1.79 / 10,000 pop. |
| Minnesota: | 1.83 / 10,000 pop. |
| Hennepin County: | 0.12 / 10,000 pop. |
| State: | 0.13 / 10,000 pop. |
| This county: | 0.69 / 10,000 pop. |
| Minnesota: | 0.49 / 10,000 pop. |
| This county: | 2.50 / 10,000 pop. |
| Minnesota: | 3.90 / 10,000 pop. |
| Hennepin County: | 7.13 / 10,000 pop. |
| Minnesota: | 6.98 / 10,000 pop. |
| This county: | 5.8% |
| Minnesota: | 6.5% |
| This county: | 22.8% |
| Minnesota: | 25.9% |
| Here: | 15.2% |
| Minnesota: | 13.0% |
Health and Nutrition:
| Orono: | 55.9% |
| Minnesota: | 50.6% |
| Orono: | 55.7% |
| State: | 48.4% |
| Here: | 28.1 |
| Minnesota: | 28.5 |
| Orono: | 23.1% |
| Minnesota: | 21.0% |
| Here: | 7.0% |
| State: | 9.8% |
| Here: | 7.0 |
| Minnesota: | 6.8 |
| Orono: | 35.7% |
| Minnesota: | 33.5% |
| Orono: | 62.3% |
| Minnesota: | 57.7% |
| Here: | 80.5% |
| Minnesota: | 79.3% |
More about Health and Nutrition of Orono, MN Residents
| Local government employment and payroll (March 2022) | |||||
| Function | Full-time employees | Monthly full-time payroll | Average yearly full-time wage | Part-time employees | Monthly part-time payroll |
|---|---|---|---|---|---|
| Police Protection - Officers | 27 | $238,992 | $106,219 | 2 | $3,560 |
| Financial Administration | 18 | $120,210 | $80,140 | 0 | $0 |
| Water Supply | 5 | $37,677 | $90,425 | 0 | $0 |
| Sewerage | 4 | $32,714 | $98,142 | 0 | $0 |
| Police - Other | 4 | $25,523 | $76,569 | 0 | $0 |
| Parks and Recreation | 2 | $5,842 | $35,052 | 2 | $1,008 |
| Totals for Government | 60 | $460,959 | $92,192 | 4 | $4,568 |
Orono government finances - Expenditure in 2018 (per resident):
- Construction - Regular Highways: $1,645,000 ($202.21)
Sewerage: $659,000 ($81.01)
Water Utilities: $279,000 ($34.30)
General - Other: $106,000 ($13.03)
Parks and Recreation: $57,000 ($7.01)
- Current Operations - Police Protection: $3,840,000 ($472.03)
Sewerage: $1,429,000 ($175.66)
Central Staff Services: $1,163,000 ($142.96)
Water Utilities: $647,000 ($79.53)
Regular Highways: $541,000 ($66.50)
General - Other: $378,000 ($46.47)
Financial Administration: $319,000 ($39.21)
Parks and Recreation: $306,000 ($37.62)
General Public Buildings: $296,000 ($36.39)
Solid Waste Management: $128,000 ($15.73)
Judicial and Legal Services: $127,000 ($15.61)
Housing and Community Development: $42,000 ($5.16)
Public Welfare - Other: $11,000 ($1.35)
- General - Interest on Debt: $438,000 ($53.84)
- Intergovernmental to Local - Other - Local Fire Protection: $401,000 ($49.29)
Other - Central Staff Services: $176,000 ($21.63)
- Other Capital Outlay - Police Protection: $359,000 ($44.13)
Regular Highways: $205,000 ($25.20)
Sewerage: $94,000 ($11.56)
General Public Building: $49,000 ($6.02)
Parks and Recreation: $39,000 ($4.79)
- Total Salaries and Wages: $4,139,000 ($508.79)
- Water Utilities - Interest on Debt: $55,000 ($6.76)
Orono government finances - Revenue in 2018 (per resident):
- Charges - Sewerage: $1,537,000 ($188.94)
Other: $1,098,000 ($134.97)
Parks and Recreation: $212,000 ($26.06)
Solid Waste Management: $149,000 ($18.32)
- Local Intergovernmental - Other: $2,375,000 ($291.95)
- Miscellaneous - Interest Earnings: $105,000 ($12.91)
Fines and Forfeits: $102,000 ($12.54)
Sale of Property: $39,000 ($4.79)
Donations From Private Sources: $6,000 ($0.74)
Rents: $5,000 ($0.61)
Special Assessments: $2,000 ($0.25)
- Revenue - Water Utilities: $758,000 ($93.18)
- State Intergovernmental - Highways: $686,000 ($84.33)
General Local Government Support: $230,000 ($28.27)
Other: $30,000 ($3.69)
- Tax - Property: $5,259,000 ($646.47)
Other License: $604,000 ($74.25)
Alcoholic Beverage License: $7,000 ($0.86)
Occupation and Business License - Other: $2,000 ($0.25)
Orono government finances - Debt in 2018 (per resident):
- Long Term Debt - Beginning Outstanding - Unspecified Public Purpose: $12,330,000 ($1515.67)
Outstanding Unspecified Public Purpose: $8,705,000 ($1070.07)
Retired Unspecified Public Purpose: $3,625,000 ($445.61)
Orono government finances - Cash and Securities in 2018 (per resident):
- Other Funds - Cash and Securities: $18,406,000 ($2262.57)
6.75% of this county's 2021 resident taxpayers lived in other counties in 2020 ($70,758 average adjusted gross income)
| Here: | 6.75% |
| Minnesota average: | 7.43% |
0.00% of residents moved from foreign countries ($39 average AGI)
Hennepin County: 0.00% Minnesota average: 0.00%
Top counties from which taxpayers relocated into this county between 2020 and 2021:
| from Ramsey County, MN | |
| from Anoka County, MN | |
| from Dakota County, MN |
8.44% of this county's 2020 resident taxpayers moved to other counties in 2021 ($85,733 average adjusted gross income)
| Here: | 8.44% |
| Minnesota average: | 7.79% |
0.01% of residents moved to foreign countries ($68 average AGI)
Hennepin County: 0.01% Minnesota average: 0.00%
Top counties to which taxpayers relocated from this county between 2020 and 2021:
| to Ramsey County, MN | |
| to Anoka County, MN | |
| to Dakota County, MN |
Businesses in Orono, MN
- Caribou Coffee: 1
- FedEx: 1
Strongest AM radio stations in Orono:
- WCCO (830 AM; 50 kW; MINNEAPOLIS, MN; Owner: INFINITY MEDIA CORPORATION)
- KFAN (1130 AM; 50 kW; MINNEAPOLIS, MN; Owner: AMFM RADIO LICENSES, L.L.C.)
- KSMM (1530 AM; 9 kW; SHAKOPEE, MN; Owner: STARBOARD BROADCASTING, INC.)
- KSTP (1500 AM; 50 kW; ST. PAUL, MN; Owner: KSTP-AM, LLC (DELAWARE))
- WCTS (1030 AM; 50 kW; MAPLEWOOD, MN; Owner: CNTL. BAPT. THEO/AL SEMI MINNEAPOLIS)
- KWOM (1600 AM; 5 kW; WATERTOWN, MN; Owner: WATERTOWN RADIO, INC.)
- KTIS (900 AM; 25 kW; MINNEAPOLIS, MN; Owner: NORTHWESTERN COLLEGE)
- WWTC (1280 AM; 5 kW; MINNEAPOLIS, MN; Owner: SCA LICENSE CORPORATION)
- KDIZ (1440 AM; 5 kW; GOLDEN VALLEY, MN; Owner: KQRS, INC.)
- WMNN (1330 AM; 10 kW; MINNEAPOLIS, MN; Owner: MINNESOTA PUBLIC RADIO.)
- KLBP (1470 AM; 5 kW; BROOKLYN PARK, MN; Owner: 1400, INC.)
- KYCR (1570 AM; 4 kW; GOLDEN VALLEY, MN; Owner: COMMON GROUND BROADCASTING COMPANY,)
- KUOM (770 AM; daytime; 5 kW; MINNEAPOLIS, MN)
Strongest FM radio stations in Orono:
- KTCZ-FM (97.1 FM; MINNEAPOLIS, MN; Owner: AMFM RADIO LICENSES, L.L.C.)
- KQQL (107.9 FM; ANOKA, MN; Owner: AMFM RADIO LICENSES, L.L.C.)
- KNOW-FM (91.1 FM; MINNEAPOLIS-ST. PAUL, MN; Owner: MINNESOTA PUBLIC RADIO)
- WLTE (102.9 FM; MINNEAPOLIS, MN; Owner: INFINITY MEDIA CORPORATION)
- KSTP-FM (94.5 FM; ST. PAUL, MN; Owner: KSTP-FM, LLC, A DELAWARE LLC)
- KEEY-FM (102.1 FM; ST. PAUL, MN; Owner: AMFM RADIO LICENSES, L.L.C.)
- KTIS-FM (98.5 FM; MINNEAPOLIS, MN; Owner: NORTHWESTERN COLLEGE)
- KDWB-FM (101.3 FM; RICHFIELD, MN; Owner: AMFM RADIO LICENSES, L.L.C.)
- KQRS-FM (92.5 FM; GOLDEN VALLEY, MN; Owner: KQRS, Inc.)
- KSJN (99.5 FM; MINNEAPOLIS, MN; Owner: MINNESOTA PUBLIC RADIO)
- KXXR (93.7 FM; MINNEAPOLIS, MN; Owner: KQRS, INC.)
- K214DF (90.7 FM; GOLDEN VALLEY, MN; Owner: EDUCATIONAL MEDIA FOUNDATION)
- WGVZ (105.7 FM; EDEN PRAIRIE, MN; Owner: KQRS, INC.)
- KTTB (96.3 FM; GLENCOE, MN; Owner: BLUE CHIP BROADCASTING LICENSES II, LTD.)
- KJZI (100.3 FM; MINNEAPOLIS, MN; Owner: AMFM RADIO LICENSES, L.L.C.)
- KFAI (90.3 FM; MINNEAPOLIS, MN; Owner: FRESH AIR, INC.)
- KBEM-FM (88.5 FM; MINNEAPOLIS, MN; Owner: BD. OF EDUCATION, S.S.D. NO. 1)
- WCAL (89.3 FM; NORTHFIELD, MN; Owner: ST. OLAF COLLEGE)
- WXPT (104.1 FM; ST. LOUIS PARK, MN; Owner: THE AUDIO HOUSE, INC.)
- WFMP (107.1 FM; COON RAPIDS, MN; Owner: WFMP-FM, LLC)
TV broadcast stations around Orono:
- KARE (Channel 11; MINNEAPOLIS, MN; Owner: MULTIMEDIA HOLDINGS CORPORATION)
- KSTP-TV (Channel 5; ST. PAUL, MN; Owner: HUBBARD BROADCASTING, INC.)
- KMSP-TV (Channel 9; MINNEAPOLIS, MN; Owner: FOX TELEVISION STATIONS, INC.)
- K07UI (Channel 7; MINNEAPOLIS, ETC., MN; Owner: WORD OF GOD FELLOWSHIP, INC.)
- KTCA-TV (Channel 2; ST. PAUL, MN; Owner: TWIN CITIES PUBLIC TELEVISION, INC.)
- K58BS (Channel 58; MINNEAPOLIS, MN; Owner: TRINITY BROADCASTING NETWORK)
- WCCO-TV (Channel 4; MINNEAPOLIS, MN; Owner: CBS BROADCASTING INC.)
- K67HG (Channel 67; MINNEAPOLIS, MN; Owner: VENTANA TELEVISION, INC.)
- K19ER (Channel 19; ST. PAUL, MN; Owner: CATHOLIC VIEWS BROADCASTS, INC.)
- K14KH (Channel 14; MINNEAPOLIS, MN; Owner: THREE ANGELS BROADCASTING NETWORK)
- W62BD (Channel 62; MINNEAPOLIS, MN; Owner: WORD OF GOD FELLOWSHIP, INC.)
- KSTC-TV (Channel 45; MINNEAPOLIS, MN; Owner: HUBBARD BROADCASTING, INC.)
- KTCI-TV (Channel 17; ST. PAUL, MN; Owner: TWIN CITIES PUBLIC TELEVISION, INC.)
- KMWB (Channel 23; MINNEAPOLIS, MN; Owner: KLGT LICENSEE, LLC)
- WFTC (Channel 29; MINNEAPOLIS, MN; Owner: FOX TELEVISION STATIONS, INC.)
- KPXM (Channel 41; ST. CLOUD, MN; Owner: PAXSON MINNEAPOLIS LICENSE, INC.)
- WBWX-CA (Channel 13; MINNEAPOLIS, MN; Owner: THE BOX WORLDWIDE LLC)
- National Bridge Inventory (NBI) Statistics
- 24Number of bridges
- 584ft / 178mTotal length
- $951,003,000Total costs
- 236,146Total average daily traffic
- 6,625Total average daily truck traffic
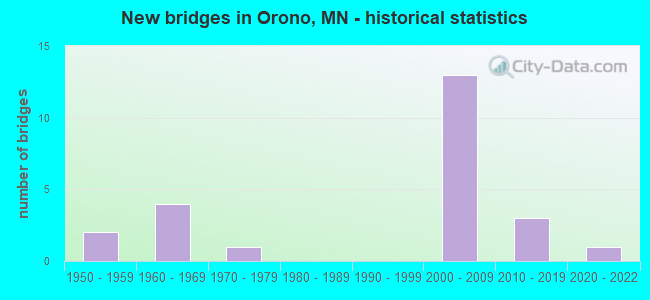
- New bridges - historical statistics
- 21950-1959
- 41960-1969
- 11970-1979
- 132000-2009
- 32010-2019
- 12020-2022
FCC Registered Broadcast Land Mobile Towers:
2- NAVARRE WTP EL TANK, 2345 Blaine Ave (Lat: 44.934806 Lon: -93.614250), Type: Tank, Structure height: 42.1 m, Overall height: 45 m, Call Sign: WPWZ950,
Assigned Frequencies: 453.337 MHz, Grant Date: 02/21/2023, Expiration Date: 02/19/2033, Certifier: Gregory A Gappa, Registrant: Mobile Radio Engineering, Inc., 745 Boone Ave North, Golden Valley, MN 55427, Phone: (763) 544-3319, Fax: (763) 544-2078, Email:
- LIFT STA. #27, 870 Partenwood Road (Lat: 44.962556 Lon: -93.615222), Type: Pole, Structure height: 6 m, Call Sign: WPXB675,
Assigned Frequencies: 453.337 MHz, Grant Date: 02/21/2023, Expiration Date: 02/27/2033, Certifier: Gregory A Gappa, Registrant: Mobile Radio Engineering, Inc., 745 Boone Avenue North, Golden Valley, MN 55427, Phone: (763) 544-3319, Fax: (763) 544-2078, Email:
FCC Registered Microwave Towers:
2- MS03XC197, 2750 Kelley Parkway (Lat: 44.992778 Lon: -93.592222), Type: Tank, Structure height: 51.8 m, Call Sign: WQRY387,
Assigned Frequencies: 17815.0 MHz, 17815.0 MHz, 17815.0 MHz, 17815.0 MHz, 17815.0 MHz, 17815.0 MHz, 17815.0 MHz, Grant Date: 08/14/2013, Expiration Date: 08/14/2023, Cancellation Date: 05/08/2023, Certifier: David Werblow, Registrant: T-Mobile Usa, Inc., 12920 Se 38th Street, Bellevue, WA 98006, Phone: (425) 383-8401, Email:
- NMCJT, 550 Old Crystal Bay Road N (Lat: 44.988611 Lon: -93.593417), Type: Building, Structure height: 9 m, Overall height: 10 m, Call Sign: WQZN596,
Assigned Frequencies: 19525.0 MHz, 19525.0 MHz, 19525.0 MHz, 19625.0 MHz, 19625.0 MHz, 19625.0 MHz, Grant Date: 06/19/2017, Expiration Date: 06/19/2027, Certifier: Greg G Arvig, Registrant: Nextera Wireless, 5909 Baker Road, Ste 590, Minnetonka, MN 55345, Phone: (952) 564-6924, Email:
FCC Registered Paging Towers:
1- Blaine & Lydiard Avenue (Lat: 44.936639 Lon: -93.615250), Type: Nntann, Structure height: 53.4 m, Call Sign: KSV993, Licensee ID: L00123266,
Assigned Frequencies: 158.700 MHz, Grant Date: 11/08/1999, Expiration Date: 11/08/2009, Cancellation Date: 07/08/2005, Certifier: Wayne Watts, Registrant: Ameritech St. Louis Paging Corporation
FCC Registered Amateur Radio Licenses:
12 (See the full list of FCC Registered Amateur Radio Licenses in Orono)FAA Registered Aircraft:
5- Aircraft: CESSNA 172I (Category: Land, Seats: 4, Weight: Up to 12,499 Pounds, Speed: 105 mph), Engine: LYCOMING 0-320 SERIES (180 HP) (Reciprocating)
N-Number: 35302, N35302, N-35302, Serial Number: 17256701, Airworthiness Date: 03/28/1968, Certificate Issue Date: 06/07/2019
Registrant (LLC): William Benjamin LLC, 2285 Abingdon Way, Orono, MN 55356
Deregistered: Cancel Date: 03/07/2017 - Aircraft: BEECH V35 (Category: Land, Seats: 6, Weight: Up to 12,499 Pounds, Speed: 150 mph), Engine: CONT MOTOR IO 520 SERIES (285 HP) (Reciprocating)
N-Number: 598T, N598T, N-598T, Serial Number: D-8388, Year manufactured: 1967, Airworthiness Date: 01/10/1967, Certificate Issue Date: 06/01/2020
Registrant (Individual): Shawn P Meakins, 4755 Bayside Rd, Orono, MN 55359 - Aircraft: CESSNA U206D (Category: Land, Seats: 6, Weight: Up to 12,499 Pounds, Speed: 132 mph), Engine: CONT MOTOR IO 520 SERIES (285 HP) (Reciprocating)
N-Number: 72337, N72337, N-72337, Serial Number: U206-1374, Year manufactured: 1969, Airworthiness Date: 08/15/1969, Certificate Issue Date: 11/03/2020
Registrant (LLC): 17400 Holdings LLC, 1700 Bohns Point Rd, Orono, MN 55391 - Aircraft: THRUSH AIRCRAFT LLC S2R-T34 (Category: Land, Seats: 2, Weight: Up to 12,499 Pounds), Engine: P&W CANADA PT6A-34AG (750 HP) (Turbo-prop)
N-Number: 92JA, N92JA, N-92JA, Serial Number: T34-505DC, Year manufactured: 2020, Airworthiness Date: 06/22/2020, Certificate Issue Date: 03/10/2020
Registrant (LLC): Boulder Capital & Leasing LLC, 2340 Glendale Cove Ln, Orono, MN 55356 - Aircraft: CESSNA 182P (Category: Land, Seats: 4, Weight: Up to 12,499 Pounds, Speed: 120 mph), Engine: CONT MOTOR O-470 SERIES (230 HP) (Reciprocating)
N-Number: 9953E, N9953E, N-9953E, Serial Number: 18264013, Year manufactured: 1975, Airworthiness Date: 06/27/1975, Certificate Issue Date: 03/13/2001
Registrant (Individual): Gregg S Sutton, 3825 North Shore Dr, Orono, MN 55364
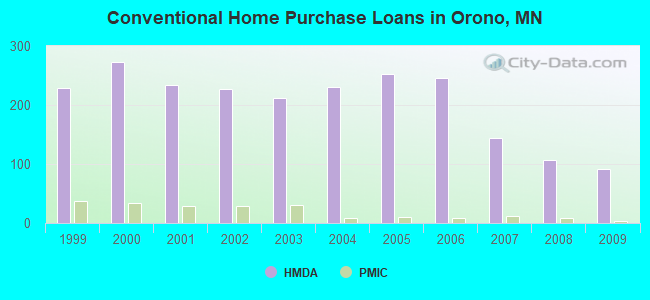
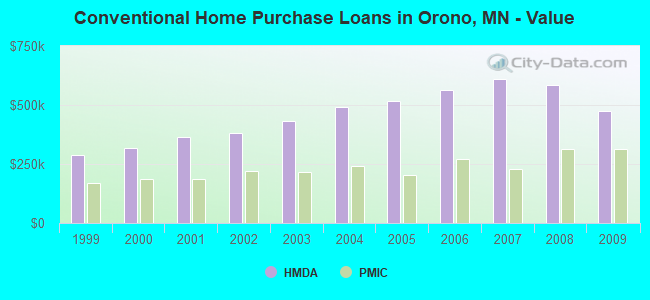
| Home Mortgage Disclosure Act Aggregated Statistics For Year 2009 (Based on 2 full and 1 partial tracts) | ||||||||||||||
| A) FHA, FSA/RHS & VA Home Purchase Loans | B) Conventional Home Purchase Loans | C) Refinancings | D) Home Improvement Loans | E) Loans on Dwellings For 5+ Families | F) Non-occupant Loans on < 5 Family Dwellings (A B C & D) | G) Loans On Manufactured Home Dwelling (A B C & D) | ||||||||
|---|---|---|---|---|---|---|---|---|---|---|---|---|---|---|
| Number | Average Value | Number | Average Value | Number | Average Value | Number | Average Value | Number | Average Value | Number | Average Value | Number | Average Value | |
| LOANS ORIGINATED | 33 | $205,706 | 91 | $476,613 | 397 | $359,745 | 16 | $218,865 | 1 | $4,020,570 | 34 | $317,258 | 1 | $5,420 |
| APPLICATIONS APPROVED, NOT ACCEPTED | 1 | $269,000 | 14 | $553,671 | 34 | $339,346 | 0 | $0 | 0 | $0 | 4 | $301,835 | 0 | $0 |
| APPLICATIONS DENIED | 2 | $161,790 | 18 | $1,016,348 | 124 | $431,862 | 13 | $189,152 | 0 | $0 | 13 | $310,136 | 0 | $0 |
| APPLICATIONS WITHDRAWN | 6 | $194,827 | 14 | $556,806 | 62 | $413,565 | 7 | $248,113 | 0 | $0 | 7 | $234,033 | 0 | $0 |
| FILES CLOSED FOR INCOMPLETENESS | 0 | $0 | 0 | $0 | 20 | $499,358 | 0 | $0 | 0 | $0 | 0 | $0 | 0 | $0 |
Detailed HMDA statistics for the following Tracts: 0272.01 , 0272.02, 0272.03
| Private Mortgage Insurance Companies Aggregated Statistics For Year 2009 (Based on 2 full and 1 partial tracts) | ||||||
| A) Conventional Home Purchase Loans | B) Refinancings | C) Non-occupant Loans on < 5 Family Dwellings (A & B) | ||||
|---|---|---|---|---|---|---|
| Number | Average Value | Number | Average Value | Number | Average Value | |
| LOANS ORIGINATED | 3 | $313,157 | 5 | $179,472 | 0 | $0 |
| APPLICATIONS APPROVED, NOT ACCEPTED | 3 | $365,270 | 0 | $0 | 1 | $126,490 |
| APPLICATIONS DENIED | 0 | $0 | 0 | $0 | 0 | $0 |
| APPLICATIONS WITHDRAWN | 0 | $0 | 0 | $0 | 0 | $0 |
| FILES CLOSED FOR INCOMPLETENESS | 0 | $0 | 0 | $0 | 0 | $0 |
Detailed PMIC statistics for the following Tracts: 0272.01 , 0272.02, 0272.03
2002 - 2018 National Fire Incident Reporting System (NFIRS) incidents
- Fire incident types reported to NFIRS in Orono, MN
- 16744.5%Structure Fires
- 12032.0%Outside Fires
- 6116.3%Mobile Property/Vehicle Fires
- 277.2%Other
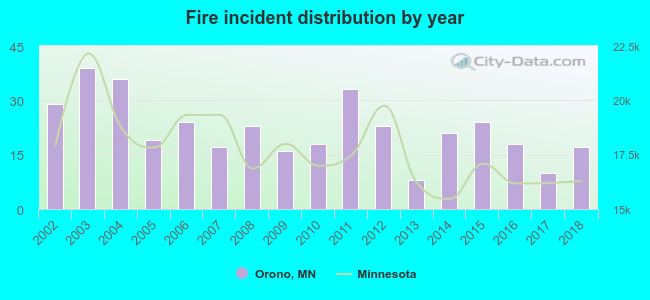 Based on the data from the years 2002 - 2018 the average number of fires per year is 22. The highest number of reported fire incidents - 39 took place in 2003, and the least - 8 in 2013. The data has a dropping trend.
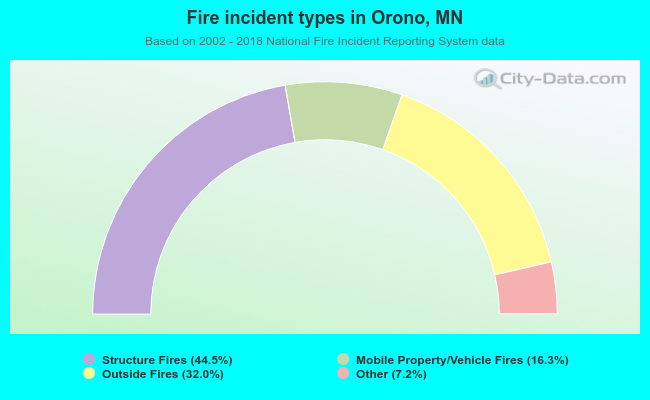 When looking into fire subcategories, the most reports belonged to: Structure Fires (44.5%), and Outside Fires (32.0%).
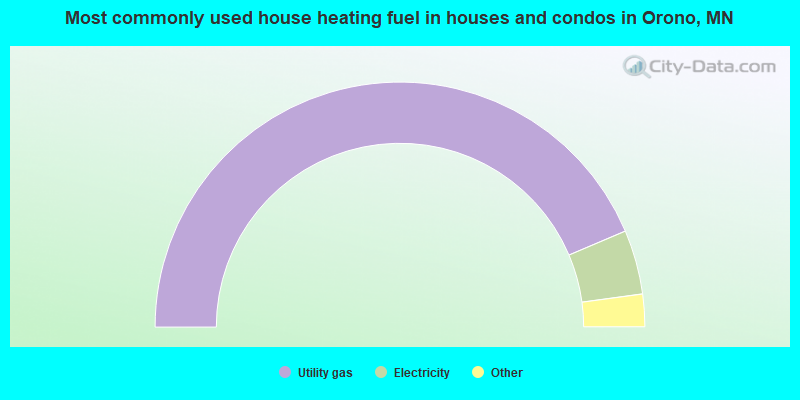
- 87.3%Utility gas
- 8.5%Electricity
- 3.0%Bottled, tank, or LP gas
- 0.9%No fuel used
- 0.3%Wood
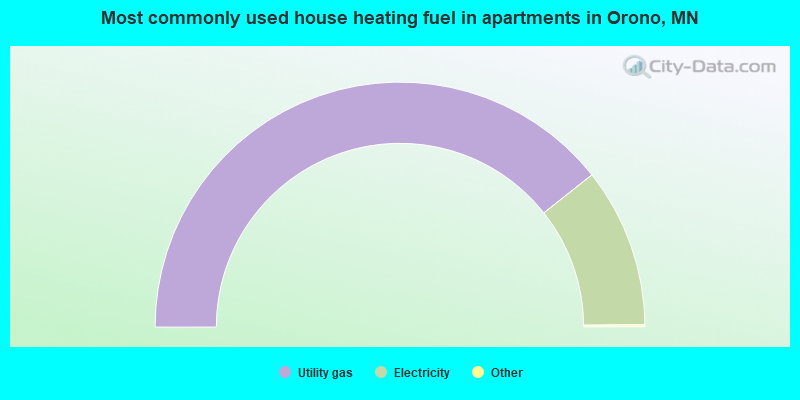
- 78.9%Utility gas
- 21.1%Electricity
Orono compared to Minnesota state average:
- Median household income above state average.
- Median house value significantly above state average.
- Unemployed percentage significantly below state average.
- Black race population percentage significantly below state average.
- Hispanic race population percentage significantly below state average.
- Renting percentage significantly below state average.
- Length of stay since moving in above state average.
- Number of rooms per house significantly above state average.
- Percentage of population with a bachelor's degree or higher significantly above state average.
Orono on our top lists:
- #21 on the list of "Top 101 cities with largest percentage of females in occupations: arts, design, entertainment, sports, and media occupations (population 5,000+)"
- #49 on the list of "Top 101 cities with the largest percentage of one, detached housing units in structures (2,000+ housing units)"
- #61 on the list of "Top 101 cities with the lowest percentage of single-parent households, population 5,000+"
- #81 on the list of "Top 101 cities with largest percentage of females in occupations: business and financial operations occupations (population 5,000+)"
- #90 on the list of "Top 101 cities with largest percentage of males in occupations: sales and related occupations (population 5,000+)"
- #4 on the list of "Top 101 counties with the most Mainline Protestant adherents"
- #7 on the list of "Top 101 counties with the highest percentage of residents that exercised in the past month"
- #10 on the list of "Top 101 counties with the most Mainline Protestant congregations"
- #15 on the list of "Top 101 counties with the highest percentage of residents that visited a dentist within the past year"
- #28 on the list of "Top 101 counties with the best general health status score of residents (1-5), 3 years of data"

|
|
Total of 206 patent applications in 2008-2024.