Orono: Fire Incidents, Minnesota (MN)
Where are fire incidents reported in Orono, MN
Something went wrong! Please refresh the page.
|
| |||||||||||||||||||||||||||||||||||||||||||||||||||||||||||||||||||||||||||||||||||||||||||||||||||||||||||||
2002 - 2018 National Fire Incident Reporting System (NFIRS) incidents
- Incident types reported to NFIRS in Orono, MN
- 73928.5%Hazardous Condition
- 49419.1%False Alarm
- 49319.0%Rescue & EMS
- 38614.9%Good Intent Call
- 37514.5%Fire
- 963.7%Service Call
- 30.1%Severe Weather
- Fire incident types reported to NFIRS in Orono, MN
- 16744.5%Structure Fires
- 12032.0%Outside Fires
- 6116.3%Mobile Property/Vehicle Fires
- 277.2%Other
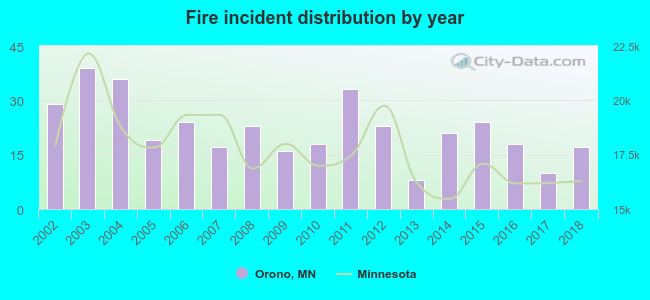 According to the data from the years 2002 - 2018 the average number of fire incidents per year is 22. The highest number of fires - 39 took place in 2003, and the least - 8 in 2013. The data has a dropping trend.
The average number of yearly fire incidents per 10k residents in Orono, MN compared to nearest cities:
(Note: Based on data for the last 3 years, including only cities with population 5,000 and above)
| Orono: | 19.0 |
| Mound: | 25.8 |
| Shorewood: | 10.6 |
| Medina: | 22.3 |
| Minnetrista: | 20.3 |
| Minnetonka: | 14.6 |
| Chanhassen: | 11.3 |
| Victoria: | 14.3 |
| Plymouth: | 26.9 |

 29.9% incidents where reported in the morning and 70.1% in the evening. The most fires (19.2%) took place on Monday, and the least (9.6%) on Wednesday.
 According to the 375 fire incident reports from years 2002 - 2018 most fires (12.3%) took place during May, and the least (4.3%) in February.
 Out of all 2,590 cases reported during the years 2002 - 2018, the most belonged to the categories: Hazardous Condition (28.5%), False Alarm (19.1%), and Rescue & EMS (19.0%).
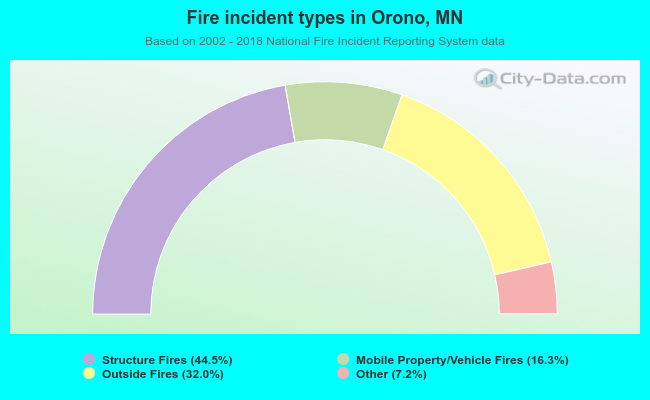 When looking into fire subcategories, the most incidents belonged to: Structure Fires (44.5%), and Outside Fires (32.0%).