Chanhassen: Fire Incidents, Minnesota (MN)
Where are fire incidents reported in Chanhassen, MN
Something went wrong! Please refresh the page.
|
| |||||||||||||||||||||||||||||||||||||||||||||||||||||||||||||||||||||||||||||||||||||||||||||||||||||||||||||
| Other | 24 | |||||||||||||||||||||||||||||||||||||||||||||||||||||||||||||||||||||||||||||||||||||||||||||||||||||||||||||
2002 - 2018 National Fire Incident Reporting System (NFIRS) incidents
- Incident types reported to NFIRS in Chanhassen, MN
- 1,79139.8%Rescue & EMS
- 76116.9%Hazardous Condition
- 70415.6%Good Intent Call
- 55412.3%False Alarm
- 49210.9%Fire
- 1773.9%Service Call
- 140.3%Severe Weather
- 60.1%Special Incident
- Fire incident types reported to NFIRS in Chanhassen, MN
- 25251.2%Structure Fires
- 13427.2%Outside Fires
- 7415.0%Mobile Property/Vehicle Fires
- 326.5%Other
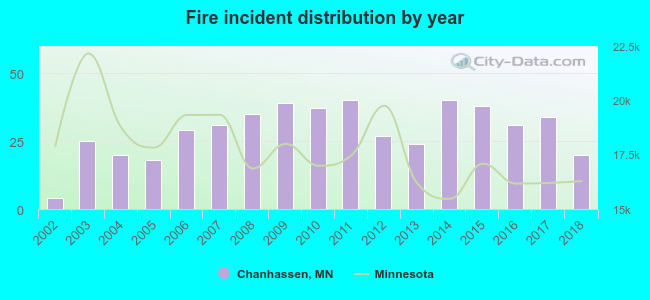 Based on the data from the years 2002 - 2018 the average number of fires per year is 29. The highest number of fire incidents - 40 took place in 2011, and the least - 4 in 2002. The data has a growing trend.
The average number of yearly fire incidents per 10k residents in Chanhassen, MN compared to nearest cities:
(Note: Based on data for the last 3 years, including only cities with population 5,000 and above)
| Chanhassen: | 11.3 |
| Shorewood: | 10.6 |
| Chaska: | 13.6 |
| Eden Prairie: | 15.2 |
| Victoria: | 14.3 |
| Shakopee: | 24.1 |
| Minnetonka: | 14.6 |
| Mound: | 25.8 |
| Orono: | 19.0 |
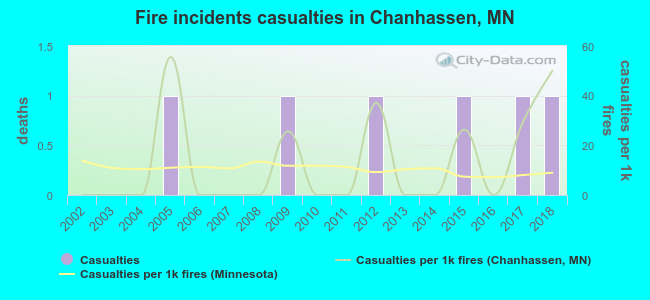 Based on the data from the years 2002 - 2018 the average number of fire-related casualties per year is 0. The highest number of reported casualties - 1 took place in 2005, and the lowest - 0 in 2002. The data has a rising trend.
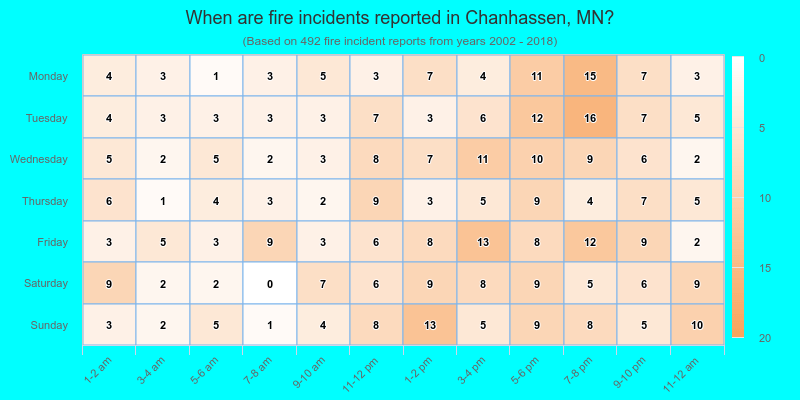
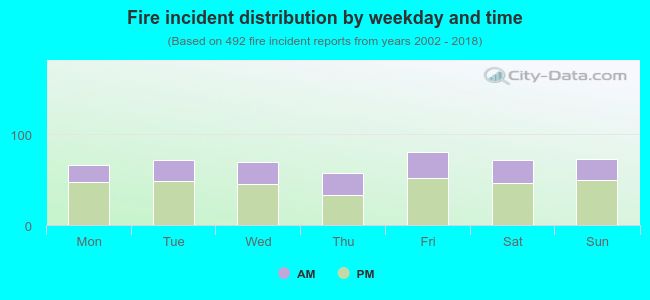 34.6% incidents where reported in the morning and 65.4% in the evening. The most fires (16.5%) took place on Friday, and the least (11.8%) on Thursday.
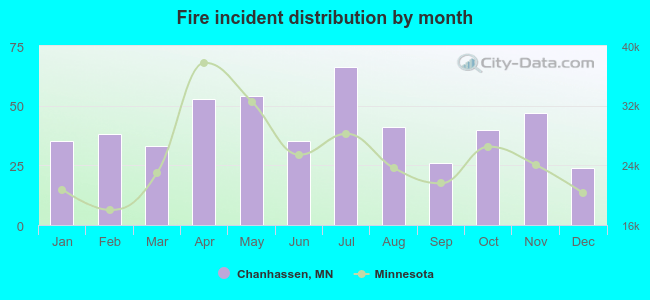 Based on the 492 incident reports from years 2002 - 2018 most fires (13.4%) took place during July, and the least (4.9%) in December.
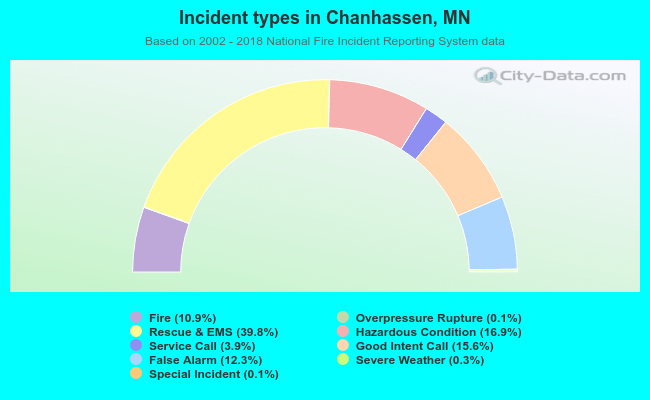 Out of all 4,503 cases reported during the years 2002 - 2018, the most belonged to the categories: Rescue & EMS (39.8%), Hazardous Condition (16.9%), and Good Intent Call (15.6%).
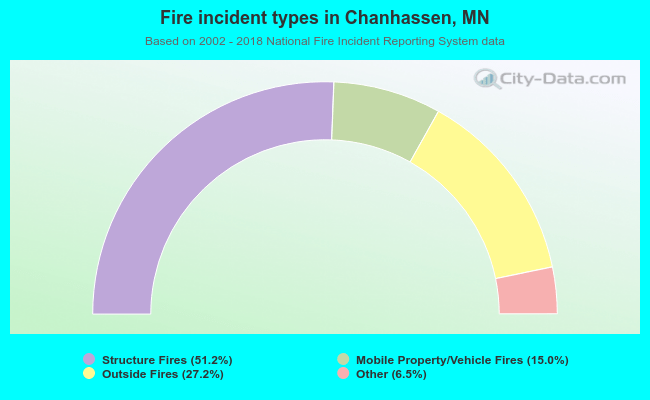 When looking into fire subcategories, the most reports belonged to: Structure Fires (51.2%), and Outside Fires (27.2%).