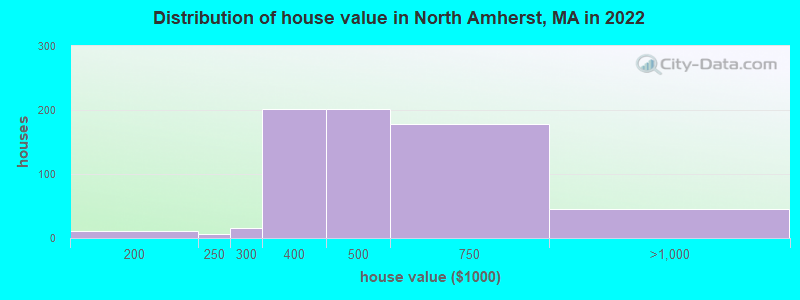
Estimated median house or condo value in 2022: $497,165 (it was $191,300 in 2000)
North Amherst:
$497,165
MA:
$534,700
Mean prices in 2022:all housing units: $406,762; detached houses: $418,541; townhouses or other attached units: $363,334; in 2-unit structures: $269,911; in 3-to-4-unit structures: $561,325; in 5-or-more-unit structures: $236,751; mobile homes: $362,036
Median gross rent in 2022: $1,655.
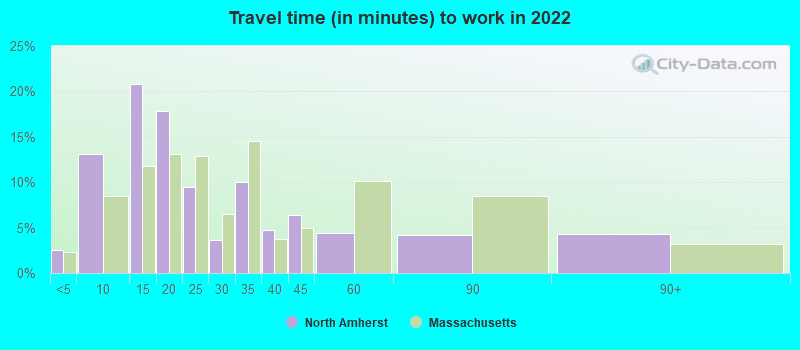
March 2022 cost of living index in North Amherst: 112.6 (more than average, U.S. average is 100)
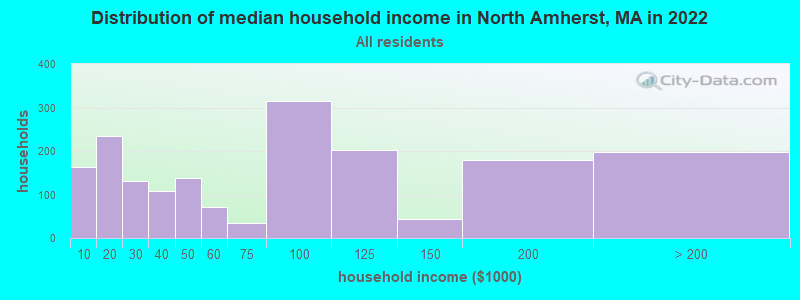
Percentage of residents living in poverty in 2022: 37.2%
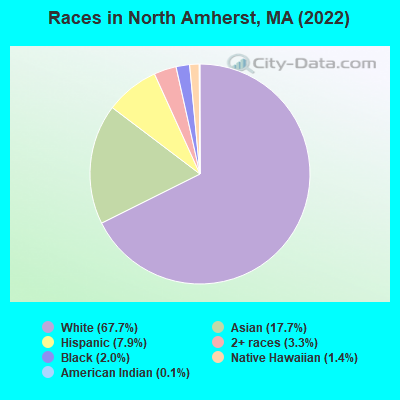
(45.0% for White Non-Hispanic residents, 10.9% for Black residents, 30.3% for Hispanic or Latino residents, 100.0% for American Indian residents, 39.4% for two or more races residents)
Latest news from North Amherst, MA collected exclusively by city-data.com from local newspapers, TV, and radio stations
Ancestries: Irish (8.2%), German (7.8%), Eastern European (7.5%), American (6.8%), Italian (5.3%), English (2.5%).
Current Local Time: EST time zone
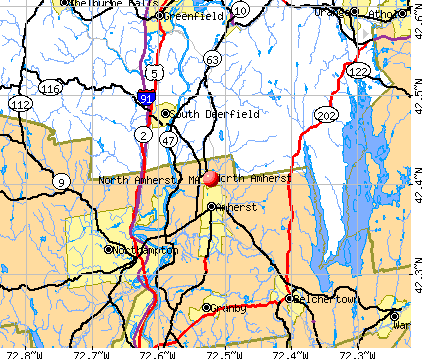
Elevation: 187 feet
Land area: 2.11 square miles.
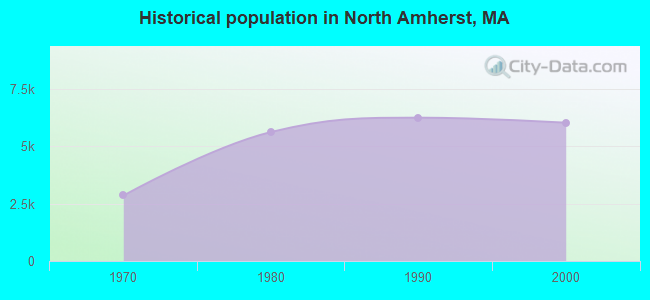
Population density: 3,236 people per square mile (average).
1,411 residents are foreign born (12.9% Asia, 3.9% Europe).
This place:
20.1%
Massachusetts:
100.0%
Median real estate property taxes paid for housing units with mortgages in 2022: $8,646 (1.6%) Median real estate property taxes paid for housing units with no mortgage in 2022: $8,405 (1.7%)
Nearest city with pop. 50,000+: Chicopee, MA (16.7 miles , pop. 54,653).
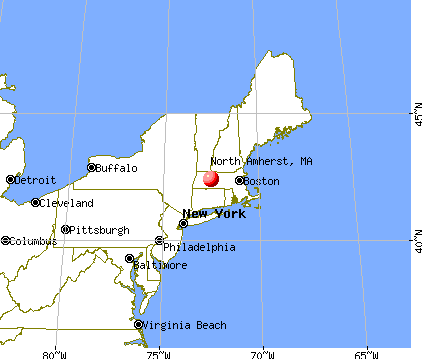
Nearest city with pop. 200,000+: Boston, MA (73.4 miles , pop. 589,141).
Nearest city with pop. 1,000,000+: Bronx, NY (128.5 miles , pop. 1,332,650).
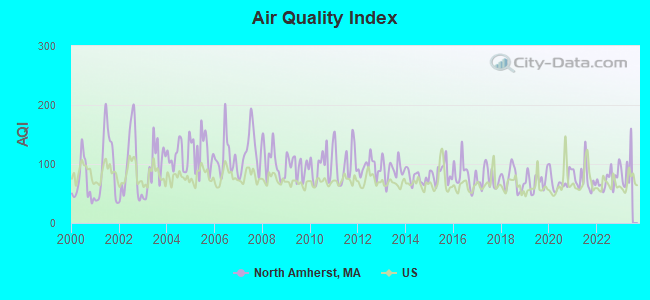
Air Quality Index (AQI) level in 2022 was 74.4. This is about average.
City:
74.4
U.S.:
72.6
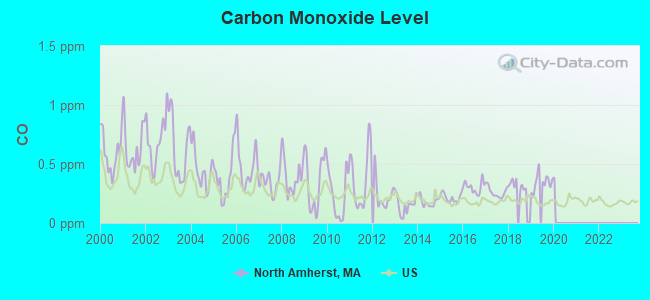
Carbon Monoxide (CO) [ppm] level in 2019 was 0.346. This is worse than average.Closest monitor was 15.6 miles away from the city center.
City:
0.346
U.S.:
0.251
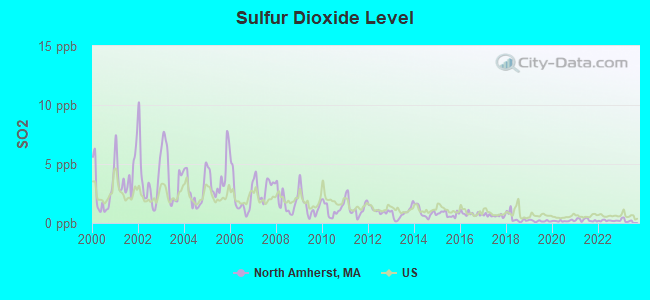
Sulfur Dioxide (SO2) [ppb] level in 2022 was 0.197. This is significantly better than average.Closest monitor was 5.8 miles away from the city center.
City:
0.197
U.S.:
1.515
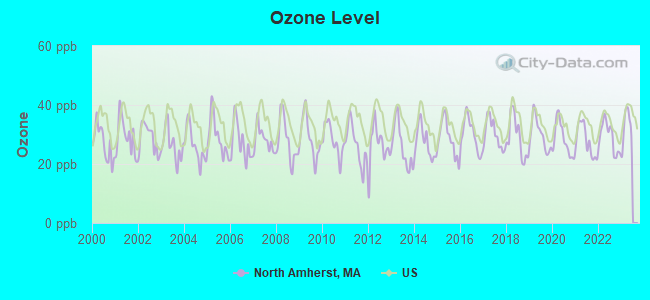
Ozone [ppb] level in 2022 was 29.1. This is about average.Closest monitor was 0.4 miles away from the city center.
City:
29.1
U.S.:
33.3
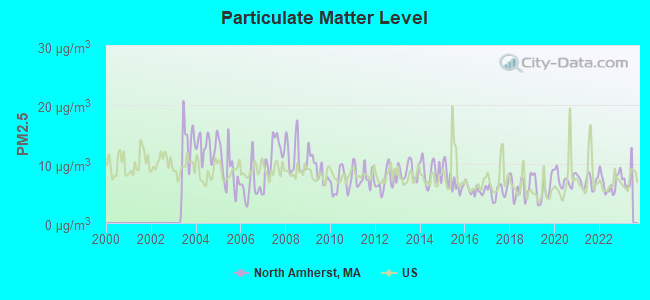
Particulate Matter (PM2.5) [µg/m3] level in 2022 was 6.84. This is about average.Closest monitor was 12.1 miles away from the city center.
City:
6.84
U.S.:
8.11
Tornado activity:
North Amherst-area historical tornado activity is above Massachusetts state average. It is 9% smaller than the overall U.S. average.
On 6/9/1953, a category F4 (max. wind speeds 207-260 mph) tornado 18.5 miles away from the North Amherst place center killed 90 peopleand injured 1228 peopleand causedbetween $50,000,000 and $500,000,000 in damages.
On 10/3/1979, a category F4 tornado 26.3 miles away from the place center killed 3 peopleand injured 500 peopleand causedbetween $50,000,000 and $500,000,000 in damages.
Earthquake activity:
North Amherst-area historical earthquake activity is significantly above Massachusetts state average. It is 70% smaller than the overall U.S. average.
On 10/7/1983 at 10:18:46, a magnitude 5.3 (5.1 MB, 5.3 LG, 5.1 ML, Class: Moderate, Intensity: VI - VII) earthquake occurred 141.0 miles away from North Amherst center On 4/20/2002 at 10:50:47, a magnitude 5.3 (5.3 ML, Depth: 3.0 mi) earthquake occurred 157.2 miles away from the city center On 4/20/2002 at 10:50:47, a magnitude 5.2 (5.2 MB, 4.2 MS, 5.2 MW, 5.0 MW) earthquake occurred 156.0 miles away from North Amherst center On 1/19/1982 at 00:14:42, a magnitude 4.7 (4.5 MB, 4.7 MD, 4.5 LG, Class: Light, Intensity: IV - V) earthquake occurred 88.9 miles away from the city center On 10/16/2012 at 23:12:25, a magnitude 4.7 (4.7 ML, Depth: 10.0 mi) earthquake occurred 125.3 miles away from North Amherst center On 10/2/1994 at 11:27:22, a magnitude 3.7 (3.5 LG, 3.7 LG, Depth: 6.2 mi, Class: Light, Intensity: II - III) earthquake occurred 13.1 miles away from North Amherst center Magnitude types: regional Lg-wave magnitude (LG), body-wave magnitude (MB), duration magnitude (MD), local magnitude (ML), surface-wave magnitude (MS), moment magnitude (MW)
Natural disasters:
The number of natural disasters in Hampshire County (21) is greater than the US average (15). Major Disasters (Presidential) Declared: 10 Emergencies Declared: 10
Causes of natural disasters: Floods: 5, Snowstorms: 5, Storms: 5, Hurricanes: 4, Winter Storms: 4, Blizzards: 2, Snows: 2, Snowfall: 1, Tropical Storm: 1, Wind: 1, Other: 1 (Note: some incidents may be assigned to more than one category).
Hospitals and medical centers near North Amherst:
HOSPICE OF THE FISHER HOME (Hospital, about 1 miles away; AMHERST, MA)
CENTER FOR EXTENDED CARE AT AMHERST (Nursing Home, about 3 miles away; AMHERST, MA)
HADLEY AT ELAINE CARE AND REHABILITATION CENTER (Nursing Home, about 4 miles away; HADLEY, MA)
COZY CORNER NURSING AND REHABILITATION CENTER (Nursing Home, about 5 miles away; SUNDERLAND, MA)
VNA AND HOSPICE OF COOLEY DICKINSON (Home Health Center, about 8 miles away; NORTHAMPTON, MA)
SERVICENET HOMECARE (Home Health Center, about 8 miles away; NORTHAMPTON, MA)
VNA OF HAMPSHIRE COUNTY, INC (Home Health Center, about 8 miles away; NORTHAMPTON, MA)
Amtrak station near North Amherst:
3 miles: AMHERST (RAILROAD ST.) . Services: enclosed waiting area, public payphones, free short-term parking, paid long-term parking, call for car rental service, call for taxi service, public transit connection.
Colleges/universities with over 2000 students nearest to North Amherst:
University of Massachusetts-Amherst (about 2 miles; Amherst, MA; Full-time enrollment: 26,583)
Smith College (about 9 miles; Northampton, MA; FT enrollment: 3,549)
Mount Holyoke College (about 11 miles; South Hadley, MA; FT enrollment: 2,573)
Holyoke Community College (about 17 miles; Holyoke, MA; FT enrollment: 4,911)
Western New England University (about 21 miles; Springfield, MA; FT enrollment: 3,477)
American International College (about 21 miles; Springfield, MA; FT enrollment: 2,733)
Springfield Technical Community College (about 21 miles; Springfield, MA; FT enrollment: 4,750)
Notable locations in North Amherst: McNamara Hall (A), North Amherst Library (B), Totman Hall (C), Amherst Fire Department Station 2 (D), Marks Meadow Elementary School Library Media Center (E), Brown Hall (F), Cashin Hall (G), Furcolo Hall (H). Display/hide their locations on the map
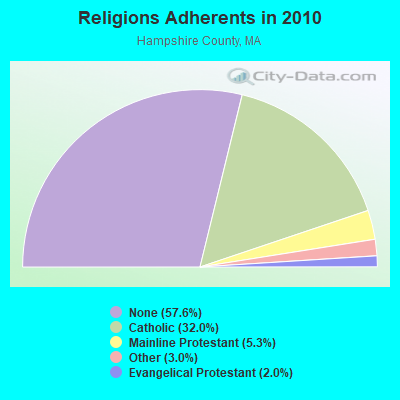
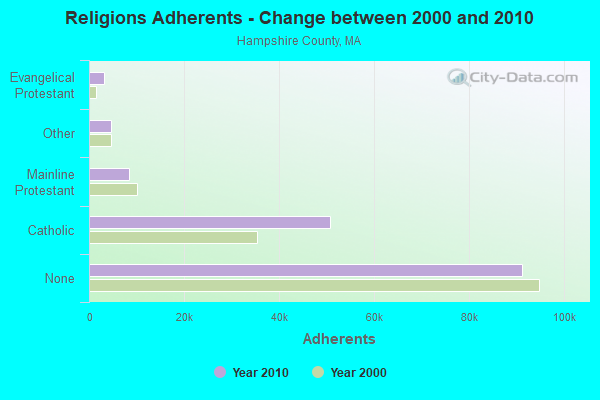
Religion statistics for North Amherst, MA (based on Hampshire County data)
Religion
Adherents
Congregations
Catholic
50,643
22
Mainline Protestant
8,454
45
Other
4,722
27
Evangelical Protestant
3,128
22
Black Protestant
29
1
None
91,104
-
Source: Clifford Grammich, Kirk Hadaway, Richard Houseal, Dale E.Jones, Alexei Krindatch, Richie Stanley and Richard H.Taylor. 2012. 2010 U.S.Religion Census: Religious Congregations & Membership Study. Association of Statisticians of American Religious Bodies. Jones, Dale E., et al. 2002. Congregations and Membership in the United States 2000. Nashville, TN: Glenmary Research Center. Graphs represent county-level data
Lat: 42.420639 Lon: -72.526194, Call Sign: WQTT638, Assigned Frequencies: 452.687 MHz, 457.087 MHz, 457.687 MHz, Grant Date: 03/27/2024, Expiration Date: 04/09/2034, Certifier: John Coelho, Registrant: Cherry Hill Golf Course, 170 Chestnut St., Suite 1, Amherst, MA 01002, Phone: (413) 259-0313, Email:
FCC Registered Amateur Radio Licenses:
1
Call Sign: KB1WAM, Licensee ID: L01659164, Grant Date: 07/24/2021, Expiration Date: 09/01/2031, Certifier: Michael F Kotarba, Registrant: Michael F Kotarba, North Amherst, MA 01059
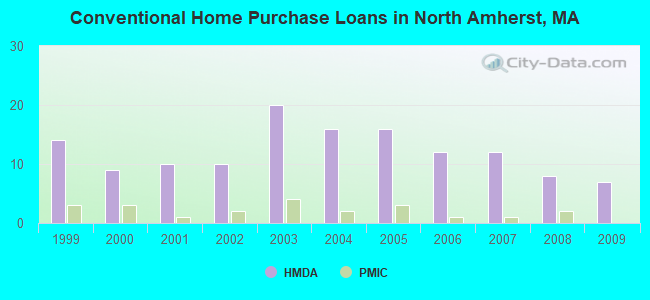
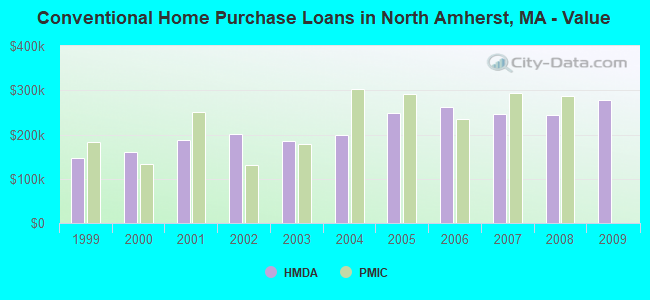
Home Mortgage Disclosure Act Aggregated Statistics For Year 2009 (Based on 2 partial tracts)
B) Conventional Home Purchase Loans
C) Refinancings
D) Home Improvement Loans
F) Non-occupant Loans on < 5 Family Dwellings (A B C & D)
Number
Average Value
Number
Average Value
Number
Average Value
Number
Average Value
LOANS ORIGINATED
7
$279,016
30
$224,597
3
$104,840
4
$184,882
APPLICATIONS APPROVED, NOT ACCEPTED
1
$83,230
1
$197,890
0
$0
0
$0
APPLICATIONS DENIED
1
$184,580
4
$219,615
0
$0
1
$209,780
APPLICATIONS WITHDRAWN
0
$0
1
$321,880
0
$0
0
$0
FILES CLOSED FOR INCOMPLETENESS
1
$166,460
1
$323,940
0
$0
1
$119,190
Aggregated Statistics For Year 2008 (Based on 2 partial tracts)
A) FHA, FSA/RHS & VA Home Purchase Loans
B) Conventional Home Purchase Loans
C) Refinancings
D) Home Improvement Loans
F) Non-occupant Loans on < 5 Family Dwellings (A B C & D)
Number
Average Value
Number
Average Value
Number
Average Value
Number
Average Value
Number
Average Value
LOANS ORIGINATED
1
$201,570
8
$243,572
10
$199,561
3
$141,740
1
$248,000
APPLICATIONS APPROVED, NOT ACCEPTED
0
$0
0
$0
0
$0
0
$0
0
$0
APPLICATIONS DENIED
0
$0
1
$421,250
1
$261,300
0
$0
0
$0
APPLICATIONS WITHDRAWN
0
$0
3
$245,543
1
$163,350
0
$0
0
$0
FILES CLOSED FOR INCOMPLETENESS
0
$0
0
$0
0
$0
0
$0
0
$0
Aggregated Statistics For Year 2007 (Based on 2 partial tracts)
B) Conventional Home Purchase Loans
C) Refinancings
D) Home Improvement Loans
F) Non-occupant Loans on < 5 Family Dwellings (A B C & D)
Number
Average Value
Number
Average Value
Number
Average Value
Number
Average Value
LOANS ORIGINATED
12
$246,602
8
$199,841
5
$54,186
3
$186,633
APPLICATIONS APPROVED, NOT ACCEPTED
0
$0
0
$0
0
$0
0
$0
APPLICATIONS DENIED
2
$210,200
3
$162,077
1
$225,060
1
$119,080
APPLICATIONS WITHDRAWN
1
$158,540
2
$169,435
0
$0
0
$0
FILES CLOSED FOR INCOMPLETENESS
0
$0
1
$137,590
1
$36,800
0
$0
Aggregated Statistics For Year 2006 (Based on 2 partial tracts)
B) Conventional Home Purchase Loans
C) Refinancings
D) Home Improvement Loans
F) Non-occupant Loans on < 5 Family Dwellings (A B C & D)
Number
Average Value
Number
Average Value
Number
Average Value
Number
Average Value
LOANS ORIGINATED
12
$262,041
14
$202,679
7
$106,324
4
$184,020
APPLICATIONS APPROVED, NOT ACCEPTED
1
$229,590
2
$200,670
0
$0
1
$85,010
APPLICATIONS DENIED
2
$143,955
8
$282,144
1
$164,200
2
$290,460
APPLICATIONS WITHDRAWN
2
$183,465
5
$208,418
1
$125,980
0
$0
FILES CLOSED FOR INCOMPLETENESS
1
$206,380
1
$249,670
0
$0
0
$0
Aggregated Statistics For Year 2005 (Based on 2 partial tracts)
B) Conventional Home Purchase Loans
C) Refinancings
D) Home Improvement Loans
F) Non-occupant Loans on < 5 Family Dwellings (A B C & D)
Number
Average Value
Number
Average Value
Number
Average Value
Number
Average Value
LOANS ORIGINATED
16
$248,836
16
$235,651
7
$100,056
7
$279,349
APPLICATIONS APPROVED, NOT ACCEPTED
3
$230,727
2
$114,515
0
$0
0
$0
APPLICATIONS DENIED
2
$245,870
5
$258,696
1
$2,830
1
$239,220
APPLICATIONS WITHDRAWN
2
$284,130
6
$221,258
1
$124,790
1
$441,330
FILES CLOSED FOR INCOMPLETENESS
1
$144,100
1
$178,920
1
$84,650
0
$0
Aggregated Statistics For Year 2004 (Based on 2 partial tracts)
B) Conventional Home Purchase Loans
C) Refinancings
D) Home Improvement Loans
F) Non-occupant Loans on < 5 Family Dwellings (A B C & D)
Number
Average Value
Number
Average Value
Number
Average Value
Number
Average Value
LOANS ORIGINATED
16
$199,818
23
$188,919
5
$116,074
4
$211,072
APPLICATIONS APPROVED, NOT ACCEPTED
2
$192,735
3
$109,370
0
$0
1
$160,520
APPLICATIONS DENIED
3
$133,717
3
$133,247
1
$8,780
3
$107,577
APPLICATIONS WITHDRAWN
1
$65,400
5
$158,724
0
$0
0
$0
FILES CLOSED FOR INCOMPLETENESS
0
$0
2
$213,315
0
$0
0
$0
Aggregated Statistics For Year 2003 (Based on 2 partial tracts)
B) Conventional Home Purchase Loans
C) Refinancings
D) Home Improvement Loans
F) Non-occupant Loans on < 5 Family Dwellings (A B C & D)
Number
Average Value
Number
Average Value
Number
Average Value
Number
Average Value
LOANS ORIGINATED
20
$185,911
66
$148,179
1
$74,170
9
$127,899
APPLICATIONS APPROVED, NOT ACCEPTED
1
$241,480
4
$152,095
1
$13,870
1
$125,980
APPLICATIONS DENIED
3
$114,657
7
$161,883
1
$7,080
2
$120,315
APPLICATIONS WITHDRAWN
3
$141,267
4
$186,632
0
$0
1
$44,450
FILES CLOSED FOR INCOMPLETENESS
0
$0
0
$0
0
$0
0
$0
Aggregated Statistics For Year 2002 (Based on 2 partial tracts)
B) Conventional Home Purchase Loans
C) Refinancings
D) Home Improvement Loans
F) Non-occupant Loans on < 5 Family Dwellings (A B C & D)
Number
Average Value
Number
Average Value
Number
Average Value
Number
Average Value
LOANS ORIGINATED
10
$200,020
36
$142,963
2
$78,560
5
$128,924
APPLICATIONS APPROVED, NOT ACCEPTED
1
$266,960
2
$121,735
0
$0
1
$47,280
APPLICATIONS DENIED
1
$118,050
7
$173,693
0
$0
1
$36,800
APPLICATIONS WITHDRAWN
1
$297,370
5
$122,756
0
$0
1
$128,530
FILES CLOSED FOR INCOMPLETENESS
1
$54,070
2
$138,720
0
$0
0
$0
Aggregated Statistics For Year 2001 (Based on 2 partial tracts)
A) FHA, FSA/RHS & VA Home Purchase Loans
B) Conventional Home Purchase Loans
C) Refinancings
D) Home Improvement Loans
F) Non-occupant Loans on < 5 Family Dwellings (A B C & D)
Number
Average Value
Number
Average Value
Number
Average Value
Number
Average Value
Number
Average Value
LOANS ORIGINATED
1
$126,830
10
$186,563
21
$135,953
1
$38,220
2
$203,260
APPLICATIONS APPROVED, NOT ACCEPTED
0
$0
1
$114,090
3
$213,553
0
$0
0
$0
APPLICATIONS DENIED
0
$0
1
$58,320
5
$97,680
0
$0
0
$0
APPLICATIONS WITHDRAWN
0
$0
1
$287,630
3
$178,670
0
$0
0
$0
FILES CLOSED FOR INCOMPLETENESS
0
$0
0
$0
1
$131,360
0
$0
0
$0
Aggregated Statistics For Year 2000 (Based on 2 partial tracts)
A) FHA, FSA/RHS & VA Home Purchase Loans
B) Conventional Home Purchase Loans
C) Refinancings
D) Home Improvement Loans
F) Non-occupant Loans on < 5 Family Dwellings (A B C & D)
Number
Average Value
Number
Average Value
Number
Average Value
Number
Average Value
Number
Average Value
LOANS ORIGINATED
1
$116,920
9
$160,647
5
$138,718
2
$47,970
2
$109,350
APPLICATIONS APPROVED, NOT ACCEPTED
0
$0
2
$119,045
1
$126,830
0
$0
0
$0
APPLICATIONS DENIED
0
$0
1
$65,110
3
$95,307
0
$0
0
$0
APPLICATIONS WITHDRAWN
0
$0
1
$131,360
1
$783,220
0
$0
0
$0
FILES CLOSED FOR INCOMPLETENESS
0
$0
0
$0
1
$150,330
0
$0
0
$0
Aggregated Statistics For Year 1999 (Based on 2 partial tracts)
A) FHA, FSA/RHS & VA Home Purchase Loans
B) Conventional Home Purchase Loans
C) Refinancings
D) Home Improvement Loans
F) Non-occupant Loans on < 5 Family Dwellings (A B C & D)
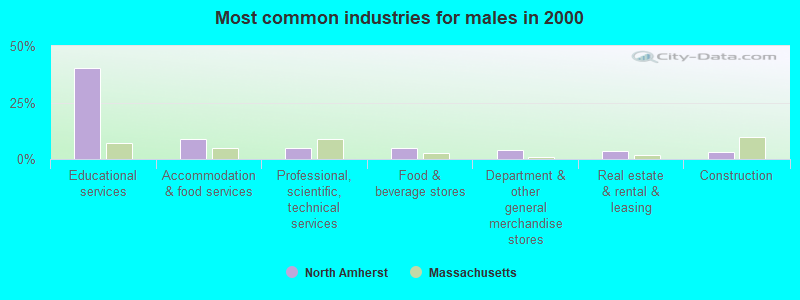
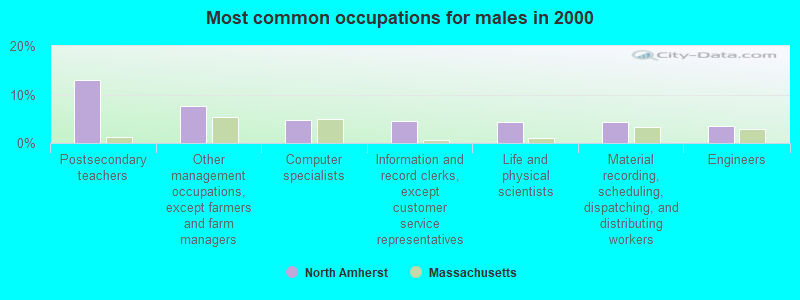
#2 on the list of "Top 101 cities with largest percentage of males in industries: educational services (population 5,000+)"
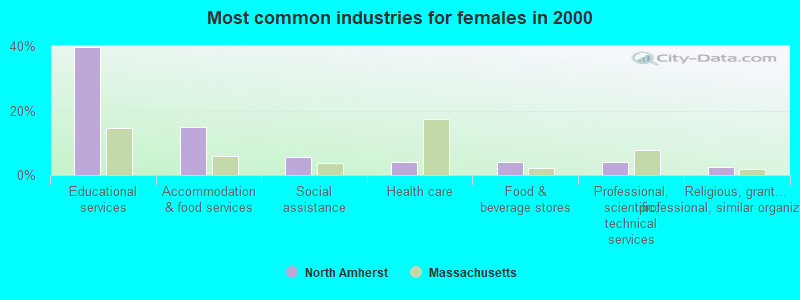
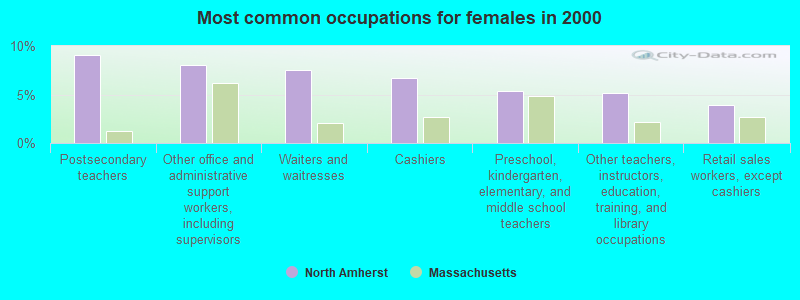
#5 on the list of "Top 101 cities with largest percentage of females in industries: educational services (population 5,000+)"
#8 on the list of "Top 101 cities with largest percentage of females in occupations: life, physical, and social science occupations (population 5,000+)"
#9 on the list of "Top 101 cities with largest percentage of males in occupations: life, physical, and social science occupations (population 5,000+)"
#10 on the list of "Top 101 cities with the most residents born in Afghanistan (population 500+)"
#11 on the list of "Top 100 cities with highest percentage of college students (pop. 5,000+)"
#13 on the list of "Top 101 cities with the most people taking a bicycle to work (population 5,000+)"
#16 on the list of "Top 101 cities with the most residents born in Other Western Asia (population 500+)"
#21 on the list of "Top 101 cities with the most residents born in Turkey (population 500+)"
#28 on the list of "Top 101 cities where the highest percentage of males (15+ years) which never married (with at least 1,000 males in this group)"
#30 on the list of "Top 101 cities with largest percentage of males in occupations: education, training, and library occupations (population 5,000+)"
#35 on the list of "Top 101 cities with largest percentage of females in occupations: fire fighting and prevention workers including supervisors (population 5,000+)"
#35 on the list of "Top 101 cities with the least people living the same house as 1 year ago (population 5,000+))"
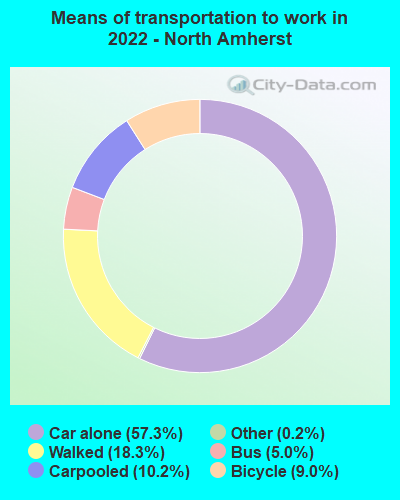
#39 on the list of "Top 101 cities with the least people driving a car to work alone (population 5,000+)"
#41 on the list of "Top 101 cities where the highest percentage of females (15+ years) which never married (with at least 1,000 females in this group)"
#68 on the list of "Top 101 cities with the most residents born in China, excluding Hong Kong and Taiwan (population 500+)"
#76 on the list of "Top 101 cities with the most people having Master's or Doctorate degrees (population 5,000+)"
#88 on the list of "Top 101 cities with the most people having Doctorate degrees (population 500+)"
#99 on the list of "Top 101 cities with the largest percentage of likely lesbian couples (counted as self-reported female-female unmarried-partner households) (population 5,000+)"
#100 on the list of "Top 101 cities with the most residents born in Western Asia (population 500+)"
#2 on the list of "Top 101 counties with the lowest number of births per 1000 residents 2007-2013"
#9 on the list of "Top 101 counties with the lowest Particulate Matter (PM10) Annual air pollution readings in 2012 (µg/m3)"
#19 on the list of "Top 101 counties with the lowest average weight of females"
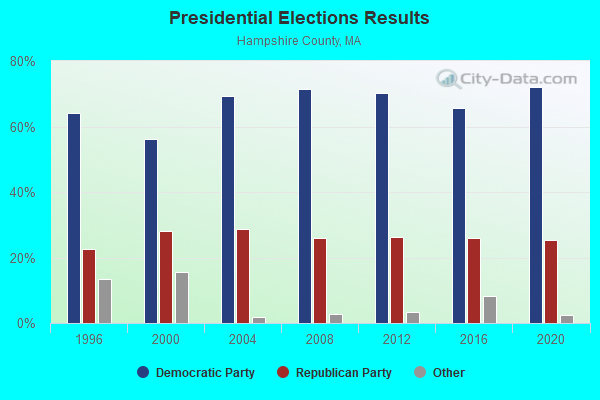
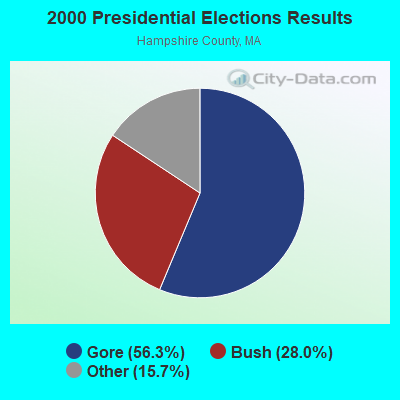
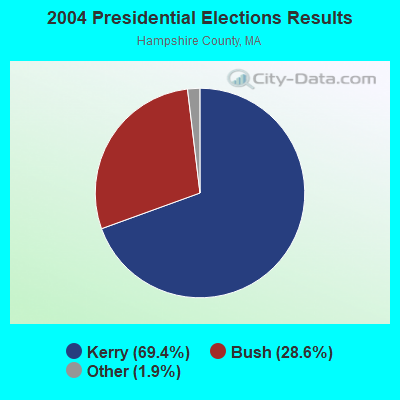
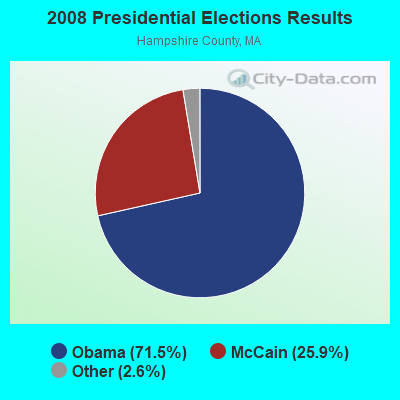
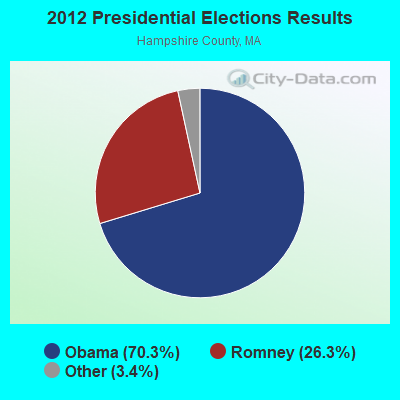
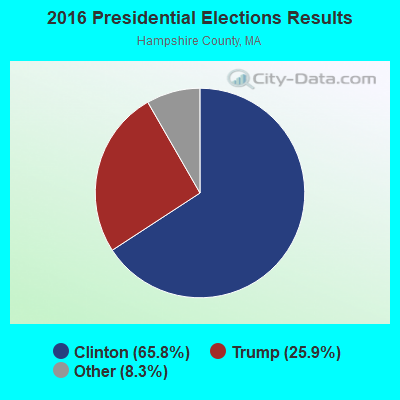
#30 on the list of "Top 101 counties with highest percentage of residents voting for 3rd party candidates in the 2012 Presidential Election (pop. 50,000+)"
#41 on the list of "Top 101 counties with the highest percentage of residents that exercised in the past month"


 Recent articles from our blog. Our writers, many of them Ph.D. graduates or candidates, create easy-to-read articles on a wide variety of topics.

 (16.7 miles