Races in North Amherst, Massachusetts (MA) Detailed Stats
Data:
Races - White alone (%)
Races - White alone (% change since 2000)
Races - Black alone (%)
Races - Black alone (% change since 2000)
Races - American Indian alone (%)
Races - American Indian alone (% change since 2000)
Races - Asian alone (%)
Races - Asian alone (% change since 2000)
Races - Hispanic (%)
Races - Hispanic (% change since 2000)
Races - Native Hawaiian and Other Pacific Islander alone (%)
Races - Native Hawaiian and Other Pacific Islander alone (% change since 2000)
Races - Two or more races(%)
Races - Two or more races(% change since 2000)
Races - Other race alone (%)
Races - Other race alone (% change since 2000)
Racial diversity
Place of birth - Born in state of residence (%)
Place of birth - Born in state of residence (%) - White
Place of birth - Born in state of residence (%) - Black or African American
Place of birth - Born in state of residence (%) - Asian
Place of birth - Born in state of residence (%) - Hispanic or Latino
Place of birth - Born in state of residence (%) - American Indian and Alaska Native
Place of birth - Born in state of residence (%) - Multirace
Place of birth - Born in state of residence (%) - Other Race
Place of birth - Born in other state (%)
Place of birth - Born in other state (%) - White
Place of birth - Born in other state (%) - Black or African American
Place of birth - Born in other state (%) - Asian
Place of birth - Born in other state (%) - Hispanic or Latino
Place of birth - Born in other state (%) - American Indian and Alaska Native
Place of birth - Born in other state (%) - Multirace
Place of birth - Born in other state (%) - Other Race
Place of birth - Native, outside of US (%)
Place of birth - Native, outside of US (%) - White
Place of birth - Native, outside of US (%) - Black or African American
Place of birth - Native, outside of US (%) - Asian
Place of birth - Native, outside of US (%) - Hispanic or Latino
Place of birth - Native, outside of US (%) - American Indian and Alaska Native
Place of birth - Native, outside of US (%) - Multirace
Place of birth - Native, outside of US (%) - Other Race
Place of birth - Foreign born (%)
Place of birth - Foreign born (%) - White
Place of birth - Foreign born (%) - Black or African American
Place of birth - Foreign born (%) - Asian
Place of birth - Foreign born (%) - Hispanic or Latino
Place of birth - Foreign born (%) - American Indian and Alaska Native
Place of birth - Foreign born (%) - Multirace
Place of birth - Foreign born (%) - Other Race
Residents speaking English at home (%)
Residents speaking English at home - Born in the United States (%)
Residents speaking English at home - Native, born elsewhere (%)
Residents speaking English at home - Foreign born (%)
Residents speaking Spanish at home (%)
Residents speaking Spanish at home - Born in the United States (%)
Residents speaking Spanish at home - Native, born elsewhere (%)
Residents speaking Spanish at home - Foreign born (%)
Residents speaking other language at home (%)
Residents speaking other language at home - Born in the United States (%)
Residents speaking other language at home - Native, born elsewhere (%)
Residents speaking other language at home - Foreign born (%)
Marital status - Never married (%)
Marital status - Now married (%)
Marital status - Separated (%)
Marital status - Widowed (%)
Marital status - Divorced (%)
Ancestries Reported - Arab (%)
Ancestries Reported - Czech (%)
Ancestries Reported - Danish (%)
Ancestries Reported - Dutch (%)
Ancestries Reported - English (%)
Ancestries Reported - French (%)
Ancestries Reported - French Canadian (%)
Ancestries Reported - German (%)
Ancestries Reported - Greek (%)
Ancestries Reported - Hungarian (%)
Ancestries Reported - Irish (%)
Ancestries Reported - Italian (%)
Ancestries Reported - Lithuanian (%)
Ancestries Reported - Norwegian (%)
Ancestries Reported - Polish (%)
Ancestries Reported - Portuguese (%)
Ancestries Reported - Russian (%)
Ancestries Reported - Scotch-Irish (%)
Ancestries Reported - Scottish (%)
Ancestries Reported - Slovak (%)
Ancestries Reported - Subsaharan African (%)
Ancestries Reported - Swedish (%)
Ancestries Reported - Swiss (%)
Ancestries Reported - Ukrainian (%)
Ancestries Reported - United States (%)
Ancestries Reported - Welsh (%)
Ancestries Reported - West Indian (%)
Ancestries Reported - Other (%)
Geographical mobility - Same house 1 year ago (%)
Geographical mobility - Same house 1 year ago (%) - White
Geographical mobility - Same house 1 year ago (%) - Black or African American
Geographical mobility - Same house 1 year ago (%) - Asian
Geographical mobility - Same house 1 year ago (%) - Hispanic or Latino
Geographical mobility - Same house 1 year ago (%) - American Indian and Alaska Native
Geographical mobility - Same house 1 year ago (%) - Multirace
Geographical mobility - Same house 1 year ago (%) - Other Race
Geographical mobility - Moved within same county (%)
Geographical mobility - Moved within same county (%) - White
Geographical mobility - Moved within same county (%) - Black or African American
Geographical mobility - Moved within same county (%) - Asian
Geographical mobility - Moved within same county (%) - Hispanic or Latino
Geographical mobility - Moved within same county (%) - American Indian and Alaska Native
Geographical mobility - Moved within same county (%) - Multirace
Geographical mobility - Moved within same county (%) - Other Race
Geographical mobility - Moved from different county within same state (%)
Geographical mobility - Moved from different county within same state (%) - White
Geographical mobility - Moved from different county within same state (%) - Black or African American
Geographical mobility - Moved from different county within same state (%) - Asian
Geographical mobility - Moved from different county within same state (%) - Hispanic or Latino
Geographical mobility - Moved from different county within same state (%) - American Indian and Alaska Native
Geographical mobility - Moved from different county within same state (%) - Multirace
Geographical mobility - Moved from different county within same state (%) - Other Race
Geographical mobility - Moved from different state (%)
Geographical mobility - Moved from different state (%) - White
Geographical mobility - Moved from different state (%) - Black or African American
Geographical mobility - Moved from different state (%) - Asian
Geographical mobility - Moved from different state (%) - Hispanic or Latino
Geographical mobility - Moved from different state (%) - American Indian and Alaska Native
Geographical mobility - Moved from different state (%) - Multirace
Geographical mobility - Moved from different state (%) - Other Race
Geographical mobility - Moved from abroad (%)
Geographical mobility - Moved from abroad (%) - White
Geographical mobility - Moved from abroad (%) - Black or African American
Geographical mobility - Moved from abroad (%) - Asian
Geographical mobility - Moved from abroad (%) - Hispanic or Latino
Geographical mobility - Moved from abroad (%) - American Indian and Alaska Native
Geographical mobility - Moved from abroad (%) - Multirace
Geographical mobility - Moved from abroad (%) - Other Race
Place of birth for the foreign-born population - Ireland (%)
Place of birth for the foreign-born population - Denmark (%)
Place of birth for the foreign-born population - Norway (%)
Place of birth for the foreign-born population - Sweden (%)
Place of birth for the foreign-born population - United Kingdom (%)
Place of birth for the foreign-born population - England (%)
Place of birth for the foreign-born population - Scotland (%)
Place of birth for the foreign-born population - Other Northern Europe (%)
Place of birth for the foreign-born population - Austria (%)
Place of birth for the foreign-born population - Belgium (%)
Place of birth for the foreign-born population - France (%)
Place of birth for the foreign-born population - Germany (%)
Place of birth for the foreign-born population - Netherlands (%)
Place of birth for the foreign-born population - Switzerland (%)
Place of birth for the foreign-born population - Other Western Europe (%)
Place of birth for the foreign-born population - Greece (%)
Place of birth for the foreign-born population - Italy (%)
Place of birth for the foreign-born population - Portugal (%)
Place of birth for the foreign-born population - Spain (%)
Place of birth for the foreign-born population - Other Southern Europe (%)
Place of birth for the foreign-born population - Albania (%)
Place of birth for the foreign-born population - Belarus (%)
Place of birth for the foreign-born population - Bosnia and Herzegovina (%)
Place of birth for the foreign-born population - Bulgaria (%)
Place of birth for the foreign-born population - Croatia (%)
Place of birth for the foreign-born population - Czechoslovakia (%)
Place of birth for the foreign-born population - Hungary (%)
Place of birth for the foreign-born population - Latvia (%)
Place of birth for the foreign-born population - Lithuania (%)
Place of birth for the foreign-born population - North Macedonia (Macedonia) (%)
Place of birth for the foreign-born population - Moldova (%)
Place of birth for the foreign-born population - Poland (%)
Place of birth for the foreign-born population - Romania (%)
Place of birth for the foreign-born population - Russia (%)
Place of birth for the foreign-born population - Serbia (%)
Place of birth for the foreign-born population - Ukraine (%)
Place of birth for the foreign-born population - Other Eastern Europe (%)
Place of birth for the foreign-born population - China (%)
Place of birth for the foreign-born population - Hong Kong (%)
Place of birth for the foreign-born population - Taiwan (%)
Place of birth for the foreign-born population - Japan (%)
Place of birth for the foreign-born population - Korea (%)
Place of birth for the foreign-born population - Other Eastern Asia (%)
Place of birth for the foreign-born population - Afghanistan (%)
Place of birth for the foreign-born population - Bangladesh (%)
Place of birth for the foreign-born population - India (%)
Place of birth for the foreign-born population - Iran (%)
Place of birth for the foreign-born population - Kazakhstan (%)
Place of birth for the foreign-born population - Nepal (%)
Place of birth for the foreign-born population - Pakistan (%)
Place of birth for the foreign-born population - Sri Lanka (%)
Place of birth for the foreign-born population - Uzbekistan (%)
Place of birth for the foreign-born population - Other South Central Asia (%)
Place of birth for the foreign-born population - Burma (%)
Place of birth for the foreign-born population - Cambodia (%)
Place of birth for the foreign-born population - Indonesia (%)
Place of birth for the foreign-born population - Laos (%)
Place of birth for the foreign-born population - Malaysia (%)
Place of birth for the foreign-born population - Philippines (%)
Place of birth for the foreign-born population - Singapore (%)
Place of birth for the foreign-born population - Thailand (%)
Place of birth for the foreign-born population - Vietnam (%)
Place of birth for the foreign-born population - Other South Eastern Asia (%)
Place of birth for the foreign-born population - Armenia (%)
Place of birth for the foreign-born population - Iraq (%)
Place of birth for the foreign-born population - Israel (%)
Place of birth for the foreign-born population - Jordan (%)
Place of birth for the foreign-born population - Kuwait (%)
Place of birth for the foreign-born population - Lebanon (%)
Place of birth for the foreign-born population - Saudi Arabia (%)
Place of birth for the foreign-born population - Syria (%)
Place of birth for the foreign-born population - Turkey (%)
Place of birth for the foreign-born population - Yemen (%)
Place of birth for the foreign-born population - Other Western Asia (%)
Place of birth for the foreign-born population - Eritrea (%)
Place of birth for the foreign-born population - Ethiopia (%)
Place of birth for the foreign-born population - Kenya (%)
Place of birth for the foreign-born population - Somalia (%)
Place of birth for the foreign-born population - Uganda (%)
Place of birth for the foreign-born population - Zimbabwe (%)
Place of birth for the foreign-born population - Other Eastern Africa (%)
Place of birth for the foreign-born population - Cameroon (%)
Place of birth for the foreign-born population - Congo (%)
Place of birth for the foreign-born population - Democratic Republic of Congo (Zaire) (%)
Place of birth for the foreign-born population - Other Middle Africa (%)
Place of birth for the foreign-born population - Egypt (%)
Place of birth for the foreign-born population - Morocco (%)
Place of birth for the foreign-born population - Sudan (%)
Place of birth for the foreign-born population - Other Northern Africa (%)
Place of birth for the foreign-born population - South Africa (%)
Place of birth for the foreign-born population - Other Southern Africa (%)
Place of birth for the foreign-born population - Cabo Verde (%)
Place of birth for the foreign-born population - Ghana (%)
Place of birth for the foreign-born population - Liberia (%)
Place of birth for the foreign-born population - Nigeria (%)
Place of birth for the foreign-born population - Senegal (%)
Place of birth for the foreign-born population - Sierra Leone (%)
Place of birth for the foreign-born population - Other Western Africa (%)
Place of birth for the foreign-born population - Australia (%)
Place of birth for the foreign-born population - New Zealand (%)
Place of birth for the foreign-born population - Fiji (%)
Place of birth for the foreign-born population - Micronesia (%)
Place of birth for the foreign-born population - Bahamas (%)
Place of birth for the foreign-born population - Barbados (%)
Place of birth for the foreign-born population - Cuba (%)
Place of birth for the foreign-born population - Dominica (%)
Place of birth for the foreign-born population - Dominican Republic (%)
Place of birth for the foreign-born population - Grenada (%)
Place of birth for the foreign-born population - Haiti (%)
Place of birth for the foreign-born population - Jamaica (%)
Place of birth for the foreign-born population - St. Vincent and the Grenadines (%)
Place of birth for the foreign-born population - Trinidad and Tobago (%)
Place of birth for the foreign-born population - West Indies (%)
Place of birth for the foreign-born population - Other Caribbean (%)
Place of birth for the foreign-born population - Belize (%)
Place of birth for the foreign-born population - Costa Rica (%)
Place of birth for the foreign-born population - El Salvador (%)
Place of birth for the foreign-born population - Guatemala (%)
Place of birth for the foreign-born population - Honduras (%)
Place of birth for the foreign-born population - Mexico (%)
Place of birth for the foreign-born population - Nicaragua (%)
Place of birth for the foreign-born population - Panama (%)
Place of birth for the foreign-born population - Other Central America (%)
Place of birth for the foreign-born population - Argentina (%)
Place of birth for the foreign-born population - Bolivia (%)
Place of birth for the foreign-born population - Brazil (%)
Place of birth for the foreign-born population - Chile (%)
Place of birth for the foreign-born population - Colombia (%)
Place of birth for the foreign-born population - Ecuador (%)
Place of birth for the foreign-born population - Guyana (%)
Place of birth for the foreign-born population - Peru (%)
Place of birth for the foreign-born population - Uruguay (%)
Place of birth for the foreign-born population - Venezuela (%)
Place of birth for the foreign-born population - Other South America (%)
Place of birth for the foreign-born population - Canada (%)
Place of birth for the foreign-born population - Other Northern America (%)
Place of birth for the foreign-born population - Other (%)
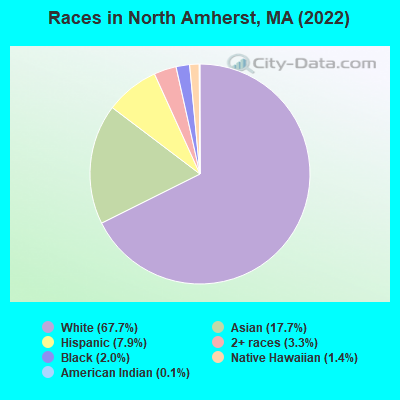
According to 2022 data, the most numerous races in North Amherst, MA are White alone (4,796 residents), Hispanic (557 residents), and Asian alone (1,252 residents). 76.5% of North Amherst residents speak English at home. 20.1% of North Amherst, MA residents are foreign-born (12.9% born in Asia, 3.9% born in Europe), which is 10.3% greater than the foreign-born rate of 18.0% across the entire state of Massachusetts.
Race distribution in North Amherst
2000 2022
5,198,359 81.9% White alone 428,729 6.8% Hispanic 318,329 5.0% Black alone 236,786 3.7% Asian alone 110,338 1.7% Two or more races 43,586 0.7% Other race alone 11,264 0.2% American Indian alone 1,706 0.03% Native Hawaiian and Other
4,676,627 67.0% White alone 911,038 13.0% Hispanic 501,463 7.2% Asian alone 459,740 6.6% Black alone 341,889 4.9% Two or more races 84,403 1.2% Other race alone 5,838 0.08% American Indian alone 976 0.01% Native Hawaiian and Other
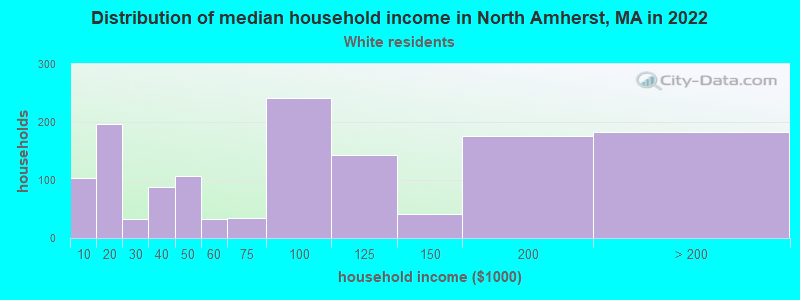
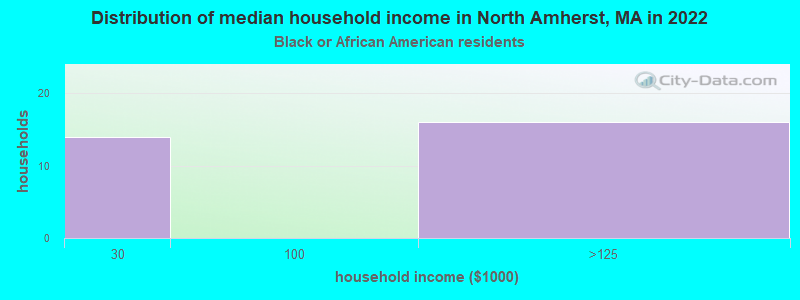
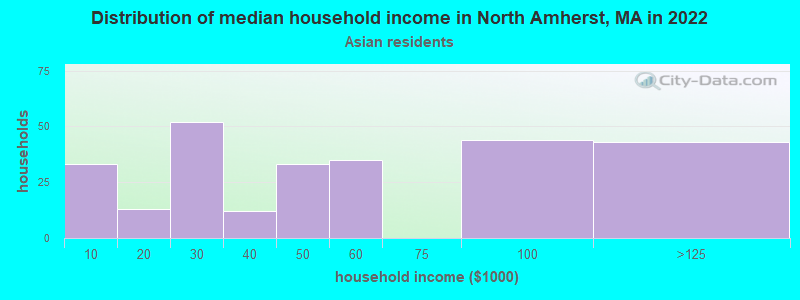
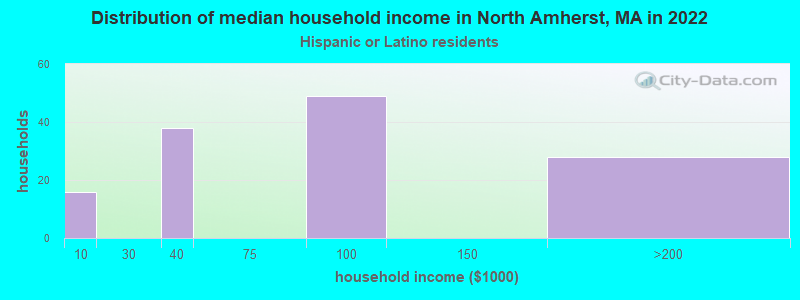
Income and house value in North Amherst Median household income in 2022 $74,803 White non-Hispanic householders$138,551 Black householders$34,252 Asian householders$37,037 Some other race householders$51,853 Two or more races householders$60,085 Hispanic or Latino race householdersMedian 2022 house value $485,990 White Non-Hispanic householders $577,470 Asian householders$441,809 Two or more races householders
Median age by race in North Amherst
22.3 Median age for White residents22.6 22.2 26.2 Median age for Black or African American residents24.2 20.0 22.7 Median age for American Indian / Alaska Native residents25.6 Median age for Asian residents23.6 27.0 12.5 Median age for Native Hawaiian / Pacific Islander residents27.0 Median age for Other race residents29.8 Median age for Two or more races residents25.7 38.9 22.0 Median age for White alone residents21.9 22.0 24.5 Median age for Hispanic or Latino residents23.7 28.3
Owner/renter occupied households by race in North Amherst
House owners and renters - White residents 533 38.5% Owner occupied850 61.5% Renter occupiedHouse owners and renters - Black or African American residents 14 47.3% Owner occupied15 52.7% Renter occupiedHouse owners and renters - American Indian / Alaska Native residents 38 100.0% Owner occupiedHouse owners and renters - Asian residents 55 18.0% Owner occupied251 82.0% Renter occupiedHouse owners and renters - Native Hawaiian / Pacific Islander residents 56 100.0% Owner occupiedHouse owners and renters - White alone residents 538 39.4% Owner occupied829 60.6% Renter occupiedHouse owners and renters - Hispanic or Latino residents 31 21.6% Owner occupied112 78.4% Renter occupied
Language usage in North Amherst
English speakers - Total 76.5% of residents of North Amherst speak English at home.
3.6% of residents speak Spanish at home 177 71.4% Speak English very well71 28.6% Speak English less than very well19.8% of residents speak other language at home 1,050 77.0% Speak English very well314 23.0% Speak English less than very well
English speakers - Born in the United States 87.9% of residents of North Amherst speak English at home.
4.0% of residents speak Spanish at home 83 86.5% Speak English very well13 13.5% Speak English less than very well8.1% of residents speak other language at home 196 100.0% Speak English very well
English speakers - Native, born elsewhere 70.1% of residents of North Amherst speak English at home.
31.2% of residents speak other language at home 24 100.0% Speak English very well
English speakers - Foreign-born 20.3% of residents of North Amherst speak English at home.
8.6% of residents speak Spanish at home 65 52.4% Speak English very well59 47.6% Speak English less than very well71.2% of residents speak other language at home 710 69.4% Speak English very well313 30.6% Speak English less than very well
White (Caucasian) - Speak only English Native:
98.3% (4,457)Foreign-born:
42.8% (185)
White (Caucasian) - Speak another language Native:
2.7% (123)Foreign-born:
59.1% (256)
Black or African American - Speak another language Native:
26.9% (35)Foreign-born:
95.3% (25)
American Indian / Alaska Native - Speak another language Native:
100.0% (55)Foreign-born:
91.3% (38)
Asian - Speak only English Native:
6.0% (16)Foreign-born:
20.0% (179)
Asian - Speak another language Native:
100.0% (275)Foreign-born:
79.2% (710)
Two or more races - Speak another language Native:
23.0% (95)Foreign-born:
100.0% (33)
White alone - Speak only English Native:
97.7% (4,335)Foreign-born:
44.0% (165)
White alone - Speak another language Native:
2.4% (108)Foreign-born:
55.1% (206)
Hispanic or Latino - Speak only English Native:
69.0% (238)Foreign-born:
25.8% (50)
Hispanic or Latino - Speak another language Native:
32.3% (111)Foreign-born:
76.7% (147)
Foreign-born residents in North Amherst 1,411 residents are foreign born (12.9% Asia , 3.9% Europe ).
This city:
20.1%Massachusetts:
100.0%
Marital status for residents in North Amherst Marital status - White (Caucasian) population 15 years and over
Males 75.7% Never married20.0% Now married2.2% Separated0.3% Widowed1.8% DivorcedFemales 73.1% Never married21.7% Now married0.0% Separated3.0% Widowed2.1% DivorcedWomen who gave birth in the past 12 months Now married:
81.0% (15)Unmarried:
19.0% (4)
Women who did not give birth in the past 12 months Now married:
9.2% (156)Unmarried:
90.8% (1,547)
Marital status - Black or African American population 15 years and over
Males 61.3% Never married38.7% Now married0.0% Separated0.0% Widowed0.0% DivorcedFemales 100.0% Never married0.0% Now married0.0% Separated0.0% Widowed0.0% DivorcedWomen who did not give birth in the past 12 months Now married:
0.0% (0)Unmarried:
100.0% (103)
Marital status - American Indian / Alaska Native population 15 years and over
Males 0.0% Never married100.0% Now married0.0% Separated0.0% Widowed0.0% DivorcedFemales 37.5% Never married62.5% Now married0.0% Separated0.0% Widowed0.0% DivorcedWomen who did not give birth in the past 12 months Now married:
62.5% (15)Unmarried:
37.5% (9)
Marital status - Asian population 15 years and over
Males 59.0% Never married41.0% Now married0.0% Separated0.0% Widowed0.0% DivorcedFemales 45.3% Never married48.4% Now married0.0% Separated6.3% Widowed0.0% DivorcedWomen who gave birth in the past 12 months Now married:
100.0% (23)Unmarried:
0.0% (0)
Women who did not give birth in the past 12 months Now married:
41.0% (174)Unmarried:
59.0% (250)
Marital status - Two or more races population 15 years and over
Males 100.0% Never married0.0% Now married0.0% Separated0.0% Widowed0.0% DivorcedFemales 83.3% Never married16.7% Now married0.0% Separated0.0% Widowed0.0% DivorcedWomen who did not give birth in the past 12 months Now married:
0.0% (0)Unmarried:
100.0% (199)
Marital status - White alone, not Hispanic / Latino population 15 years and over
Males 77.2% Never married18.2% Now married2.4% Separated0.4% Widowed1.9% DivorcedFemales 75.3% Never married19.2% Now married0.0% Separated3.2% Widowed2.3% DivorcedWomen who gave birth in the past 12 months Now married:
0.0% (0)Unmarried:
100.0% (4)
Women who did not give birth in the past 12 months Now married:
6.6% (111)Unmarried:
93.4% (1,570)
Marital status - Hispanic or Latino population 15 years and over
Males 58.1% Never married41.9% Now married0.0% Separated0.0% Widowed0.0% DivorcedFemales 40.0% Never married60.0% Now married0.0% Separated0.0% Widowed0.0% DivorcedWomen who gave birth in the past 12 months Now married:
100.0% (19)Unmarried:
0.0% (0)
Women who did not give birth in the past 12 months Now married:
51.5% (78)Unmarried:
48.5% (74)
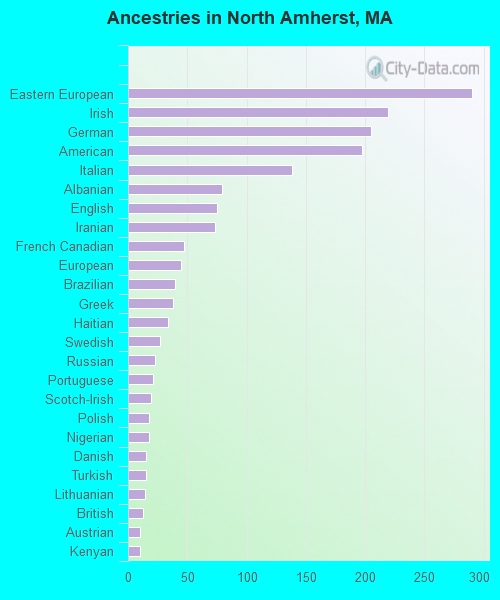
Ancestries in North Amherst
290 10.3% Eastern European219 7.8% Irish205 7.3% German197 7.0% American138 4.9% Italian79 2.8% Albanian75 2.7% English73 2.6% Iranian47 1.7% French Canadian45 1.6% European40 1.4% Brazilian38 1.3% Greek34 1.2% Haitian27 1.0% Swedish23 0.8% Russian21 0.7% Portuguese19 0.7% Scotch-Irish18 0.6% Polish18 0.6% Nigerian15 0.5% Danish15 0.5% Turkish14 0.5% Lithuanian13 0.5% British10 0.4% Austrian10 0.4% Kenyan9 0.3% Armenian8 0.3% Hungarian4 0.1% French3 0.1% Australian3 0.1% Scottish
Children Nativity (place of birth) in North Amherst
Children under 6 years - Living with two parents Both parents native 31 100.0% NativeBoth parents foreign-born 77 74.1% Native27 25.9% Foreign-bornOne native, one foreign-born parent 20 100.0% NativeChildren under 6 years - Living with one parent Native parent 2 100.0% NativeForeign-born parent 34 100.0% NativeChildren 6 to 17 years - Living with two parents Both parents native 128 100.0% NativeBoth parents foreign-born 27 56.4% Native21 43.6% Foreign-bornOne native, one foreign-born parent 14 100.0% NativeChildren 6 to 17 years - Living with one parent Native parent 130 86.5% Native20 13.5% Foreign-bornForeign-born parent 18 100.0% Native
Grandparents responsible for own grandchildren in North Amherst
Grandparents (30 to 59 years) Asian 34 100.0% Not responsible for grandchildren
Grandparents (60 years and over)