According to our research of Tennessee and other state lists, there were 15 registered sex offenders living in Munford, Tennessee as of June 03, 2024. The ratio of all residents to sex offenders in Munford is 408 to 1. The ratio of registered sex offenders to all residents in this city is near the state average.
Crime rates in Munford by year
Type
2009
2010
2011
2012
2013
2014
2015
2016
2017
2018
2019
2020
2021
2022
Murders (per 100,000)
1 (14.6)
0 (0.0)
2 (33.4)
0 (0.0)
0 (0.0)
0 (0.0)
0 (0.0)
0 (0.0)
0 (0.0)
1 (16.4)
1 (16.4)
0 (0.0)
0 (0.0)
0 (0.0)
Rapes (per 100,000)
6 (87.6)
1 (16.9)
1 (16.7)
0 (0.0)
5 (82.8)
4 (66.2)
0 (0.0)
1 (16.3)
3 (49.4)
7 (114.9)
3 (49.3)
4 (65.2)
2 (32.1)
3 (46.4)
Robberies (per 100,000)
1 (14.6)
0 (0.0)
1 (16.7)
4 (66.6)
1 (16.6)
1 (16.5)
1 (16.4)
1 (16.3)
1 (16.5)
1 (16.4)
1 (16.4)
0 (0.0)
0 (0.0)
0 (0.0)
Assaults (per 100,000)
7 (102.2)
8 (135.0)
24 (401.3)
21 (349.9)
8 (132.5)
20 (330.8)
18 (296.0)
14 (228.0)
12 (197.4)
20 (328.4)
12 (197.3)
8 (130.4)
19 (304.8)
7 (108.3)
Burglaries (per 100,000)
27 (394.1)
27 (455.5)
26 (434.8)
23 (383.2)
35 (579.9)
18 (297.7)
25 (411.0)
19 (309.4)
11 (181.0)
30 (492.6)
18 (295.9)
20 (326.1)
9 (144.4)
13 (201.1)
Thefts (per 100,000)
107 (1,562)
90 (1,518)
97 (1,622)
82 (1,366)
114 (1,889)
107 (1,770)
95 (1,562)
81 (1,319)
88 (1,448)
77 (1,264)
60 (986.4)
60 (978.2)
20 (320.9)
51 (788.7)
Auto thefts (per 100,000)
9 (131.4)
5 (84.4)
6 (100.3)
5 (83.3)
1 (16.6)
6 (99.2)
5 (82.2)
4 (65.1)
8 (131.6)
7 (114.9)
5 (82.2)
6 (97.8)
3 (48.1)
9 (139.2)
Arson (per 100,000)
0 (0.0)
0 (0.0)
1 (16.7)
0 (0.0)
1 (16.6)
1 (16.5)
1 (16.4)
0 (0.0)
1 (16.5)
0 (0.0)
0 (0.0)
0 (0.0)
0 (0.0)
1 (15.5)
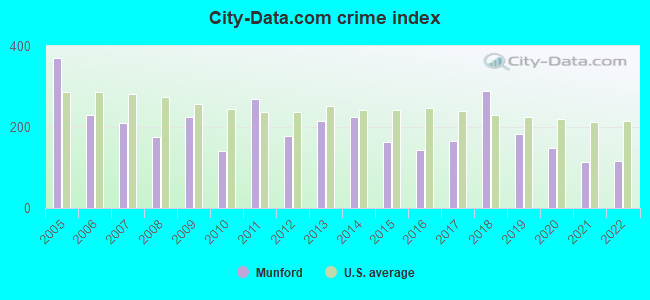
City-Data.com crime index
224.6
139.9
268.9
178.1
215.2
223.6
162.0
143.2
165.0
289.7
183.5
148.0
113.4
115.5
The City-Data.com crime index weighs serious crimes and violent crimes more heavily. Higher means more crime, U.S. average is 246.1. It adjusts for the number of visitors and daily workers commuting into cities.
Latest news from Munford, TN collected exclusively by city-data.com from local newspapers, TV, and radio stations
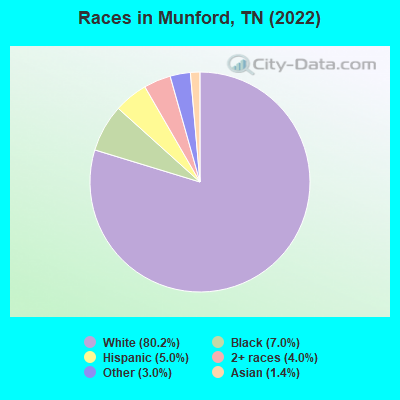
Ancestries: American (49.0%), European (9.1%), English (4.0%), Irish (3.9%), French (1.8%), Italian (1.6%).
Current Local Time: CST time zone
Incorporated in 1905
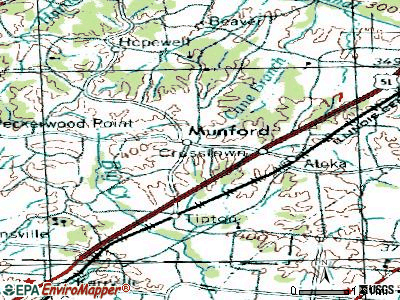
Elevation: 445 feet
Land area: 8.04 square miles.
Population density: 822 people per square mile (low).
147 residents are foreign born (1.8% Asia, 0.3% Europe).
This town:
2.3%
Tennessee:
5.4%
Median real estate property taxes paid for housing units with mortgages in 2022: $1,345 (0.5%) Median real estate property taxes paid for housing units with no mortgage in 2022: $1,417 (0.7%)
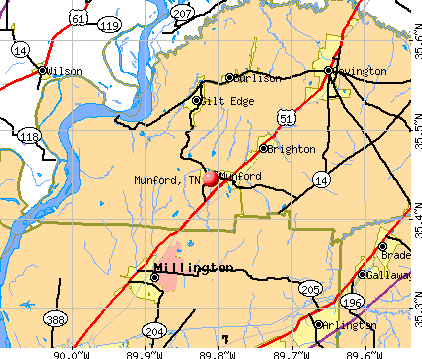
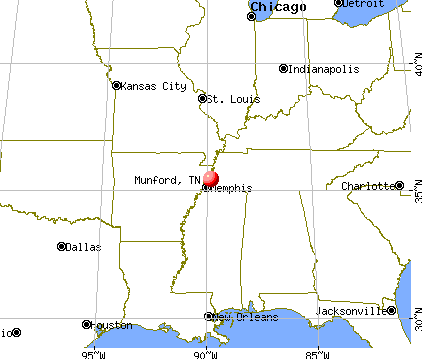
Nearest city with pop. 50,000+: Memphis, TN (24.4 miles , pop. 650,100).
Nearest city with pop. 1,000,000+: Dallas, TX (439.2 miles , pop. 1,188,580).
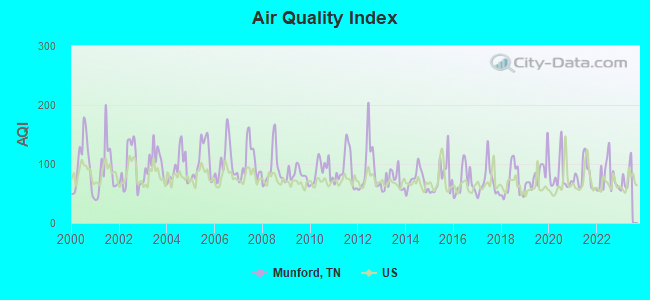
Air Quality Index (AQI) level in 2022 was 77.6. This is about average.
City:
77.6
U.S.:
72.6
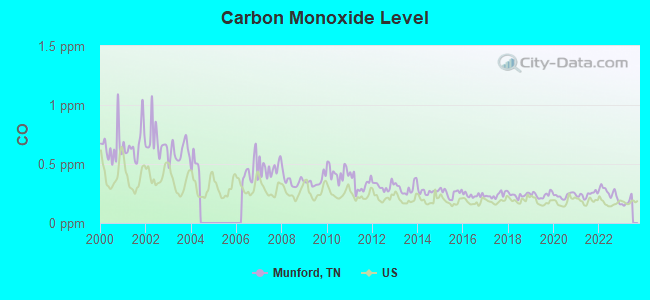
Carbon Monoxide (CO) [ppm] level in 2022 was 0.254. This is about average.Closest monitor was 19.7 miles away from the city center.
City:
0.254
U.S.:
0.251
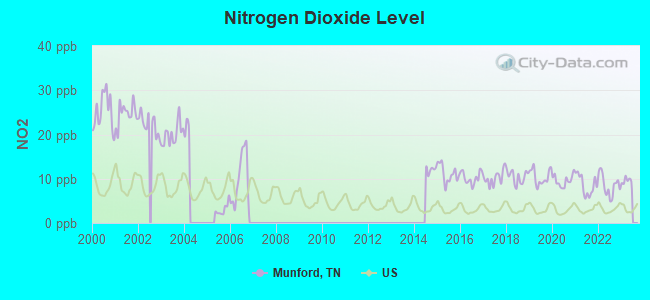
Nitrogen Dioxide (NO2) [ppb] level in 2022 was 8.52. This is significantly worse than average.Closest monitor was 13.1 miles away from the city center.
City:
8.52
U.S.:
5.11
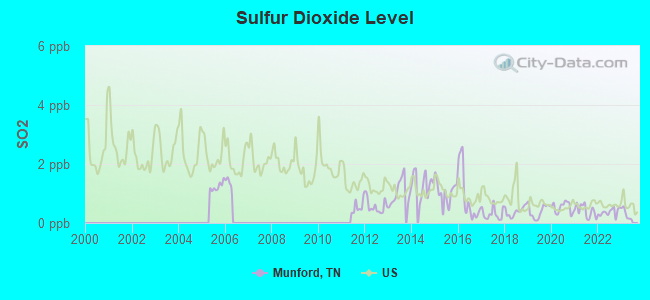
Sulfur Dioxide (SO2) [ppb] level in 2022 was 0.365. This is significantly better than average.Closest monitor was 13.1 miles away from the city center.
City:
0.365
U.S.:
1.515
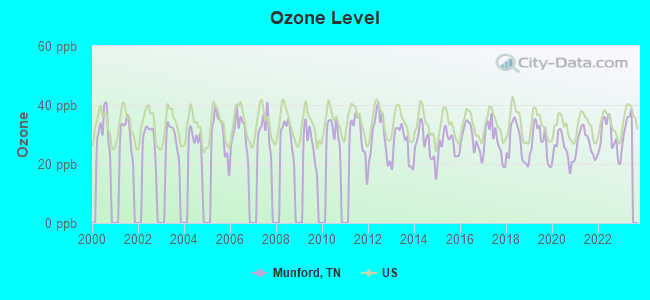
Ozone [ppb] level in 2022 was 29.2. This is about average.Closest monitor was 19.7 miles away from the city center.
City:
29.2
U.S.:
33.3
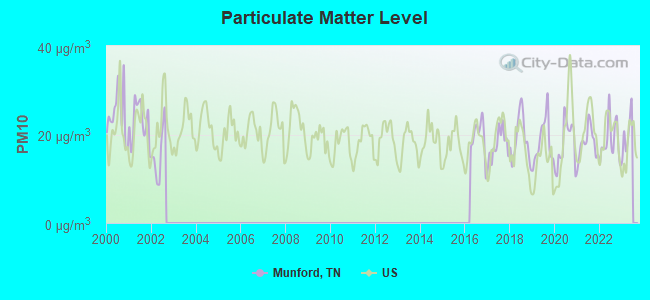
Particulate Matter (PM10) [µg/m3] level in 2022 was 18.5. This is about average.Closest monitor was 12.1 miles away from the city center.
City:
18.5
U.S.:
19.2
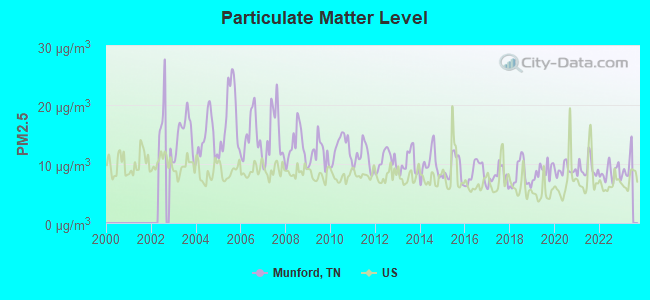
Particulate Matter (PM2.5) [µg/m3] level in 2022 was 8.53. This is about average.Closest monitor was 4.8 miles away from the city center.
City:
8.53
U.S.:
8.11
Tornado activity:
Munford-area historical tornado activity is above Tennessee state average. It is 109% greater than the overall U.S. average.
On 3/1/1997, a category F4 (max. wind speeds 207-260 mph) tornado 30.6 miles away from the Munford town center caused $30,000 in damages.
On 12/14/1987, a category F3 (max. wind speeds 158-206 mph) tornado 9.0 miles away from the town center killed 6 peopleand injured 121 peopleand causedbetween $5,000,000 and $50,000,000 in damages.
Earthquake activity:
Munford-area historical earthquake activity is significantly above Tennessee state average. It is 384% greater than the overall U.S. average.
On 3/25/1976 at 00:41:20, a magnitude 5.0 (4.9 MB, 5.0 LG, Class: Moderate, Intensity: VI - VII) earthquake occurred 32.0 miles away from the city center On 5/4/1991 at 01:18:54, a magnitude 5.0 (4.4 MB, 4.6 LG, 5.0 LG, Depth: 3.1 mi) earthquake occurred 77.4 miles away from Munford center On 4/27/1989 at 16:47:49, a magnitude 4.7 (4.6 MB, 4.7 LG, 4.3 LG, Class: Light, Intensity: IV - V) earthquake occurred 38.9 miles away from Munford center On 9/26/1990 at 13:18:51, a magnitude 5.0 (4.7 MB, 4.8 LG, 5.0 LG, Depth: 7.7 mi) earthquake occurred 120.1 miles away from Munford center On 3/25/1976 at 01:00:11, a magnitude 4.5 (4.1 MB, 4.5 LG) earthquake occurred 39.4 miles away from Munford center On 4/18/2008 at 09:36:59, a magnitude 5.4 (5.1 MB, 4.8 MS, 5.4 MW, 5.2 MW) earthquake occurred 233.6 miles away from the city center Magnitude types: regional Lg-wave magnitude (LG), body-wave magnitude (MB), surface-wave magnitude (MS), moment magnitude (MW)
Natural disasters:
The number of natural disasters in Tipton County (15) is near the US average (15). Major Disasters (Presidential) Declared: 12 Emergencies Declared: 1
Causes of natural disasters: Floods: 11, Storms: 11, Tornadoes: 6, Winds: 4, Winter Storms: 2, Flash Flood: 1, Hurricane: 1, Ice Storm: 1, Landslide: 1, Mudslide: 1, Other: 1 (Note: some incidents may be assigned to more than one category).
Hospitals and medical centers near Munford:
DAVITA MILLINGTON (Dialysis Facility, about 6 miles away; MILLINGTON, TN)
FMC TIPTON COUNTY (Dialysis Facility, about 7 miles away; COVINGTON, TN)
BAPTIST HOME CARE AND HOSPICE - COVINGTON (Home Health Center, about 7 miles away; COVINGTON, TN)
BAPTIST MEMORIAL HOSPITAL TIPTON Acute Care Hospitals (about 7 miles away; COVINGTON, TN)
MILLINGTON HEALTHCARE CENTER (Nursing Home, about 9 miles away; MILLINGTON, TN)
FMC MILLINGTON (Dialysis Facility, about 9 miles away; MILLINGTON, TN)
COVINGTON CARE NURSING AND REHABILITATION CENTER INC (Nursing Home, about 12 miles away; COVINGTON, TN)
MUNFORD-TIPTON MEMORIAL PUBLIC LIBRARY (Operating income: $45,148; Location: 87 COLLEGE STREET; 16,288 books; 1,787 audio materials; 640 video materials; 32 state licensed databases)
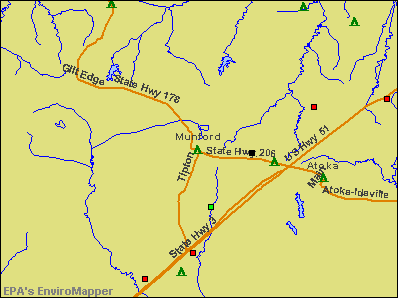
Notable locations in Munford: Munford and Atoka Fire Department Station 1 (A), Munford Memorial Library (B), Munford City Hall (C). Display/hide their locations on the map
Churches in Munford include: Munford Baptist Church (A), Munford Church of Christ (B), Munford United Methodist Church (C), Pentecost Church (D), Saint Marks Church (E), Tipton Church (F). Display/hide their locations on the map
Tipton County has a predicted average indoor radon screening level less than 2 pCi/L (pico curies per liter) - Low Potential
Drinking water stations with addresses in Munford and their reported violations in the past:
MUNFORD WATER DEPT (Population served: 8,957, Groundwater):
Past monitoring violations:
Monitoring and Reporting (DBP) - Between OCT-2006 and DEC-2006, Contaminant: Chlorine. Follow-up actions: St Compliance achieved (JAN-01-2007), St Public Notif requested (FEB-01-2007), St Violation/Reminder Notice (FEB-01-2007)
Monitoring and Reporting (DBP) - Between JUL-2005 and SEP-2005, Contaminant: TTHM. Follow-up actions: St Compliance achieved (OCT-05-2005), St Public Notif requested (OCT-28-2005), St Violation/Reminder Notice (OCT-28-2005)
Monitoring and Reporting (DBP) - Between JUL-2005 and SEP-2005, Contaminant: Total Haloacetic Acids (HAA5). Follow-up actions: St Compliance achieved (OCT-05-2005), St Public Notif requested (OCT-28-2005), St Violation/Reminder Notice (OCT-28-2005)
One routine major monitoring violation
One minor monitoring violation
Average household size:
This town:
2.7 people
Tennessee:
2.5 people
Percentage of family households:
This town:
76.7%
Whole state:
67.3%
Percentage of households with unmarried partners:
This town:
5.1%
Whole state:
5.8%
Likely homosexual households (counted as self-reported same-sex unmarried-partner households)
Lesbian couples: 0.3% of all households
Gay men: 0.1% of all households
Banks with branches in Munford (2011 data):
First Citizens National Bank: Munford Branch at 1426 Munford Avenue, branch established on 2003/06/13; Munford Drive-Thru Branch at 1483 Munford Avenue, branch established on 2003/06/13. Info updated 2006/11/03: Bank assets: $1,053.2 mil, Deposits: $856.0 mil, headquarters in Dyersburg, TN, positive income, Commercial Lending Specialization, 19 total offices, Holding Company: First Citizens Bancshares, Inc.
Regions Bank: Munford Branch at 157 South Tipton Street, branch established on 1984/08/20. Info updated 2011/02/24: Bank assets: $123,368.2 mil, Deposits: $98,301.3 mil, headquarters in Birmingham, AL, positive income, Commercial Lending Specialization, 1778 total offices, Holding Company: Regions Financial Corporation
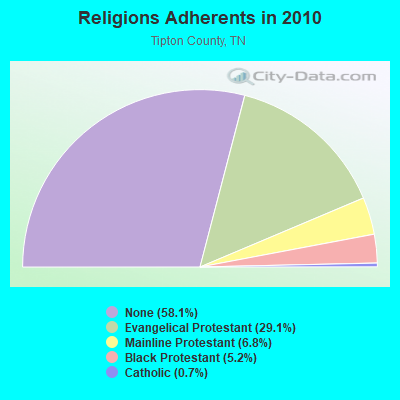
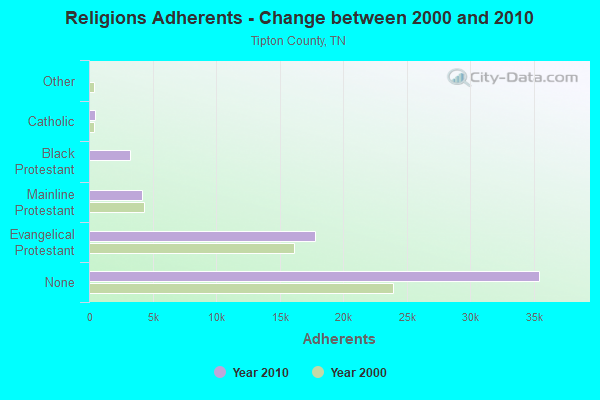
Religion statistics for Munford, TN (based on Tipton County data)
Religion
Adherents
Congregations
Evangelical Protestant
17,792
76
Mainline Protestant
4,172
20
Black Protestant
3,196
18
Catholic
450
1
Other
4
1
None
35,467
-
Source: Clifford Grammich, Kirk Hadaway, Richard Houseal, Dale E.Jones, Alexei Krindatch, Richie Stanley and Richard H.Taylor. 2012. 2010 U.S.Religion Census: Religious Congregations & Membership Study. Association of Statisticians of American Religious Bodies. Jones, Dale E., et al. 2002. Congregations and Membership in the United States 2000. Nashville, TN: Glenmary Research Center. Graphs represent county-level data
Aircraft: PIPER J3C-65 (Category: Land, Seats: 2, Weight: Up to 12,499 Pounds, Speed: 67 mph), Engine: CONT MOTOR A&C65 SERIES (65 HP) (Reciprocating) N-Number: 35702, N35702, N-35702, Serial Number: 6543, Year manufactured: 1941, Airworthiness Date: 08/27/1955 Registrant (Corporation): Mpms Inc, 99 Doctors Dr Ste 700, Munford, TN 38058
Aircraft: AERONCA 11CC (Category: Land, Seats: 2, Weight: Up to 12,499 Pounds, Speed: 75 mph), Engine: CONT MOTOR C85 SERIES (85 HP) (Reciprocating) N-Number: 4166E, N4166E, N-4166E, Serial Number: 11CC-69, Year manufactured: 1947, Airworthiness Date: 08/22/1958 Registrant (Corporation): Mpms Inc, 99 Doctors Dr Ste 700, Munford, TN 38058
Aircraft: CESSNA 182Q (Category: Land, Seats: 4, Weight: Up to 12,499 Pounds, Speed: 112 mph), Engine: CONT MOTOR O-470 SERIES (230 HP) (Reciprocating) N-Number: 759JB, N759JB, N-759JB, Serial Number: 18266968, Year manufactured: 1979, Airworthiness Date: 05/03/1979 Registrant (Corporation): Mpms Inc, 99 Doctors Dr Ste 700, Munford, TN 38058
Aircraft: MOCK MICHAEL H CHRISTEN EAGLE II (Category: Land, Seats: 2, Weight: Up to 12,499 Pounds), Engine: LYCOMING I0360 SER A&C (200 HP) (Reciprocating) N-Number: 82RM, N82RM, N-82RM, Serial Number: CE001MHM, Year manufactured: 1998, Airworthiness Date: 02/13/1998 Registrant (Corporation): Mpms Inc, 99 Doctors Dr Ste 700, Munford, TN 38058
Aircraft: PORTER STEPHEN L KITFOX SERIES 5 (Category: Land, Seats: 2, Weight: Up to 12,499 Pounds), Engine: CONT MOTOR 0-200 SERIES (100 HP) (Reciprocating) N-Number: 834SP, N834SP, N-834SP, Serial Number: S95090143, Year manufactured: 1997, Airworthiness Date: 03/19/1997, Certificate Issue Date: 10/13/2020 Registrant (Individual): Steven Paul Oneal, 595 Charles Pl, Munford, TN 38058
Home Mortgage Disclosure Act Aggregated Statistics For Year 2009 (Based on 1 partial tract)
A) FHA, FSA/RHS & VA Home Purchase Loans
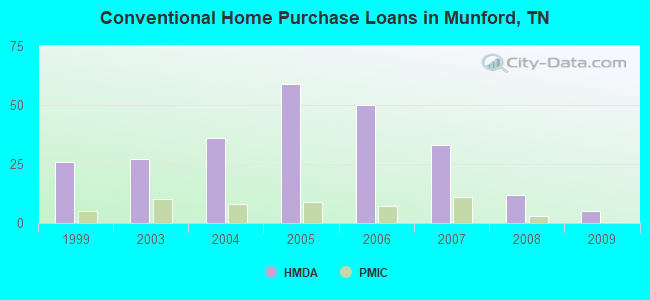
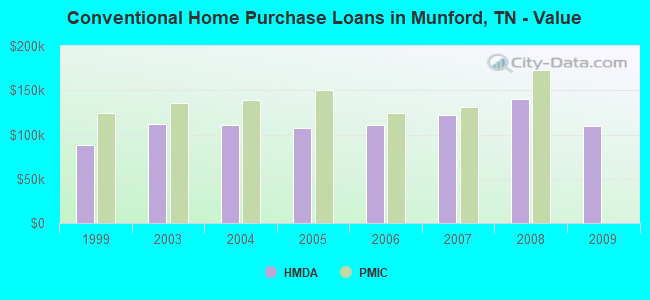
B) Conventional Home Purchase Loans
C) Refinancings
D) Home Improvement Loans
F) Non-occupant Loans on < 5 Family Dwellings (A B C & D)
G) Loans On Manufactured Home Dwelling (A B C & D)
Number
Average Value
Number
Average Value
Number
Average Value
Number
Average Value
Number
Average Value
Number
Average Value
LOANS ORIGINATED
16
$139,935
5
$109,892
41
$137,557
3
$24,630
5
$99,372
1
$42,220
APPLICATIONS APPROVED, NOT ACCEPTED
1
$58,970
0
$0
3
$127,340
0
$0
0
$0
0
$0
APPLICATIONS DENIED
2
$104,925
1
$94,090
16
$142,984
2
$30,305
1
$74,260
1
$35,490
APPLICATIONS WITHDRAWN
2
$154,790
1
$153,970
12
$143,098
1
$13,830
1
$64,430
0
$0
FILES CLOSED FOR INCOMPLETENESS
0
$0
0
$0
3
$137,833
0
$0
0
$0
0
$0
Aggregated Statistics For Year 2008 (Based on 1 partial tract)
A) FHA, FSA/RHS & VA Home Purchase Loans
B) Conventional Home Purchase Loans
C) Refinancings
D) Home Improvement Loans
F) Non-occupant Loans on < 5 Family Dwellings (A B C & D)
G) Loans On Manufactured Home Dwelling (A B C & D)
Number
Average Value
Number
Average Value
Number
Average Value
Number
Average Value
Number
Average Value
Number
Average Value
LOANS ORIGINATED
12
$155,049
12
$139,958
34
$128,802
3
$31,790
7
$102,856
2
$41,405
APPLICATIONS APPROVED, NOT ACCEPTED
1
$65,520
1
$26,750
3
$132,133
0
$0
0
$0
1
$43,130
APPLICATIONS DENIED
4
$115,205
2
$115,845
27
$128,330
3
$55,630
2
$113,660
1
$73,160
APPLICATIONS WITHDRAWN
2
$167,165
2
$147,875
7
$130,650
0
$0
1
$106,650
0
$0
FILES CLOSED FOR INCOMPLETENESS
0
$0
0
$0
1
$210,570
0
$0
0
$0
0
$0
Aggregated Statistics For Year 2007 (Based on 1 partial tract)
A) FHA, FSA/RHS & VA Home Purchase Loans
B) Conventional Home Purchase Loans
C) Refinancings
D) Home Improvement Loans
F) Non-occupant Loans on < 5 Family Dwellings (A B C & D)
G) Loans On Manufactured Home Dwelling (A B C & D)
Number
Average Value
Number
Average Value
Number
Average Value
Number
Average Value
Number
Average Value
Number
Average Value
LOANS ORIGINATED
9
$157,470
33
$121,488
37
$113,145
7
$48,074
11
$93,085
2
$66,520
APPLICATIONS APPROVED, NOT ACCEPTED
0
$0
3
$76,927
6
$113,235
1
$26,570
1
$28,760
1
$64,250
APPLICATIONS DENIED
1
$129,040
7
$98,306
33
$125,497
7
$35,516
3
$107,683
3
$59,573
APPLICATIONS WITHDRAWN
0
$0
3
$87,543
13
$119,504
0
$0
1
$119,390
0
$0
FILES CLOSED FOR INCOMPLETENESS
0
$0
1
$150,510
4
$151,015
0
$0
1
$98,640
0
$0
Aggregated Statistics For Year 2006 (Based on 1 partial tract)
A) FHA, FSA/RHS & VA Home Purchase Loans
B) Conventional Home Purchase Loans
C) Refinancings
D) Home Improvement Loans
F) Non-occupant Loans on < 5 Family Dwellings (A B C & D)
G) Loans On Manufactured Home Dwelling (A B C & D)
Number
Average Value
Number
Average Value
Number
Average Value
Number
Average Value
Number
Average Value
Number
Average Value
LOANS ORIGINATED
12
$141,702
50
$111,024
40
$105,128
8
$37,219
16
$81,672
2
$75,710
APPLICATIONS APPROVED, NOT ACCEPTED
0
$0
6
$97,522
9
$96,258
1
$17,840
2
$91,820
1
$36,220
APPLICATIONS DENIED
1
$117,210
11
$85,805
30
$109,503
4
$43,315
5
$76,512
4
$61,470
APPLICATIONS WITHDRAWN
1
$142,140
8
$106,811
13
$116,928
0
$0
2
$53,055
0
$0
FILES CLOSED FOR INCOMPLETENESS
0
$0
1
$123,760
7
$113,256
0
$0
1
$72,250
0
$0
Aggregated Statistics For Year 2005 (Based on 1 partial tract)
A) FHA, FSA/RHS & VA Home Purchase Loans
B) Conventional Home Purchase Loans
C) Refinancings
D) Home Improvement Loans
F) Non-occupant Loans on < 5 Family Dwellings (A B C & D)
G) Loans On Manufactured Home Dwelling (A B C & D)
Number
Average Value
Number
Average Value
Number
Average Value
Number
Average Value
Number
Average Value
Number
Average Value
LOANS ORIGINATED
13
$131,964
59
$107,534
49
$100,977
5
$32,360
14
$81,913
3
$31,790
APPLICATIONS APPROVED, NOT ACCEPTED
0
$0
6
$84,690
10
$115,879
2
$43,405
1
$101,920
1
$56,420
APPLICATIONS DENIED
1
$93,000
13
$67,690
43
$109,238
7
$40,950
1
$63,880
5
$59,878
APPLICATIONS WITHDRAWN
0
$0
11
$116,099
28
$121,706
1
$184,000
2
$97,735
0
$0
FILES CLOSED FOR INCOMPLETENESS
0
$0
3
$71,163
5
$84,194
0
$0
2
$35,125
0
$0
Aggregated Statistics For Year 2004 (Based on 1 partial tract)
A) FHA, FSA/RHS & VA Home Purchase Loans
B) Conventional Home Purchase Loans
C) Refinancings
D) Home Improvement Loans
F) Non-occupant Loans on < 5 Family Dwellings (A B C & D)
G) Loans On Manufactured Home Dwelling (A B C & D)
Number
Average Value
Number
Average Value
Number
Average Value
Number
Average Value
Number
Average Value
Number
Average Value
LOANS ORIGINATED
12
$127,764
36
$110,252
44
$102,114
5
$38,948
8
$71,299
2
$45,045
APPLICATIONS APPROVED, NOT ACCEPTED
0
$0
5
$98,426
10
$98,480
0
$0
1
$48,410
2
$51,960
APPLICATIONS DENIED
1
$152,520
9
$85,074
31
$100,581
5
$29,848
1
$17,110
5
$52,416
APPLICATIONS WITHDRAWN
1
$135,590
4
$112,885
21
$103,853
1
$53,510
1
$42,040
1
$61,330
FILES CLOSED FOR INCOMPLETENESS
1
$51,140
2
$91,730
4
$103,785
0
$0
0
$0
0
$0
Aggregated Statistics For Year 2003 (Based on 1 partial tract)
A) FHA, FSA/RHS & VA Home Purchase Loans
B) Conventional Home Purchase Loans
C) Refinancings
D) Home Improvement Loans
F) Non-occupant Loans on < 5 Family Dwellings (A B C & D)
Number
Average Value
Number
Average Value
Number
Average Value
Number
Average Value
Number
Average Value
LOANS ORIGINATED
12
$126,126
27
$111,350
87
$103,537
4
$27,438
9
$72,011
APPLICATIONS APPROVED, NOT ACCEPTED
0
$0
2
$87,540
11
$103,773
1
$6,370
1
$48,960
APPLICATIONS DENIED
1
$166,530
5
$81,354
39
$101,024
4
$37,310
0
$0
APPLICATIONS WITHDRAWN
1
$57,880
3
$88,817
21
$106,505
1
$89,540
1
$96,100
FILES CLOSED FOR INCOMPLETENESS
0
$0
0
$0
3
$115,267
0
$0
0
$0
Aggregated Statistics For Year 1999 (Based on 1 partial tract)
A) FHA, FSA/RHS & VA Home Purchase Loans
B) Conventional Home Purchase Loans
C) Refinancings
D) Home Improvement Loans
F) Non-occupant Loans on < 5 Family Dwellings (A B C & D)
Detailed PMIC statistics for the following Tracts:0403.01
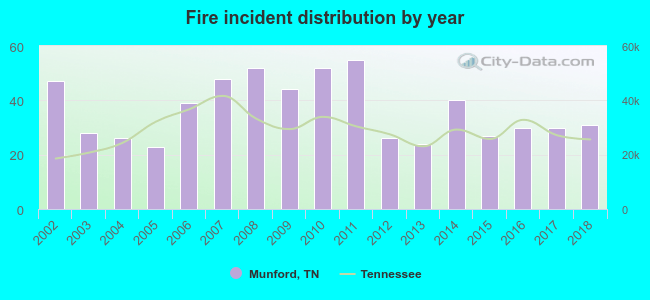
2002 - 2018 National Fire Incident Reporting System (NFIRS) incidents
According to the data from the years 2002 - 2018 the average number of fires per year is 37. The highest number of reported fires - 55 took place in 2011, and the least - 23 in 2005. The data has a declining trend.
When looking into fire subcategories, the most incidents belonged to: Outside Fires (44.5%), and Structure Fires (40.2%).
Fire incident types reported to NFIRS in Munford, TN


 Recent articles from our blog. Our writers, many of them Ph.D. graduates or candidates, create easy-to-read articles on a wide variety of topics.

 (24.4 miles


 According to the data from the years 2002 - 2018 the average number of fires per year is 37. The highest number of reported fires - 55 took place in 2011, and the least - 23 in 2005. The data has a declining trend.
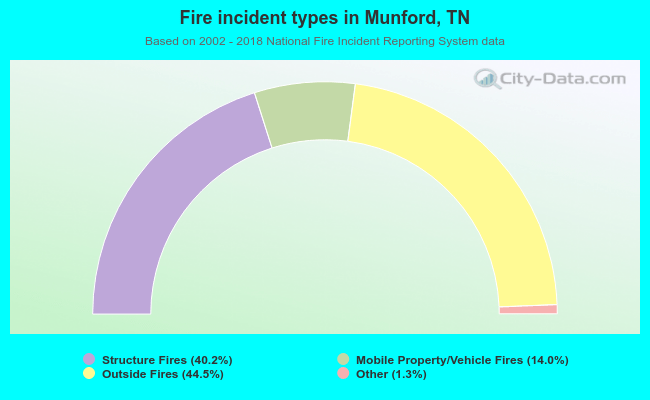 When looking into fire subcategories, the most incidents belonged to: Outside Fires (44.5%), and Structure Fires (40.2%).