Munford: Fire Incidents, Tennessee (TN)
Where are fire incidents reported in Munford, TN
Something went wrong! Please refresh the page.
|
| |||||||||||||||||||||||||||||||||||||||||||||||||||||||||||||||||||||||||||||||||||||||||||||||||||||||||||||
2002 - 2018 National Fire Incident Reporting System (NFIRS) incidents
- Incident types reported to NFIRS in Munford, TN
- 2,86253.5%Rescue & EMS
- 94117.6%Good Intent Call
- 62211.6%Fire
- 3847.2%Service Call
- 2955.5%Hazardous Condition
- 2063.9%False Alarm
- 200.4%Severe Weather
- 120.2%Overpressure Rupture
- Fire incident types reported to NFIRS in Munford, TN
- 27744.5%Outside Fires
- 25040.2%Structure Fires
- 8714.0%Mobile Property/Vehicle Fires
- 81.3%Other
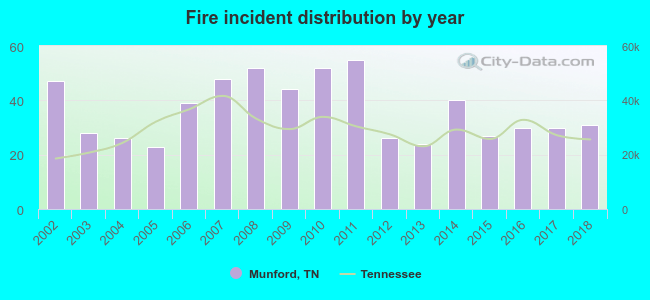 Based on the data from the years 2002 - 2018 the average number of fires per year is 37. The highest number of reported fires - 55 took place in 2011, and the least - 23 in 2005. The data has a dropping trend.
The average number of yearly fire incidents per 10k residents in Munford, TN compared to nearest cities:
(Note: Based on data for the last 3 years, including only cities with population 5,000 and above)
| Munford: | 50.1 |
| Atoka: | 78.0 |
| Millington: | 173.9 |
| Drummonds: | 38.0 |
| Covington: | 142.4 |
| Arlington: | 86.2 |
| Lakeland: | 21.0 |
| Bartlett: | 19.2 |
| Oakland: | 92.0 |
 The median response time based on all reported fire incidents is 5 minutes. This is lower than the state median value.
The median response time in Munford, TN compared to nearest cities:
(Note: Based on data for all years, including only cities with at least 500 fire incidents)
| Munford: | 5 minutes |
| Atoka: | 7 minutes |
| Brighton: | 9 minutes |
| Burlison: | 14 minutes |
| Millington: | 6 minutes |
| Covington: | 5 minutes |
| Arlington: | 6 minutes |
| Bartlett: | 5 minutes |
| Osceola: | 3 minutes |
 28.1% incidents where reported in the morning and 71.9% in the evening. The most fires (18.6%) took place on Saturday, and the least (12.4%) on Monday.
 According to the 622 fire incidents from years 2002 - 2018 most fires (11.6%) took place during January, and the least (5.8%) in October.
 Out of all 5,345 cases reported during the years 2002 - 2018, the most belonged to the categories: Rescue & EMS (53.5%), Good Intent Call (17.6%), and Fire (11.6%).
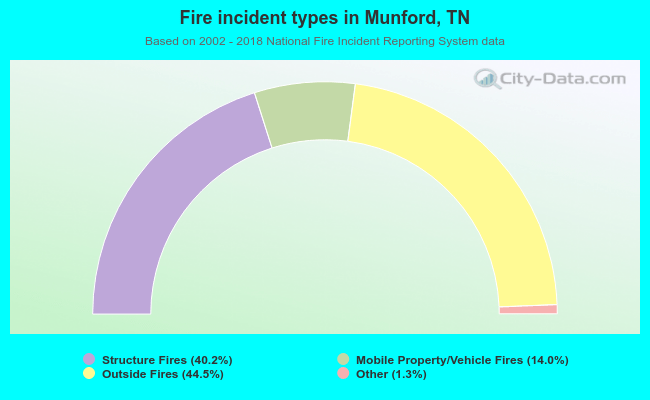 When looking into fire subcategories, the most reports belonged to: Outside Fires (44.5%), and Structure Fires (40.2%).