Cartersville, Georgia Submit your own pictures of this city and show them to the world
OSM Map
General Map
Google Map
MSN Map
OSM Map
General Map
Google Map
MSN Map
OSM Map
General Map
Google Map
MSN Map
OSM Map
General Map
Google Map
MSN Map
Please wait while loading the map...
Population in 2022: 23,904 (97% urban, 3% rural). Population change since 2000: +50.1%Males: 12,282 Females: 11,622
March 2022 cost of living index in Cartersville: 100.0 (near average, U.S. average is 100) Percentage of residents living in poverty in 2022: 12.4%for White Non-Hispanic residents , 29.3% for Black residents , 3.0% for Hispanic or Latino residents , 11.8% for two or more races residents )
Profiles of local businesses
Business Search - 14 Million verified businesses
Data:
Median household income ($)
Median household income (% change since 2000)
Household income diversity
Ratio of average income to average house value (%)
Ratio of average income to average rent
Median household income ($) - White
Median household income ($) - Black or African American
Median household income ($) - Asian
Median household income ($) - Hispanic or Latino
Median household income ($) - American Indian and Alaska Native
Median household income ($) - Multirace
Median household income ($) - Other Race
Median household income for houses/condos with a mortgage ($)
Median household income for apartments without a mortgage ($)
Races - White alone (%)
Races - White alone (% change since 2000)
Races - Black alone (%)
Races - Black alone (% change since 2000)
Races - American Indian alone (%)
Races - American Indian alone (% change since 2000)
Races - Asian alone (%)
Races - Asian alone (% change since 2000)
Races - Hispanic (%)
Races - Hispanic (% change since 2000)
Races - Native Hawaiian and Other Pacific Islander alone (%)
Races - Native Hawaiian and Other Pacific Islander alone (% change since 2000)
Races - Two or more races (%)
Races - Two or more races (% change since 2000)
Races - Other race alone (%)
Races - Other race alone (% change since 2000)
Racial diversity
Unemployment (%)
Unemployment (% change since 2000)
Unemployment (%) - White
Unemployment (%) - Black or African American
Unemployment (%) - Asian
Unemployment (%) - Hispanic or Latino
Unemployment (%) - American Indian and Alaska Native
Unemployment (%) - Multirace
Unemployment (%) - Other Race
Population density (people per square mile)
Population - Males (%)
Population - Females (%)
Population - Males (%) - White
Population - Males (%) - Black or African American
Population - Males (%) - Asian
Population - Males (%) - Hispanic or Latino
Population - Males (%) - American Indian and Alaska Native
Population - Males (%) - Multirace
Population - Males (%) - Other Race
Population - Females (%) - White
Population - Females (%) - Black or African American
Population - Females (%) - Asian
Population - Females (%) - Hispanic or Latino
Population - Females (%) - American Indian and Alaska Native
Population - Females (%) - Multirace
Population - Females (%) - Other Race
Coronavirus confirmed cases (Jun 05, 2024)
Deaths caused by coronavirus (Jun 05, 2024)
Coronavirus confirmed cases (per 100k population) (Jun 05, 2024)
Deaths caused by coronavirus (per 100k population) (Jun 05, 2024)
Daily increase in number of cases (Jun 05, 2024)
Weekly increase in number of cases (Jun 05, 2024)
Cases doubled (in days) (Jun 05, 2024)
Hospitalized patients (Apr 18, 2022)
Negative test results (Apr 18, 2022)
Total test results (Apr 18, 2022)
COVID Vaccine doses distributed (per 100k population) (Sep 19, 2023)
COVID Vaccine doses administered (per 100k population) (Sep 19, 2023)
COVID Vaccine doses distributed (Sep 19, 2023)
COVID Vaccine doses administered (Sep 19, 2023)
Likely homosexual households (%)
Likely homosexual households (% change since 2000)
Likely homosexual households - Lesbian couples (%)
Likely homosexual households - Lesbian couples (% change since 2000)
Likely homosexual households - Gay men (%)
Likely homosexual households - Gay men (% change since 2000)
Cost of living index
Median gross rent ($)
Median contract rent ($)
Median monthly housing costs ($)
Median house or condo value ($)
Median house or condo value ($ change since 2000)
Mean house or condo value by units in structure - 1, detached ($)
Mean house or condo value by units in structure - 1, attached ($)
Mean house or condo value by units in structure - 2 ($)
Mean house or condo value by units in structure by units in structure - 3 or 4 ($)
Mean house or condo value by units in structure - 5 or more ($)
Mean house or condo value by units in structure - Boat, RV, van, etc. ($)
Mean house or condo value by units in structure - Mobile home ($)
Median house or condo value ($) - White
Median house or condo value ($) - Black or African American
Median house or condo value ($) - Asian
Median house or condo value ($) - Hispanic or Latino
Median house or condo value ($) - American Indian and Alaska Native
Median house or condo value ($) - Multirace
Median house or condo value ($) - Other Race
Median resident age
Resident age diversity
Median resident age - Males
Median resident age - Females
Median resident age - White
Median resident age - Black or African American
Median resident age - Asian
Median resident age - Hispanic or Latino
Median resident age - American Indian and Alaska Native
Median resident age - Multirace
Median resident age - Other Race
Median resident age - Males - White
Median resident age - Males - Black or African American
Median resident age - Males - Asian
Median resident age - Males - Hispanic or Latino
Median resident age - Males - American Indian and Alaska Native
Median resident age - Males - Multirace
Median resident age - Males - Other Race
Median resident age - Females - White
Median resident age - Females - Black or African American
Median resident age - Females - Asian
Median resident age - Females - Hispanic or Latino
Median resident age - Females - American Indian and Alaska Native
Median resident age - Females - Multirace
Median resident age - Females - Other Race
Commute - mean travel time to work (minutes)
Travel time to work - Less than 5 minutes (%)
Travel time to work - Less than 5 minutes (% change since 2000)
Travel time to work - 5 to 9 minutes (%)
Travel time to work - 5 to 9 minutes (% change since 2000)
Travel time to work - 10 to 19 minutes (%)
Travel time to work - 10 to 19 minutes (% change since 2000)
Travel time to work - 20 to 29 minutes (%)
Travel time to work - 20 to 29 minutes (% change since 2000)
Travel time to work - 30 to 39 minutes (%)
Travel time to work - 30 to 39 minutes (% change since 2000)
Travel time to work - 40 to 59 minutes (%)
Travel time to work - 40 to 59 minutes (% change since 2000)
Travel time to work - 60 to 89 minutes (%)
Travel time to work - 60 to 89 minutes (% change since 2000)
Travel time to work - 90 or more minutes (%)
Travel time to work - 90 or more minutes (% change since 2000)
Marital status - Never married (%)
Marital status - Now married (%)
Marital status - Separated (%)
Marital status - Widowed (%)
Marital status - Divorced (%)
Median family income ($)
Median family income (% change since 2000)
Median non-family income ($)
Median non-family income (% change since 2000)
Median per capita income ($)
Median per capita income (% change since 2000)
Median family income ($) - White
Median family income ($) - Black or African American
Median family income ($) - Asian
Median family income ($) - Hispanic or Latino
Median family income ($) - American Indian and Alaska Native
Median family income ($) - Multirace
Median family income ($) - Other Race
Median year house/condo built
Median year apartment built
Year house built - Built 2005 or later (%)
Year house built - Built 2000 to 2004 (%)
Year house built - Built 1990 to 1999 (%)
Year house built - Built 1980 to 1989 (%)
Year house built - Built 1970 to 1979 (%)
Year house built - Built 1960 to 1969 (%)
Year house built - Built 1950 to 1959 (%)
Year house built - Built 1940 to 1949 (%)
Year house built - Built 1939 or earlier (%)
Average household size
Household density (households per square mile)
Average household size - White
Average household size - Black or African American
Average household size - Asian
Average household size - Hispanic or Latino
Average household size - American Indian and Alaska Native
Average household size - Multirace
Average household size - Other Race
Occupied housing units (%)
Vacant housing units (%)
Owner occupied housing units (%)
Renter occupied housing units (%)
Vacancy status - For rent (%)
Vacancy status - For sale only (%)
Vacancy status - Rented or sold, not occupied (%)
Vacancy status - For seasonal, recreational, or occasional use (%)
Vacancy status - For migrant workers (%)
Vacancy status - Other vacant (%)
Residents with income below the poverty level (%)
Residents with income below 50% of the poverty level (%)
Children below poverty level (%)
Poor families by family type - Married-couple family (%)
Poor families by family type - Male, no wife present (%)
Poor families by family type - Female, no husband present (%)
Poverty status for native-born residents (%)
Poverty status for foreign-born residents (%)
Poverty among high school graduates not in families (%)
Poverty among people who did not graduate high school not in families (%)
Residents with income below the poverty level (%) - White
Residents with income below the poverty level (%) - Black or African American
Residents with income below the poverty level (%) - Asian
Residents with income below the poverty level (%) - Hispanic or Latino
Residents with income below the poverty level (%) - American Indian and Alaska Native
Residents with income below the poverty level (%) - Multirace
Residents with income below the poverty level (%) - Other Race
Air pollution - Air Quality Index (AQI)
Air pollution - CO
Air pollution - NO2
Air pollution - SO2
Air pollution - Ozone
Air pollution - PM10
Air pollution - PM25
Air pollution - Pb
Crime - Murders per 100,000 population
Crime - Rapes per 100,000 population
Crime - Robberies per 100,000 population
Crime - Assaults per 100,000 population
Crime - Burglaries per 100,000 population
Crime - Thefts per 100,000 population
Crime - Auto thefts per 100,000 population
Crime - Arson per 100,000 population
Crime - City-data.com crime index
Crime - Violent crime index
Crime - Property crime index
Crime - Murders per 100,000 population (5 year average)
Crime - Rapes per 100,000 population (5 year average)
Crime - Robberies per 100,000 population (5 year average)
Crime - Assaults per 100,000 population (5 year average)
Crime - Burglaries per 100,000 population (5 year average)
Crime - Thefts per 100,000 population (5 year average)
Crime - Auto thefts per 100,000 population (5 year average)
Crime - Arson per 100,000 population (5 year average)
Crime - City-data.com crime index (5 year average)
Crime - Violent crime index (5 year average)
Crime - Property crime index (5 year average)
1996 Presidential Elections Results (%) - Democratic Party (Clinton)
1996 Presidential Elections Results (%) - Republican Party (Dole)
1996 Presidential Elections Results (%) - Other
2000 Presidential Elections Results (%) - Democratic Party (Gore)
2000 Presidential Elections Results (%) - Republican Party (Bush)
2000 Presidential Elections Results (%) - Other
2004 Presidential Elections Results (%) - Democratic Party (Kerry)
2004 Presidential Elections Results (%) - Republican Party (Bush)
2004 Presidential Elections Results (%) - Other
2008 Presidential Elections Results (%) - Democratic Party (Obama)
2008 Presidential Elections Results (%) - Republican Party (McCain)
2008 Presidential Elections Results (%) - Other
2012 Presidential Elections Results (%) - Democratic Party (Obama)
2012 Presidential Elections Results (%) - Republican Party (Romney)
2012 Presidential Elections Results (%) - Other
2016 Presidential Elections Results (%) - Democratic Party (Clinton)
2016 Presidential Elections Results (%) - Republican Party (Trump)
2016 Presidential Elections Results (%) - Other
2020 Presidential Elections Results (%) - Democratic Party (Biden)
2020 Presidential Elections Results (%) - Republican Party (Trump)
2020 Presidential Elections Results (%) - Other
Ancestries Reported - Arab (%)
Ancestries Reported - Czech (%)
Ancestries Reported - Danish (%)
Ancestries Reported - Dutch (%)
Ancestries Reported - English (%)
Ancestries Reported - French (%)
Ancestries Reported - French Canadian (%)
Ancestries Reported - German (%)
Ancestries Reported - Greek (%)
Ancestries Reported - Hungarian (%)
Ancestries Reported - Irish (%)
Ancestries Reported - Italian (%)
Ancestries Reported - Lithuanian (%)
Ancestries Reported - Norwegian (%)
Ancestries Reported - Polish (%)
Ancestries Reported - Portuguese (%)
Ancestries Reported - Russian (%)
Ancestries Reported - Scotch-Irish (%)
Ancestries Reported - Scottish (%)
Ancestries Reported - Slovak (%)
Ancestries Reported - Subsaharan African (%)
Ancestries Reported - Swedish (%)
Ancestries Reported - Swiss (%)
Ancestries Reported - Ukrainian (%)
Ancestries Reported - United States (%)
Ancestries Reported - Welsh (%)
Ancestries Reported - West Indian (%)
Ancestries Reported - Other (%)
Educational Attainment - No schooling completed (%)
Educational Attainment - Less than high school (%)
Educational Attainment - High school or equivalent (%)
Educational Attainment - Less than 1 year of college (%)
Educational Attainment - 1 or more years of college (%)
Educational Attainment - Associate degree (%)
Educational Attainment - Bachelor's degree (%)
Educational Attainment - Master's degree (%)
Educational Attainment - Professional school degree (%)
Educational Attainment - Doctorate degree (%)
School Enrollment - Nursery, preschool (%)
School Enrollment - Kindergarten (%)
School Enrollment - Grade 1 to 4 (%)
School Enrollment - Grade 5 to 8 (%)
School Enrollment - Grade 9 to 12 (%)
School Enrollment - College undergrad (%)
School Enrollment - Graduate or professional (%)
School Enrollment - Not enrolled in school (%)
School enrollment - Public schools (%)
School enrollment - Private schools (%)
School enrollment - Not enrolled (%)
Median number of rooms in houses and condos
Median number of rooms in apartments
Housing units lacking complete plumbing facilities (%)
Housing units lacking complete kitchen facilities (%)
Density of houses
Urban houses (%)
Rural houses (%)
Households with people 60 years and over (%)
Households with people 65 years and over (%)
Households with people 75 years and over (%)
Households with one or more nonrelatives (%)
Households with no nonrelatives (%)
Population in households (%)
Family households (%)
Nonfamily households (%)
Population in families (%)
Family households with own children (%)
Median number of bedrooms in owner occupied houses
Mean number of bedrooms in owner occupied houses
Median number of bedrooms in renter occupied houses
Mean number of bedrooms in renter occupied houses
Median number of vehichles in owner occupied houses
Mean number of vehichles in owner occupied houses
Median number of vehichles in renter occupied houses
Mean number of vehichles in renter occupied houses
Mortgage status - with mortgage (%)
Mortgage status - with second mortgage (%)
Mortgage status - with home equity loan (%)
Mortgage status - with both second mortgage and home equity loan (%)
Mortgage status - without a mortgage (%)
Average family size
Average family size - White
Average family size - Black or African American
Average family size - Asian
Average family size - Hispanic or Latino
Average family size - American Indian and Alaska Native
Average family size - Multirace
Average family size - Other Race
Geographical mobility - Same house 1 year ago (%)
Geographical mobility - Moved within same county (%)
Geographical mobility - Moved from different county within same state (%)
Geographical mobility - Moved from different state (%)
Geographical mobility - Moved from abroad (%)
Place of birth - Born in state of residence (%)
Place of birth - Born in other state (%)
Place of birth - Native, outside of US (%)
Place of birth - Foreign born (%)
Housing units in structures - 1, detached (%)
Housing units in structures - 1, attached (%)
Housing units in structures - 2 (%)
Housing units in structures - 3 or 4 (%)
Housing units in structures - 5 to 9 (%)
Housing units in structures - 10 to 19 (%)
Housing units in structures - 20 to 49 (%)
Housing units in structures - 50 or more (%)
Housing units in structures - Mobile home (%)
Housing units in structures - Boat, RV, van, etc. (%)
House/condo owner moved in on average (years ago)
Renter moved in on average (years ago)
Year householder moved into unit - Moved in 1999 to March 2000 (%)
Year householder moved into unit - Moved in 1995 to 1998 (%)
Year householder moved into unit - Moved in 1990 to 1994 (%)
Year householder moved into unit - Moved in 1980 to 1989 (%)
Year householder moved into unit - Moved in 1970 to 1979 (%)
Year householder moved into unit - Moved in 1969 or earlier (%)
Means of transportation to work - Drove car alone (%)
Means of transportation to work - Carpooled (%)
Means of transportation to work - Public transportation (%)
Means of transportation to work - Bus or trolley bus (%)
Means of transportation to work - Streetcar or trolley car (%)
Means of transportation to work - Subway or elevated (%)
Means of transportation to work - Railroad (%)
Means of transportation to work - Ferryboat (%)
Means of transportation to work - Taxicab (%)
Means of transportation to work - Motorcycle (%)
Means of transportation to work - Bicycle (%)
Means of transportation to work - Walked (%)
Means of transportation to work - Other means (%)
Working at home (%)
Industry diversity
Most Common Industries - Agriculture, forestry, fishing and hunting, and mining (%)
Most Common Industries - Agriculture, forestry, fishing and hunting (%)
Most Common Industries - Mining, quarrying, and oil and gas extraction (%)
Most Common Industries - Construction (%)
Most Common Industries - Manufacturing (%)
Most Common Industries - Wholesale trade (%)
Most Common Industries - Retail trade (%)
Most Common Industries - Transportation and warehousing, and utilities (%)
Most Common Industries - Transportation and warehousing (%)
Most Common Industries - Utilities (%)
Most Common Industries - Information (%)
Most Common Industries - Finance and insurance, and real estate and rental and leasing (%)
Most Common Industries - Finance and insurance (%)
Most Common Industries - Real estate and rental and leasing (%)
Most Common Industries - Professional, scientific, and management, and administrative and waste management services (%)
Most Common Industries - Professional, scientific, and technical services (%)
Most Common Industries - Management of companies and enterprises (%)
Most Common Industries - Administrative and support and waste management services (%)
Most Common Industries - Educational services, and health care and social assistance (%)
Most Common Industries - Educational services (%)
Most Common Industries - Health care and social assistance (%)
Most Common Industries - Arts, entertainment, and recreation, and accommodation and food services (%)
Most Common Industries - Arts, entertainment, and recreation (%)
Most Common Industries - Accommodation and food services (%)
Most Common Industries - Other services, except public administration (%)
Most Common Industries - Public administration (%)
Occupation diversity
Most Common Occupations - Management, business, science, and arts occupations (%)
Most Common Occupations - Management, business, and financial occupations (%)
Most Common Occupations - Management occupations (%)
Most Common Occupations - Business and financial operations occupations (%)
Most Common Occupations - Computer, engineering, and science occupations (%)
Most Common Occupations - Computer and mathematical occupations (%)
Most Common Occupations - Architecture and engineering occupations (%)
Most Common Occupations - Life, physical, and social science occupations (%)
Most Common Occupations - Education, legal, community service, arts, and media occupations (%)
Most Common Occupations - Community and social service occupations (%)
Most Common Occupations - Legal occupations (%)
Most Common Occupations - Education, training, and library occupations (%)
Most Common Occupations - Arts, design, entertainment, sports, and media occupations (%)
Most Common Occupations - Healthcare practitioners and technical occupations (%)
Most Common Occupations - Health diagnosing and treating practitioners and other technical occupations (%)
Most Common Occupations - Health technologists and technicians (%)
Most Common Occupations - Service occupations (%)
Most Common Occupations - Healthcare support occupations (%)
Most Common Occupations - Protective service occupations (%)
Most Common Occupations - Fire fighting and prevention, and other protective service workers including supervisors (%)
Most Common Occupations - Law enforcement workers including supervisors (%)
Most Common Occupations - Food preparation and serving related occupations (%)
Most Common Occupations - Building and grounds cleaning and maintenance occupations (%)
Most Common Occupations - Personal care and service occupations (%)
Most Common Occupations - Sales and office occupations (%)
Most Common Occupations - Sales and related occupations (%)
Most Common Occupations - Office and administrative support occupations (%)
Most Common Occupations - Natural resources, construction, and maintenance occupations (%)
Most Common Occupations - Farming, fishing, and forestry occupations (%)
Most Common Occupations - Construction and extraction occupations (%)
Most Common Occupations - Installation, maintenance, and repair occupations (%)
Most Common Occupations - Production, transportation, and material moving occupations (%)
Most Common Occupations - Production occupations (%)
Most Common Occupations - Transportation occupations (%)
Most Common Occupations - Material moving occupations (%)
People in Group quarters - Institutionalized population (%)
People in Group quarters - Correctional institutions (%)
People in Group quarters - Federal prisons and detention centers (%)
People in Group quarters - Halfway houses (%)
People in Group quarters - Local jails and other confinement facilities (including police lockups) (%)
People in Group quarters - Military disciplinary barracks (%)
People in Group quarters - State prisons (%)
People in Group quarters - Other types of correctional institutions (%)
People in Group quarters - Nursing homes (%)
People in Group quarters - Hospitals/wards, hospices, and schools for the handicapped (%)
People in Group quarters - Hospitals/wards and hospices for chronically ill (%)
People in Group quarters - Hospices or homes for chronically ill (%)
People in Group quarters - Military hospitals or wards for chronically ill (%)
People in Group quarters - Other hospitals or wards for chronically ill (%)
People in Group quarters - Hospitals or wards for drug/alcohol abuse (%)
People in Group quarters - Mental (Psychiatric) hospitals or wards (%)
People in Group quarters - Schools, hospitals, or wards for the mentally retarded (%)
People in Group quarters - Schools, hospitals, or wards for the physically handicapped (%)
People in Group quarters - Institutions for the deaf (%)
People in Group quarters - Institutions for the blind (%)
People in Group quarters - Orthopedic wards and institutions for the physically handicapped (%)
People in Group quarters - Wards in general hospitals for patients who have no usual home elsewhere (%)
People in Group quarters - Wards in military hospitals for patients who have no usual home elsewhere (%)
People in Group quarters - Juvenile institutions (%)
People in Group quarters - Long-term care (%)
People in Group quarters - Homes for abused, dependent, and neglected children (%)
People in Group quarters - Residential treatment centers for emotionally disturbed children (%)
People in Group quarters - Training schools for juvenile delinquents (%)
People in Group quarters - Short-term care, detention or diagnostic centers for delinquent children (%)
People in Group quarters - Type of juvenile institution unknown (%)
People in Group quarters - Noninstitutionalized population (%)
People in Group quarters - College dormitories (includes college quarters off campus) (%)
People in Group quarters - Military quarters (%)
People in Group quarters - On base (%)
People in Group quarters - Barracks, unaccompanied personnel housing (UPH), (Enlisted/Officer), ;and similar group living quarters for military personnel (%)
People in Group quarters - Transient quarters for temporary residents (%)
People in Group quarters - Military ships (%)
People in Group quarters - Group homes (%)
People in Group quarters - Homes or halfway houses for drug/alcohol abuse (%)
People in Group quarters - Homes for the mentally ill (%)
People in Group quarters - Homes for the mentally retarded (%)
People in Group quarters - Homes for the physically handicapped (%)
People in Group quarters - Other group homes (%)
People in Group quarters - Religious group quarters (%)
People in Group quarters - Dormitories (%)
People in Group quarters - Agriculture workers' dormitories on farms (%)
People in Group quarters - Job Corps and vocational training facilities (%)
People in Group quarters - Other workers' dormitories (%)
People in Group quarters - Crews of maritime vessels (%)
People in Group quarters - Other nonhousehold living situations (%)
People in Group quarters - Other noninstitutional group quarters (%)
Residents speaking English at home (%)
Residents speaking English at home - Born in the United States (%)
Residents speaking English at home - Native, born elsewhere (%)
Residents speaking English at home - Foreign born (%)
Residents speaking Spanish at home (%)
Residents speaking Spanish at home - Born in the United States (%)
Residents speaking Spanish at home - Native, born elsewhere (%)
Residents speaking Spanish at home - Foreign born (%)
Residents speaking other language at home (%)
Residents speaking other language at home - Born in the United States (%)
Residents speaking other language at home - Native, born elsewhere (%)
Residents speaking other language at home - Foreign born (%)
Class of Workers - Employee of private company (%)
Class of Workers - Self-employed in own incorporated business (%)
Class of Workers - Private not-for-profit wage and salary workers (%)
Class of Workers - Local government workers (%)
Class of Workers - State government workers (%)
Class of Workers - Federal government workers (%)
Class of Workers - Self-employed workers in own not incorporated business and Unpaid family workers (%)
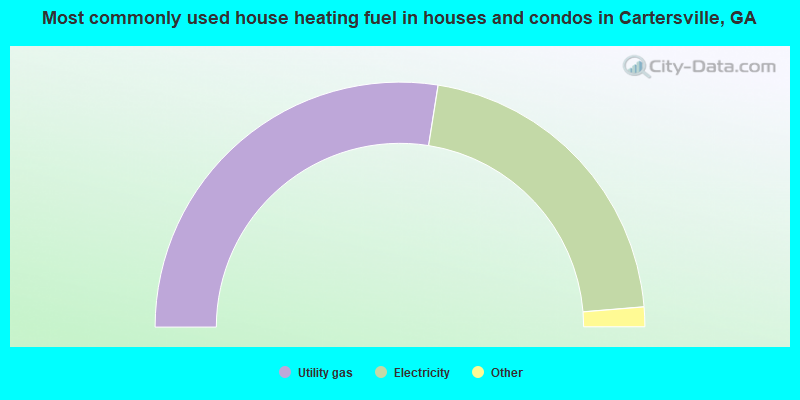
House heating fuel used in houses and condos - Utility gas (%)
House heating fuel used in houses and condos - Bottled, tank, or LP gas (%)
House heating fuel used in houses and condos - Electricity (%)
House heating fuel used in houses and condos - Fuel oil, kerosene, etc. (%)
House heating fuel used in houses and condos - Coal or coke (%)
House heating fuel used in houses and condos - Wood (%)
House heating fuel used in houses and condos - Solar energy (%)
House heating fuel used in houses and condos - Other fuel (%)
House heating fuel used in houses and condos - No fuel used (%)
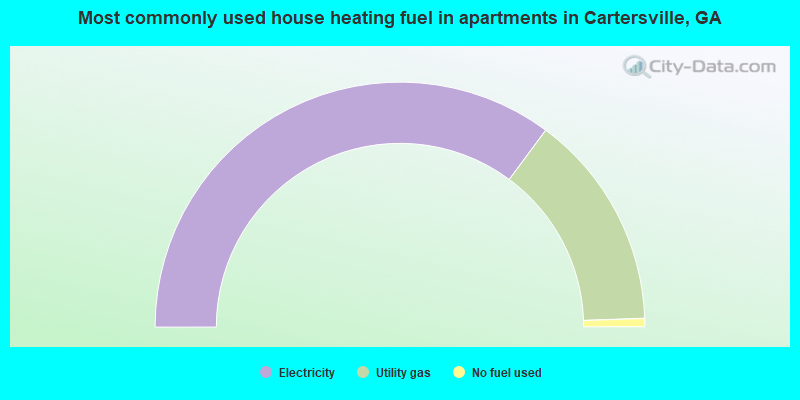
House heating fuel used in apartments - Utility gas (%)
House heating fuel used in apartments - Bottled, tank, or LP gas (%)
House heating fuel used in apartments - Electricity (%)
House heating fuel used in apartments - Fuel oil, kerosene, etc. (%)
House heating fuel used in apartments - Coal or coke (%)
House heating fuel used in apartments - Wood (%)
House heating fuel used in apartments - Solar energy (%)
House heating fuel used in apartments - Other fuel (%)
House heating fuel used in apartments - No fuel used (%)
Armed forces status - In Armed Forces (%)
Armed forces status - Civilian (%)
Armed forces status - Civilian - Veteran (%)
Armed forces status - Civilian - Nonveteran (%)
Fatal accidents locations in years 2005-2021
Fatal accidents locations in 2005
Fatal accidents locations in 2006
Fatal accidents locations in 2007
Fatal accidents locations in 2008
Fatal accidents locations in 2009
Fatal accidents locations in 2010
Fatal accidents locations in 2011
Fatal accidents locations in 2012
Fatal accidents locations in 2013
Fatal accidents locations in 2014
Fatal accidents locations in 2015
Fatal accidents locations in 2016
Fatal accidents locations in 2017
Fatal accidents locations in 2018
Fatal accidents locations in 2019
Fatal accidents locations in 2020
Fatal accidents locations in 2021
Alcohol use - People drinking some alcohol every month (%)
Alcohol use - People not drinking at all (%)
Alcohol use - Average days/month drinking alcohol
Alcohol use - Average drinks/week
Alcohol use - Average days/year people drink much
Audiometry - Average condition of hearing (%)
Audiometry - People that can hear a whisper from across a quiet room (%)
Audiometry - People that can hear normal voice from across a quiet room (%)
Audiometry - Ears ringing, roaring, buzzing (%)
Audiometry - Had a job exposure to loud noise (%)
Audiometry - Had off-work exposure to loud noise (%)
Blood Pressure & Cholesterol - Has high blood pressure (%)
Blood Pressure & Cholesterol - Checking blood pressure at home (%)
Blood Pressure & Cholesterol - Frequently checking blood cholesterol (%)
Blood Pressure & Cholesterol - Has high cholesterol level (%)
Consumer Behavior - Money monthly spent on food at supermarket/grocery store
Consumer Behavior - Money monthly spent on food at other stores
Consumer Behavior - Money monthly spent on eating out
Consumer Behavior - Money monthly spent on carryout/delivered foods
Consumer Behavior - Income spent on food at supermarket/grocery store (%)
Consumer Behavior - Income spent on food at other stores (%)
Consumer Behavior - Income spent on eating out (%)
Consumer Behavior - Income spent on carryout/delivered foods (%)
Current Health Status - General health condition (%)
Current Health Status - Blood donors (%)
Current Health Status - Has blood ever tested for HIV virus (%)
Current Health Status - Left-handed people (%)
Dermatology - People using sunscreen (%)
Diabetes - Diabetics (%)
Diabetes - Had a blood test for high blood sugar (%)
Diabetes - People taking insulin (%)
Diet Behavior & Nutrition - Diet health (%)
Diet Behavior & Nutrition - Milk product consumption (# of products/month)
Diet Behavior & Nutrition - Meals not home prepared (#/week)
Diet Behavior & Nutrition - Meals from fast food or pizza place (#/week)
Diet Behavior & Nutrition - Ready-to-eat foods (#/month)
Diet Behavior & Nutrition - Frozen meals/pizza (#/month)
Drug Use - People that ever used marijuana or hashish (%)
Drug Use - Ever used hard drugs (%)
Drug Use - Ever used any form of cocaine (%)
Drug Use - Ever used heroin (%)
Drug Use - Ever used methamphetamine (%)
Health Insurance - People covered by health insurance (%)
Kidney Conditions-Urology - Avg. # of times urinating at night
Medical Conditions - People with asthma (%)
Medical Conditions - People with anemia (%)
Medical Conditions - People with psoriasis (%)
Medical Conditions - People with overweight (%)
Medical Conditions - Elderly people having difficulties in thinking or remembering (%)
Medical Conditions - People who ever received blood transfusion (%)
Medical Conditions - People having trouble seeing even with glass/contacts (%)
Medical Conditions - People with arthritis (%)
Medical Conditions - People with gout (%)
Medical Conditions - People with congestive heart failure (%)
Medical Conditions - People with coronary heart disease (%)
Medical Conditions - People with angina pectoris (%)
Medical Conditions - People who ever had heart attack (%)
Medical Conditions - People who ever had stroke (%)
Medical Conditions - People with emphysema (%)
Medical Conditions - People with thyroid problem (%)
Medical Conditions - People with chronic bronchitis (%)
Medical Conditions - People with any liver condition (%)
Medical Conditions - People who ever had cancer or malignancy (%)
Mental Health - People who have little interest in doing things (%)
Mental Health - People feeling down, depressed, or hopeless (%)
Mental Health - People who have trouble sleeping or sleeping too much (%)
Mental Health - People feeling tired or having little energy (%)
Mental Health - People with poor appetite or overeating (%)
Mental Health - People feeling bad about themself (%)
Mental Health - People who have trouble concentrating on things (%)
Mental Health - People moving or speaking slowly or too fast (%)
Mental Health - People having thoughts they would be better off dead (%)
Oral Health - Average years since last visit a dentist
Oral Health - People embarrassed because of mouth (%)
Oral Health - People with gum disease (%)
Oral Health - General health of teeth and gums (%)
Oral Health - Average days a week using dental floss/device
Oral Health - Average days a week using mouthwash for dental problem
Oral Health - Average number of teeth
Pesticide Use - Households using pesticides to control insects (%)
Pesticide Use - Households using pesticides to kill weeds (%)
Physical Activity - People doing vigorous-intensity work activities (%)
Physical Activity - People doing moderate-intensity work activities (%)
Physical Activity - People walking or bicycling (%)
Physical Activity - People doing vigorous-intensity recreational activities (%)
Physical Activity - People doing moderate-intensity recreational activities (%)
Physical Activity - Average hours a day doing sedentary activities
Physical Activity - Average hours a day watching TV or videos
Physical Activity - Average hours a day using computer
Physical Functioning - People having limitations keeping them from working (%)
Physical Functioning - People limited in amount of work they can do (%)
Physical Functioning - People that need special equipment to walk (%)
Physical Functioning - People experiencing confusion/memory problems (%)
Physical Functioning - People requiring special healthcare equipment (%)
Prescription Medications - Average number of prescription medicines taking
Preventive Aspirin Use - Adults 40+ taking low-dose aspirin (%)
Reproductive Health - Vaginal deliveries (%)
Reproductive Health - Cesarean deliveries (%)
Reproductive Health - Deliveries resulted in a live birth (%)
Reproductive Health - Pregnancies resulted in a delivery (%)
Reproductive Health - Women breastfeeding newborns (%)
Reproductive Health - Women that had a hysterectomy (%)
Reproductive Health - Women that had both ovaries removed (%)
Reproductive Health - Women that have ever taken birth control pills (%)
Reproductive Health - Women taking birth control pills (%)
Reproductive Health - Women that have ever used Depo-Provera or injectables (%)
Reproductive Health - Women that have ever used female hormones (%)
Sexual Behavior - People 18+ that ever had sex (vaginal, anal, or oral) (%)
Sexual Behavior - Males 18+ that ever had vaginal sex with a woman (%)
Sexual Behavior - Males 18+ that ever performed oral sex on a woman (%)
Sexual Behavior - Males 18+ that ever had anal sex with a woman (%)
Sexual Behavior - Males 18+ that ever had any sex with a man (%)
Sexual Behavior - Females 18+ that ever had vaginal sex with a man (%)
Sexual Behavior - Females 18+ that ever performed oral sex on a man (%)
Sexual Behavior - Females 18+ that ever had anal sex with a man (%)
Sexual Behavior - Females 18+ that ever had any kind of sex with a woman (%)
Sexual Behavior - Average age people first had sex
Sexual Behavior - Average number of female sex partners in lifetime (males 18+)
Sexual Behavior - Average number of female vaginal sex partners in lifetime (males 18+)
Sexual Behavior - Average age people first performed oral sex on a woman (18+)
Sexual Behavior - Average number of woman performed oral sex on in lifetime (18+)
Sexual Behavior - Average number of male sex partners in lifetime (males 18+)
Sexual Behavior - Average number of male anal sex partners in lifetime (males 18+)
Sexual Behavior - Average age people first performed oral sex on a man (18+)
Sexual Behavior - Average number of male oral sex partners in lifetime (18+)
Sexual Behavior - People using protection when performing oral sex (%)
Sexual Behavior - Average number of times people have vaginal or anal sex a year
Sexual Behavior - People having sex without condom (%)
Sexual Behavior - Average number of male sex partners in lifetime (females 18+)
Sexual Behavior - Average number of male vaginal sex partners in lifetime (females 18+)
Sexual Behavior - Average number of female sex partners in lifetime (females 18+)
Sexual Behavior - Circumcised males 18+ (%)
Sleep Disorders - Average hours sleeping at night
Sleep Disorders - People that has trouble sleeping (%)
Smoking-Cigarette Use - People smoking cigarettes (%)
Taste & Smell - People 40+ having problems with smell (%)
Taste & Smell - People 40+ having problems with taste (%)
Taste & Smell - People 40+ that ever had wisdom teeth removed (%)
Taste & Smell - People 40+ that ever had tonsils teeth removed (%)
Taste & Smell - People 40+ that ever had a loss of consciousness because of a head injury (%)
Taste & Smell - People 40+ that ever had a broken nose or other serious injury to face or skull (%)
Taste & Smell - People 40+ that ever had two or more sinus infections (%)
Weight - Average height (inches)
Weight - Average weight (pounds)
Weight - Average BMI
Weight - People that are obese (%)
Weight - People that ever were obese (%)
Weight - People trying to lose weight (%)
Officers per 1,000 residents here:
1.98Georgia average:
2.45
Latest news from Cartersville, GA collected exclusively by city-data.com from local newspapers, TV, and radio stations
Ancestries: American (19.5%), English (11.3%), Italian (6.6%), German (5.5%), Irish (4.3%), European (2.3%).
Current Local Time:
Land area: 23.4 square miles.
Population density: 1,022 people per square mile (low).
1,441 residents are foreign born (5.0% Latin America ).
This city:
6.0%Georgia:
10.4%
Median real estate property taxes paid for housing units with mortgages in 2022: $2,894 (0.8%)Median real estate property taxes paid for housing units with no mortgage in 2022: $2,085 (0.7%)
Nearest city with pop. 50,000+: Marietta, GA
Nearest city with pop. 200,000+: Atlanta, GA
Nearest city with pop. 1,000,000+: Chicago, IL
Nearest cities:
Latitude: 34.18 N, Longitude: 84.80 W
Daytime population change due to commuting: +8,292 (+34.8%)Workers who live and work in this city: 6,010 (48.7%)
Cartersville tourist attractions:
Single-family new house construction building permits:
2022: 124 buildings , average cost: $359,1002021: 95 buildings , average cost: $295,1002020: 95 buildings , average cost: $295,4002019: 152 buildings , average cost: $291,6002018: 124 buildings , average cost: $277,4002017: 92 buildings , average cost: $207,6002016: 194 buildings , average cost: $153,5002015: 158 buildings , average cost: $161,1002014: 73 buildings , average cost: $177,0002013: 20 buildings , average cost: $195,6002012: 4 buildings , average cost: $142,9002011: 5 buildings , average cost: $111,4002010: 6 buildings , average cost: $133,3002009: 7 buildings , average cost: $196,7002008: 71 buildings , average cost: $205,3002007: 128 buildings , average cost: $174,1002006: 200 buildings , average cost: $142,8002005: 120 buildings , average cost: $136,3002004: 131 buildings , average cost: $135,3002003: 25 buildings , average cost: $160,8002002: 76 buildings , average cost: $128,2002001: 79 buildings , average cost: $117,9002000: 277 buildings , average cost: $88,9001999: 118 buildings , average cost: $98,1001998: 120 buildings , average cost: $108,3001997: 146 buildings , average cost: $97,800Unemployment in December 2023:
Population change in the 1990s: +3,005 (+23.3%).
Most common occupations in Cartersville, GA (%)
Both Males Females
Other production occupations, including supervisors (6.4%)
Other sales and related occupations, including supervisors (5.7%)
Other office and administrative support workers, including supervisors (4.0%)
Other management occupations, except farmers and farm managers (4.0%)
Textile, apparel, and furnishings workers (3.8%)
Building and grounds cleaning and maintenance occupations (3.5%)
Preschool, kindergarten, elementary, and middle school teachers (3.4%)
Other production occupations, including supervisors (9.6%)
Other sales and related occupations, including supervisors (5.4%)
Electrical equipment mechanics and other installation, maintenance, and repair workers, including supervisors (4.6%)
Other management occupations, except farmers and farm managers (4.2%)
Building and grounds cleaning and maintenance occupations (4.1%)
Metal workers and plastic workers (3.7%)
Material recording, scheduling, dispatching, and distributing workers (3.5%)
Other office and administrative support workers, including supervisors (6.7%)
Preschool, kindergarten, elementary, and middle school teachers (6.3%)
Secretaries and administrative assistants (6.3%)
Other sales and related occupations, including supervisors (5.9%)
Cashiers (5.2%)
Textile, apparel, and furnishings workers (4.4%)
Other management occupations, except farmers and farm managers (3.7%)
Tornado activity:
Cartersville-area historical tornado activity is slightly above Georgia state average. It is 77% greater than the overall U.S. average.
On 3/27/1994, a category F4 (max. wind speeds 207-260 mph) tornado 13.3 miles away from the Cartersville city center killed 3 people and injured 20 people and caused between $5,000,000 and $50,000,000 in damages.
On 11/22/1992, a category F4 tornado 19.3 miles away from the city center injured 46 people and caused between $5,000,000 and $50,000,000 in damages.
Earthquake activity:
Cartersville-area historical earthquake activity is significantly above Georgia state average. It is 78% greater than the overall U.S. average. On 4/29/2003 at 08:59:39, a magnitude 4.9 (4.4 MB, 4.6 MW, 4.9 LG, Class: Light, Intensity: IV - V) earthquake occurred 52.0 miles away from the city center On 4/29/2003 at 08:59:39, a magnitude 4.6 (4.6 MW, Depth: 12.3 mi) earthquake occurred 52.0 miles away from the city center On 8/2/1974 at 08:52:09, a magnitude 4.9 (4.3 MB, 4.9 LG) earthquake occurred 134.4 miles away from the city center On 11/30/1973 at 07:48:41, a magnitude 4.7 (4.7 MB, 4.6 ML) earthquake occurred 121.9 miles away from Cartersville center On 1/18/1999 at 07:00:53, a magnitude 4.8 (4.8 MB, 4.0 LG, Depth: 0.6 mi) earthquake occurred 150.7 miles away from the city center On 12/12/2018 at 09:14:43, a magnitude 4.4 (4.4 MW, Depth: 4.9 mi) earthquake occurred 99.4 miles away from the city center Magnitude types: regional Lg-wave magnitude (LG), body-wave magnitude (MB), local magnitude (ML), moment magnitude (MW) Natural disasters: The number of natural disasters in Bartow County (14) is near the US average (15).Major Disasters (Presidential) Declared: 9Emergencies Declared: 4Tornadoes: 6, Storms: 5, Floods: 4, Winter Storms: 3, Hurricanes: 2, Winds: 2, Drought: 1, Heavy Rain: 1, Snowfall: 1, Other: 1 (Note: some incidents may be assigned to more than one category). Hospitals in Cartersville: CARTERSVILLE MEDICAL CENTER (Proprietary, provides emergency services, 960 JOE FRANK HARRIS PARKWAY) HEARTLAND HOSPICE SERVICES ( CARTERSVILLE ) (9 MEDICAL DRIVE) REGENCY HOSPICE OF NORTHWEST GEORGIA (20 B FOX CHASE) SOUTHERNCARE NORTHWEST GEORGIA (27 MAPLERIDGE DRIVE, SUITE 101) Nursing Homes in Cartersville: CARTERSVILLE HEIGHTS CARE AND REHABILITATION CTR (78 OPAL STREET) MAPLE RIDGE HEALTH CARE CENTER (22 MAPLE RIDGE DRIVE S.E.) SPRINGDALE HEALTH CARE CENTER (78 OPAL ST) TOWNSEND PARK HEALTH AND REHABILITATION (196 NORTH DIXIE AVENUE) Dialysis Facilities in Cartersville: DSI CARTERSVILLE RENAL CENTER (203 S TENNESSEE STREET) FMCNA CARTERSVILLE (14 ROVING ROAD SE) Home Health Centers in Cartersville: FIRST AMERICAN HOME CARE OF GA CTRSVIL (958 N TENNESSEE ST) Airports located in Cartersville: Colleges/universities with over 2000 students nearest to Cartersville:
Kennesaw State University (about 17 miles; Kennesaw, GA ; Full-time enrollment: 21,215)
Georgia Northwestern Technical College (about 22 miles; Rome, GA ; FT enrollment: 4,629)
Chattahoochee Technical College (about 23 miles; Marietta, GA ; FT enrollment: 8,173)
Georgia Highlands College (about 24 miles; Rome, GA ; FT enrollment: 4,071)
Southern Polytechnic State University (about 24 miles; Marietta, GA ; FT enrollment: 5,258)
Berry College (about 24 miles; Mount Berry, GA ; FT enrollment: 2,102)
The Art Institute of Atlanta (about 31 miles; Atlanta, GA ; FT enrollment: 3,140)
Public high schools in Cartersville:
Private high school in Cartersville: EXCEL CHRISTIAN ACADEMY Students: 324, Location: 325 OLD MILL RD, Grades: KG-12)
Public elementary/middle schools in Cartersville: CARTERSVILLE PRIMARY SCHOOL Students: 1,113, Location: 315 ETOWAH DR, Grades: PK-2)CASS MIDDLE SCHOOL Students: 1,019, Location: 195 FIRE TOWER RD NW, Grades: 6-8)CARTERSVILLE ELEMENTARY SCHOOL Students: 902, Location: 340 OLD MILL RD, Grades: 3-5)CARTERSVILLE MIDDLE SCHOOL Students: 846, Location: 825 DOUTHIT FERRY RD, Grades: 6-8)HAMILTON CROSSING ELEMENTARY SCHOOL Students: 727, Location: 116 HAMILTON CROSSING RD NW, Grades: PK-5)CLOVERLEAF ELEMENTARY Students: 724, Location: 291 HIGHWAY 20 SPUR, Grades: PK-5)CLEAR CREEK ELEMENTARY SCHOOL Students: 587, Location: 50 PLEASANT VALLEY RD NW, Grades: PK-5)MISSION ROAD ELEMENTARY SCHOOL Students: 541, Location: 1100 MISSION RD SW, Grades: PK-5)Private elementary/middle school in Cartersville: TRINITY SCHOOL OF CARTERSVILLE Students: 96, Location: 814 WEST AVE, Grades: PK-8)
See full list of schools located in Cartersville Library in Cartersville: BARTOW COUNTY LIBRARY SYSTEM Operating income: $1,919,573; Location: 429 WEST MAIN STREET; 104,390 books ; 3,698 audio materials ; 5,757 video materials ; 146 state licensed databases ; 248 print serial subscriptions ; 15 electronic serial subscriptions )
User-submitted facts and corrections:
WYXC am 1270 (radio station) is now owned by Clarion Communications, not Rodgers Communications added by Dusty
please include Booth Western Art Museum, Etowah River, Etowah Indian Mounds
Notable locations in Cartersville: (A) , Cartersville Industrial Park North (B) , Royal Oaks Golf Course (C) , Bartow County Courthouse (D) , Cartersville City Hall (E) , William Weinman Mineral Center Museum (F) , Cartersville Fire Department Station 3 (G) , Cartersville Fire Department Station 1 (H) , Bartow County Jail (I) , Cartersville Main Street Library (J) . Display/hide their locations on the map
Shopping Centers: (1) , Main Street East Shopping Center (2) , Cartersville Plaza Shopping Center (3) , Cartersville Village Shopping Center (4) , Collins Pointe Shopping Center (5) , Market Square Shopping Center (6) , North Corners Shopping Center (7) . Display/hide their locations on the map
Churches in Cartersville include: (A) , First Baptist Church of Cartersville (B) , Atco Baptist Church (C) , Faith Church (D) , First Presbyterian Church (E) , Ascension Protestant Episcopal Church (F) , Jones Memorial Church (G) , Macedonia Church (H) , Mount Zion Baptist Church (I) . Display/hide their locations on the map
Cemeteries: (1) , Corinth Baptist Church Cemetery (2) , Pettit Creek Baptist Church Cemetery (3) . Display/hide their locations on the map
Reservoirs: (A) , Conner Lake (B) . Display/hide their locations on the map
Streams, rivers, and creeks: (A) , Satterfield Branch (B) , Nancy Creek (C) . Display/hide their locations on the map
Park in Cartersville: (1) . Display/hide its location on the map
Tourist attractions: (1) , History Center (Museums; 15 South Gilmer Street) (2) , Euharlee Museum (116 Covered Bridge Road Southwest) (3) , Bartow City Park - Roselawn (Museums; Roselawn) (4) , Noble Hill-Wheeler Memorial Center Museum (Cultural Attractions- Events- & Facilities; 2361 Joe Frank Harris Pkw) (5) , Bartow County Genealogical Soci & Family Rsrch Lbrry (Cultural Attractions- Events- & Facilities; 9 South Gilmer Street) (6) . Display/hide their approximate locations on the map
Hotels: (1) , Econo Lodge (26 State Route 20 Spur SE) (2) , Dixie Inn (2335 Highway 411 Northeast) (3) , Best Western Garden Inn & Suites (5663 Highway 20 Northeast) (4) , Comfort Inn Cartersville (28 Sr 20 Spur Southeast) (5) , Econo Lodge Cartersville (26 Sr 20 Spur Southeast) (6) , Guest House (204 East Felton Road) (7) , Cartersville Travelodge (35 Carson Loop NW) (8) , Cartersville-Days Inn (5618 Highway 20 SE) (9) . Display/hide their approximate locations on the map
Courts: (1) , Bartow County Government - Juvenile Court (135 West Cherokee Avenue) (2) . Display/hide their approximate locations on the map
Birthplace of: Cledus T. Judd - Country singer, George Right Smith - Confederate Army soldier, Hedy West - Musician, Reuben Ellis Jenkins - Recipient of the Purple Heart medal, Eddie Lee Wilkins - Basketball player, Joe Frank Harris - Politician, Andre Fluellen - Football player, Derrick Broom - College basketball player (UAB Blazers), Donavan Tate - Baseball player, Emmanuel Holloway - College basketball player (Mercer Bears).
Bartow County has a predicted average indoor radon screening level between 2 and 4 pCi/L (pico curies per liter) - Moderate Potential Drinking water stations with addresses in Cartersville and their reported violations in the past:
BARTOW COUNTY (Population served: 50,162, Purch surface water):
Past health violations:
MCL, Monthly (TCR) - In JUN-2010, Contaminant: Coliform. Follow-up actions: St Public Notif requested (JUN-22-2010), St Violation/Reminder Notice (JUN-22-2010), St Public Notif received (AUG-06-2010)
MCL, Monthly (TCR) - In JUL-2008, Contaminant: Coliform. Follow-up actions: St Public Notif requested (JUL-23-2008), St Violation/Reminder Notice (JUL-23-2008), St Public Notif received (OCT-17-2008)
Past monitoring violations:
Follow-up Or Routine LCR Tap M/R - In OCT-01-1998, Contaminant: Lead and Copper Rule. Follow-up actions: St Compliance achieved (AUG-12-1999), St Intentional no-action (AUG-27-2001)
Follow-up Or Routine LCR Tap M/R - In OCT-01-1996, Contaminant: Lead and Copper Rule. Follow-up actions: St Compliance achieved (SEP-05-1997), St Intentional no-action (AUG-27-2001)
Population served: 24,830, Surface water):
Past health violations:
MCL, Monthly (TCR) - In AUG-2011, Contaminant: Coliform. Follow-up actions: St Public Notif requested (AUG-18-2011), St Violation/Reminder Notice (AUG-18-2011), St Public Notif received (OCT-07-2011)
MCL, Monthly (TCR) - In JUL-2010, Contaminant: Coliform. Follow-up actions: St Public Notif requested (JUL-29-2010), St Violation/Reminder Notice (JUL-29-2010), St Public Notif received (AUG-31-2010)
Past monitoring violations:
Follow-up Or Routine LCR Tap M/R - In OCT-01-2004, Contaminant: Lead and Copper Rule. Follow-up actions: St Intentional no-action (FEB-18-2005), St Compliance achieved (JUN-15-2005)
Average household size: This city:
2.6 peopleGeorgia:
2.6 people
Percentage of family households: This city:
67.2%Whole state:
68.5%
Percentage of households with unmarried partners: This city:
5.9%Whole state:
5.9%
Likely homosexual households (counted as self-reported same-sex unmarried-partner households)
Lesbian couples: 0.3% of all households Gay men: 0.3% of all households
People in group quarters in Cartersville in 2010:
594 people in local jails and other municipal confinement facilities
232 people in nursing facilities/skilled-nursing facilities
55 people in other noninstitutional facilities
13 people in emergency and transitional shelters (with sleeping facilities) for people experiencing homelessness
4 people in group homes intended for adults
People in group quarters in Cartersville in 2000:
437 people in local jails and other confinement facilities (including police lockups)
260 people in nursing homes
23 people in other group homes
14 people in other noninstitutional group quarters
Banks with most branches in Cartersville (2011 data):
Hamilton State Bank: Bartow County Bank Branch, Chulio Commons Mall Branch, North Corners Branch. Info updated 2012/01/23: Bank assets: $909.1 mil, Deposits: $727.5 mil, headquarters in Hoschton, GA, positive income , Commercial Lending Specialization, 22 total offices , Holding Company: Hamilton State Bancshares, Inc.
Bank of the Ozarks: Cartersville Henderson Branch at 601 Henderson Dr, branch established on 2005/05/11; Cartersville Main Branch at 950 Joe Frank Harris Parkway, S.E., branch established on 1998/11/30. Info updated 2011/05/03: Bank assets: $3,828.0 mil, Deposits: $2,955.2 mil, headquarters in Little Rock, AR, positive income , Commercial Lending Specialization, 115 total offices , Holding Company: Bank Of The Ozarks Inc
Bank of America, National Association: Joe Frank Harris Parkway Branch at 829 Joe Frank Harris Parkway, S.E., branch established on 1991/05/07; Cartersville Main Branch at 102 East Main Street, branch established on 1948/11/19. Info updated 2009/11/18: Bank assets: $1,451,969.3 mil, Deposits: $1,077,176.8 mil, headquarters in Charlotte, NC, positive income , 5782 total offices , Holding Company: Bank Of America Corporation
Renasant Bank: Cartersville Branch at 880 Joe Frank Harris Parkway, branch established on 1998/03/09; Westside Cartersville Branch at 420 Old Mill Road, branch established on 2004/08/26. Info updated 2012/02/10: Bank assets: $4,196.4 mil, Deposits: $3,416.0 mil, headquarters in Tupelo, MS, positive income , Commercial Lending Specialization, 76 total offices , Holding Company: Renasant Corporation
SunTrust Bank: Cartersville Branch at 515 East Main Street, branch established on 1999/12/29; Cartersville Branch - 990 at 827 Joe Frank Harris Parkway, S.E., branch established on 1989/10/23. Info updated 2010/05/27: Bank assets: $171,291.7 mil, Deposits: $129,833.2 mil, headquarters in Atlanta, GA, positive income , Commercial Lending Specialization, 1716 total offices , Holding Company: Suntrust Banks, Inc.
Branch Banking and Trust Company: Cartersville Remote Drive-Up Branch at 313 E. Cherokee Street, branch established on 2001/05/11; Cartersville Branch at 314 East Main Street, branch established on 1905/06/13. Info updated 2010/03/29: Bank assets: $168,867.6 mil, Deposits: $127,549.5 mil, headquarters in Winston Salem, NC, positive income , Commercial Lending Specialization, 1793 total offices , Holding Company: Bb&T Corporation
Regions Bank: Cartersville Branch at 200 West Main Street, branch established on 1996/06/30; Cartersville Commons Branch at 620 E. Main Street, branch established on 2008/06/23. Info updated 2011/02/24: Bank assets: $123,368.2 mil, Deposits: $98,301.3 mil, headquarters in Birmingham, AL, positive income , Commercial Lending Specialization, 1778 total offices , Holding Company: Regions Financial Corporation
United Community Bank: Cartersville Branch at 1320 Joe Frank Harris Parkway, branch established on 2004/02/02. Info updated 2009/06/23: Bank assets: $6,977.4 mil, Deposits: $6,170.1 mil, headquarters in Blairsville, GA, negative income in the last year , Commercial Lending Specialization, 106 total offices , Holding Company: United Community Banks, Inc.
Northside Bank: Cartersville Branch at 325 Cherokee Place, branch established on 2005/11/14. Info updated 2007/08/31: Bank assets: $124.5 mil, Deposits: $115.2 mil, headquarters in Adairsville, GA, negative income in the last year , Commercial Lending Specialization, 3 total offices , Holding Company: Northside Bancshares, Inc.
4 other banks with 4 local branches
For population 15 years and over in Cartersville:
Never married: 30.8%Now married: 46.1%Separated: 2.7%Widowed: 10.6%Divorced: 9.9% For population 25 years and over in Cartersville:
High school or higher: 88.5%Bachelor's degree or higher: 27.3%Graduate or professional degree: 9.1%Unemployed: 5.7%Mean travel time to work (commute): 24.9 minutes
Education Gini index (Inequality in education) Here:
12.3Georgia average:
12.2
Religion statistics for Cartersville, GA (based on Bartow County data)
Religion Adherents Congregations Evangelical Protestant 34,632 87 Mainline Protestant 6,830 19 Catholic 2,401 1 Black Protestant 1,727 8 Other 1,189 6 None 53,378 -
Source: Clifford Grammich, Kirk Hadaway, Richard Houseal, Dale E.Jones, Alexei Krindatch, Richie Stanley and Richard H.Taylor. 2012. 2010 U.S.Religion Census: Religious Congregations & Membership Study. Association of Statisticians of American Religious Bodies. Jones, Dale E., et al. 2002. Congregations and Membership in the United States 2000. Nashville, TN: Glenmary Research Center. Graphs represent county-level data
Food Environment Statistics: Number of grocery stores : 16Here :
1.73 / 10,000 pop.Georgia :
1.91 / 10,000 pop.
Number of supercenters and club stores : 1Bartow County :
0.11 / 10,000 pop.State :
0.15 / 10,000 pop.
Number of convenience stores (no gas) : 2Here :
0.22 / 10,000 pop.Georgia :
0.86 / 10,000 pop.
Number of convenience stores (with gas) : 67Bartow County :
7.24 / 10,000 pop.Georgia :
5.12 / 10,000 pop.
Number of full-service restaurants : 71This county :
7.67 / 10,000 pop.State :
7.41 / 10,000 pop.
Adult diabetes rate : Bartow County :
9.5%Georgia :
10.4%
Adult obesity rate : Bartow County :
26.9%Georgia :
27.8%
Low-income preschool obesity rate : This county :
15.0%State :
14.6%
Health and Nutrition: Healthy diet rate : Cartersville:
48.6%Georgia:
48.9%
Average overall health of teeth and gums : Cartersville:
45.6%Georgia:
46.5%
People feeling badly about themselves : People not drinking alcohol at all : Cartersville:
11.3%Georgia:
10.8%
Average hours sleeping at night : Overweight people : Cartersville:
34.9%Georgia:
33.5%
General health condition : This city:
55.2%Georgia:
56.2%
Average condition of hearing : Cartersville:
78.9%Georgia:
80.8%
More about Health and Nutrition of Cartersville, GA Residents
Local government employment and payroll (March 2022)
Function
Full-time employees
Monthly full-time payroll
Average yearly full-time wage
Part-time employees
Monthly part-time payroll
Firefighters
74 $371,484 $60,241 0 $0 Police Protection - Officers
51 $267,995 $63,058 0 $0 Sewerage
37 $164,953 $53,498 0 $0 Electric Power
29 $178,319 $73,787 0 $0 Financial Administration
28 $146,849 $62,935 0 $0 Gas Supply
27 $148,523 $66,010 0 $0 Parks and Recreation
25 $108,775 $52,212 33 $24,475 Water Supply
20 $104,979 $62,987 2 $2,584 Other Government Administration
19 $132,175 $83,479 0 $0 Streets and Highways
17 $74,781 $52,787 0 $0 Solid Waste Management
13 $54,646 $50,442 0 $0 Police - Other
10 $41,629 $49,955 0 $0 Other and Unallocable
9 $50,694 $67,592 0 $0 Judicial and Legal
2 $9,402 $56,412 3 $2,385 Fire - Other
1 $4,150 $49,800 0 $0
Totals for Government
362 $1,859,353 $61,636 38 $29,443
Cartersville government finances - Expenditure in 2021 (per resident):
Construction - Parks and Recreation: $390,000 ($16.32)
Regular Highways: $220,000 ($9.20)Local Fire Protection: $20,000 ($0.84)Current Operations - General - Other: $73,499,000 ($3074.76)
Electric Utilities: $42,770,000 ($1789.24)Central Staff Services: $22,319,000 ($933.69)Gas Utilities: $17,174,000 ($718.46)Local Fire Protection: $7,384,000 ($308.90)Police Protection: $5,949,000 ($248.87)Water Utilities: $4,179,000 ($174.82)Parks and Recreation: $3,290,000 ($137.63)Regular Highways: $2,906,000 ($121.57)Sewerage: $2,726,000 ($114.04)Solid Waste Management: $1,811,000 ($75.76)Financial Administration: $1,397,000 ($58.44)Judicial and Legal Services: $258,000 ($10.79)General Public Buildings: $1,000 ($0.04)Gas Utilities - Interest on Debt: $178,000 ($7.45)
General - Interest on Debt: $3,853,000 ($161.19)
Intergovernmental to Local - Other - General - Other: $22,000 ($0.92)
Other - Correctional Institutions: $17,000 ($0.71)Other Capital Outlay - Police Protection: $297,000 ($12.42)
Regular Highways: $204,000 ($8.53)Local Fire Protection: $76,000 ($3.18)Central Staff Services: $49,000 ($2.05)Financial Administration: $21,000 ($0.88)Parks and Recreation: $13,000 ($0.54)Water Utilities - Interest on Debt: $1,518,000 ($63.50)
Cartersville government finances - Revenue in 2021 (per resident):
Charges - Sewerage: $15,927,000 ($666.29)
Solid Waste Management: $2,928,000 ($122.49)Other: $2,497,000 ($104.46)Parks and Recreation: $543,000 ($22.72)Federal Intergovernmental - Other: $7,294,000 ($305.14)
Local Intergovernmental - Other: $6,626,000 ($277.19)
General Local Government Support: $4,837,000 ($202.35)Miscellaneous - General Revenue - Other: $792,000 ($33.13)
Interest Earnings: $519,000 ($21.71)Fines and Forfeits: $232,000 ($9.71)Sale of Property: $106,000 ($4.43)Rents: $35,000 ($1.46)Donations From Private Sources: $3,000 ($0.13)Revenue - Electric Utilities: $47,952,000 ($2006.02)
Gas Utilities: $25,489,000 ($1066.31)Water Utilities: $9,082,000 ($379.94)State Intergovernmental - Other: $1,602,000 ($67.02)
General Local Government Support: $70,000 ($2.93)Tax - Property: $24,709,000 ($1033.68)
Public Utilities Sales: $5,629,000 ($235.48)Insurance Premiums Sales: $1,589,000 ($66.47)Other Selective Sales: $1,042,000 ($43.59)Alcoholic Beverage Sales: $837,000 ($35.02)Other: $406,000 ($16.98)Occupation and Business License - Other: $327,000 ($13.68)Other License: $313,000 ($13.09)Alcoholic Beverage License: $227,000 ($9.50)
Cartersville government finances - Debt in 2021 (per resident):
Long Term Debt - Outstanding Unspecified Public Purpose: $129,798,000 ($5429.97)
Beginning Outstanding - Unspecified Public Purpose: $81,210,000 ($3397.34)Issue, Unspecified Public Purpose: $52,725,000 ($2205.70)Beginning Outstanding - Public Debt for Private Purpose: $5,505,000 ($230.30)Retired Nonguaranteed - Public Debt for Private Purpose: $5,195,000 ($217.33)Retired Unspecified Public Purpose: $4,136,000 ($173.03)Outstanding Nonguaranteed - Industrial Revenue: $310,000 ($12.97)
Cartersville government finances - Cash and Securities in 2021 (per resident):
Bond Funds - Cash and Securities: $47,298,000 ($1978.66)
Other Funds - Cash and Securities: $128,743,000 ($5385.84)
Sinking Funds - Cash and Securities: $4,875,000 ($203.94)
Businesses in Cartersville, GA
Name Count Name Count
AT&T 2 Lowe's 1 Ace Hardware 1 Marriott 1 Advance Auto Parts 3 McDonald's 6 Applebee's 1 Microtel 1 Arby's 2 Motel 6 1 AutoZone 1 New Balance 2 Best Western 1 Nike 4 Blockbuster 1 Payless 1 Burger King 2 Penske 1 CVS 3 Pier 1 Imports 1 Chick-Fil-A 1 Pizza Hut 2 Church's Chicken 1 Popeyes 1 Cracker Barrel 1 Publix Super Markets 1 Dairy Queen 1 Quality 1 Days Inn 1 Quiznos 1 Domino's Pizza 2 RadioShack 1 Famous Footwear 1 Ramada 1 FedEx 13 Red Lobster 1 Firestone Complete Auto Care 1 Red Roof Inn 1 Ford 1 Rite Aid 2 GNC 1 Ruby Tuesday 1 GameStop 2 Rue21 1 Goodwill 1 Ryan's Grill 1 H&R Block 1 SAS Shoes 1 Hilton 1 SONIC Drive-In 1 Hobby Lobby 1 Sleep Inn 1 Holiday Inn 1 Sprint Nextel 2 Home Depot 1 Staples 1 Honda 1 Starbucks 1 Howard Johnson 1 Subway 6 Hyundai 1 Super 8 1 IHOP 1 T-Mobile 2 Jones New York 2 T.J.Maxx 1 KFC 1 Taco Bell 2 Kmart 1 Target 1 Knights Inn 1 U-Haul 9 Kohl's 1 UPS 9 Kroger 1 Verizon Wireless 1 La-Z-Boy 1 Waffle House 5 Lane Furniture 2 Walmart 1 Little Caesars Pizza 1 Wendy's 2
Strongest AM radio stations in Cartersville:
WBHF (1450 AM; 1 kW; CARTERSVILLE, GA; Owner: ANVERSE, INC.)
WYXC (1270 AM; 2 kW; CARTERSVILLE, GA; Owner: ROGERS COMMUNICATIONS, INC.)
WFTD (1080 AM; daytime; 50 kW; MARIETTA, GA; Owner: PRIETO ENTERPRISES, INC.)
WGST (640 AM; 50 kW; ATLANTA, GA; Owner: CITICASTERS LICENSES, L.P.)
WMLB (1160 AM; 50 kW; EAST POINT, GA; Owner: ATLANTA AREA BROADCASTING, INC.)
WCNN (680 AM; 50 kW; NORTH ATLANTA, GA; Owner: DICKEY BROADCASTING COMPANY)
WAZX (1550 AM; 50 kW; SMYRNA, GA; Owner: GA-MEX BROADCASTING, INC.)
WSB (750 AM; 50 kW; ATLANTA, GA; Owner: CXR HOLDINGS, INC.)
WAOK (1380 AM; 50 kW; ATLANTA, GA; Owner: INFINITY BROADCASTING OPERATIONS, INC.)
WKNG (1060 AM; daytime; 50 kW; TALLAPOOSA, GA; Owner: WKNG, INC.)
WQXI (790 AM; 28 kW; ATLANTA, GA; Owner: JEFFERSON-PILOT COMMUNICATIONS COMPANY OF GEORGIA)
WGUN (1010 AM; 50 kW; ATLANTA, GA; Owner: WGUN, INC.)
WAOS (1600 AM; 20 kW; AUSTELL, GA; Owner: LA FAVORITA, INC.)
Strongest FM radio stations in Cartersville:
WCCV (91.7 FM; CARTERSVILLE, GA; Owner: IMMANUEL BROADCASTING NETWORK, INC.)
W214AS (90.7 FM; WALESKA, GA; Owner: CALVARY CHAPEL OF TWIN FALLS, INC.)
W221AW (92.1 FM; NORTH CANTON, GA; Owner: IMMANUEL BROADCASTING NETWORK, INC.)
WTSH-FM (107.1 FM; ROCKMART, GA; Owner: BROADCAST INVESTMENT ASSOCIATES, INC)
WLCL (105.7 FM; CANTON, GA; Owner: CHEROKEE BROADCASTING CO., INC.)
WJCK (88.3 FM; PIEDMONT, AL; Owner: IMMANUEL BROADCASTING NETWORK, INC.)
W265BD (100.9 FM; WOODSTOCK, GA; Owner: IMMANUEL BROADCASTING NETWORK, INC.)
W234AG (94.7 FM; CHATSWORTH, GA; Owner: IMMANUEL BROADCASTING NETWORK, INC.)
W215BA (90.9 FM; ROME, GA; Owner: PENSACOLA CHRISTIAN COLLEGE, INC.)
WKCX (97.7 FM; ROME, GA; Owner: BRIAR CREEK BROADCASTING CORP.)
WQTU (102.3 FM; ROME, GA; Owner: MCDOUGALD BROADCASTING CORPORATION)
W212AR (90.3 FM; LINDALE, GA; Owner: WAY-FM MEDIA GROUP, INC.)
WWWQ (100.5 FM; ANNISTON, AL; Owner: WNNX LICO, INC.)
WNNX (99.7 FM; ATLANTA, GA; Owner: WNNX LICO, INC.)
WKHX-FM (101.5 FM; MARIETTA, GA; Owner: ABC, INC.)
WKLS (96.1 FM; ATLANTA, GA; Owner: CITICASTERS LICENSES, L.P.)
WLTM (94.9 FM; ATLANTA, GA; Owner: CITICASTERS LICENSES, L.P.)
WWEV-FM (91.5 FM; CUMMING, GA; Owner: CURRICULUM DEVELOPMENT FOUNDATION)
WRFG (89.3 FM; ATLANTA, GA; Owner: RADIO FREE GEORGIA BROADCASTING FOUNDATION INC)
WFOX (97.1 FM; GAINESVILLE, GA; Owner: COX RADIO, INC.)
TV broadcast stations around Cartersville:
WPXA (Channel 14; ROME, GA; Owner: PAXSON ATLANTA LICENSE, INC.)
WSKC-LP (Channel 59; ATLANTA, GA; Owner: KM LPTV OF ATLANTA, L.L.C.)
WUVG (Channel 34; ATHENS, GA; Owner: UNIVISION ATLANTA LLC)
WAGA (Channel 5; ATLANTA, GA; Owner: FOX TELEVISION STATIONS, INC.)
WSB-TV (Channel 2; ATLANTA, GA; Owner: WSB-TV HOLDINGS, INC.)
W50AB (Channel 50; HIAWASSEE, GA; Owner: GEORGIA PUBLIC TELECOMMUNICATIONS COMMISSION)
WXIA-TV (Channel 11; ATLANTA, GA; Owner: GANNETT GEORGIA, L.P.)
WATL (Channel 36; ATLANTA, GA; Owner: WATL, LLC)
WTBS (Channel 17; ATLANTA, GA; Owner: SUPERSTATION, INC.)
WGCL-TV (Channel 46; ATLANTA, GA; Owner: MEREDITH CORPORATION)
WHSG (Channel 63; MONROE, GA; Owner: TRINITY BROADCASTING NETWORK)
WANN-LP (Channel 32; ATLANTA, GA; Owner: PRISM BROADCASTING NETWORK, INC.)
WDTA-LP (Channel 53; FAYETTEVILLE, GA; Owner: WORD OF GOD FELLOWSHIP, INC.)
WUPA (Channel 69; ATLANTA, GA; Owner: VIACOM STATIONS GROUP OF ATLANTA INC.)
WPBA (Channel 30; ATLANTA, GA; Owner: BOARD OF EDUCATION OF THE CITY OF ATLANTA)
WTHC-LP (Channel 42; ATLANTA, GA; Owner: THE ATLANTA CHANNEL, INC.)
WIRE-CA (Channel 40; ATLANTA, GA; Owner: COMMERCIAL BROADCASTING CORP.)
WANX-LP (Channel 26; ATLANTA, GA; Owner: PRISM BROADCASTING NETWORK, INC.)
W38CU (Channel 38; ATLANTA, GA; Owner: KOREAN AMERICAN TV BROADCASTING CORP.)
National Bridge Inventory (NBI) Statistics 98 Number of bridges1,040ft / 317m Total length $297,446,000 Total costs1,463,893 Total average daily traffic62,349 Total average daily truck traffic
New bridges - historical statistics
2 1920-1929 4 1930-1939 4 1940-1949 10 1950-1959 4 1960-1969 20 1970-1979 6 1980-1989 6 1990-1999 5 2000-2009 8 2010-2019 2 2020-2022
See full National Bridge Inventory statistics for Cartersville, GA
Home Mortgage Disclosure Act Aggregated Statistics For Year 2009(Based on 3 partial tracts) A) FHA, FSA/RHS & VA B) Conventional C) Refinancings D) Home Improvement Loans E) Loans on Dwellings For 5+ Families F) Non-occupant Loans on G) Loans On Manufactured Number Average Value Number Average Value Number Average Value Number Average Value Number Average Value Number Average Value Number Average Value
LOANS ORIGINATED 38 $140,228 53 $178,297 214 $166,194 9 $52,981 2 $1,381,205 64 $179,224 1 $63,300 APPLICATIONS APPROVED, NOT ACCEPTED 5 $167,256 4 $182,072 17 $190,761 3 $105,173 0 $0 1 $27,340 0 $0 APPLICATIONS DENIED 8 $114,690 4 $120,608 85 $172,666 8 $18,116 0 $0 6 $67,373 2 $36,680 APPLICATIONS WITHDRAWN 11 $151,170 7 $177,199 51 $179,475 1 $47,110 0 $0 3 $124,860 0 $0 FILES CLOSED FOR INCOMPLETENESS 2 $165,550 2 $123,860 15 $198,007 1 $53,330 0 $0 1 $38,090 0 $0
Aggregated Statistics For Year 2008(Based on 3 partial tracts) A) FHA, FSA/RHS & VA B) Conventional C) Refinancings D) Home Improvement Loans E) Loans on Dwellings For 5+ Families F) Non-occupant Loans on G) Loans On Manufactured Number Average Value Number Average Value Number Average Value Number Average Value Number Average Value Number Average Value Number Average Value
LOANS ORIGINATED 46 $149,296 85 $162,856 183 $170,080 9 $69,030 5 $1,318,092 102 $160,435 3 $276,993 APPLICATIONS APPROVED, NOT ACCEPTED 1 $55,850 8 $140,270 23 $161,323 4 $73,680 0 $0 5 $94,860 1 $25,750 APPLICATIONS DENIED 10 $156,700 12 $291,900 94 $147,542 18 $43,104 0 $0 12 $247,638 2 $86,320 APPLICATIONS WITHDRAWN 5 $130,384 6 $267,495 42 $194,431 3 $33,917 0 $0 4 $94,945 0 $0 FILES CLOSED FOR INCOMPLETENESS 1 $114,320 3 $172,297 10 $157,948 1 $88,190 0 $0 1 $62,530 0 $0
Aggregated Statistics For Year 2007(Based on 3 partial tracts) A) FHA, FSA/RHS & VA B) Conventional C) Refinancings D) Home Improvement Loans E) Loans on Dwellings For 5+ Families F) Non-occupant Loans on G) Loans On Manufactured Number Average Value Number Average Value Number Average Value Number Average Value Number Average Value Number Average Value Number Average Value
LOANS ORIGINATED 32 $142,745 185 $151,445 192 $162,045 23 $65,922 4 $1,438,992 82 $134,034 2 $107,445 APPLICATIONS APPROVED, NOT ACCEPTED 2 $112,190 19 $168,638 37 $137,510 2 $29,710 0 $0 10 $101,635 0 $0 APPLICATIONS DENIED 5 $175,552 23 $152,373 156 $157,950 21 $72,760 0 $0 16 $147,040 1 $91,870 APPLICATIONS WITHDRAWN 2 $173,205 22 $152,254 65 $166,975 3 $131,587 0 $0 8 $99,110 0 $0 FILES CLOSED FOR INCOMPLETENESS 0 $0 5 $129,984 24 $211,143 2 $105,215 0 $0 1 $83,570 1 $58,660
Aggregated Statistics For Year 2006(Based on 3 partial tracts) A) FHA, FSA/RHS & VA B) Conventional C) Refinancings D) Home Improvement Loans E) Loans on Dwellings For 5+ Families F) Non-occupant Loans on G) Loans On Manufactured Number Average Value Number Average Value Number Average Value Number Average Value Number Average Value Number Average Value Number Average Value
LOANS ORIGINATED 32 $133,142 277 $129,083 233 $145,633 19 $97,393 3 $658,007 109 $102,160 3 $94,037 APPLICATIONS APPROVED, NOT ACCEPTED 1 $84,770 29 $139,150 30 $152,090 2 $33,920 0 $0 9 $170,397 2 $23,915 APPLICATIONS DENIED 5 $150,094 58 $113,611 134 $136,535 36 $71,091 0 $0 28 $105,486 3 $39,077 APPLICATIONS WITHDRAWN 2 $150,155 40 $123,271 84 $149,099 6 $96,582 0 $0 13 $86,236 1 $45,340 FILES CLOSED FOR INCOMPLETENESS 0 $0 10 $112,277 23 $127,159 1 $204,160 0 $0 1 $236,700 0 $0
Aggregated Statistics For Year 2005(Based on 3 partial tracts) A) FHA, FSA/RHS & VA B) Conventional C) Refinancings D) Home Improvement Loans E) Loans on Dwellings For 5+ Families F) Non-occupant Loans on G) Loans On Manufactured Number Average Value Number Average Value Number Average Value Number Average Value Number Average Value Number Average Value Number Average Value
LOANS ORIGINATED 25 $129,320 282 $121,715 246 $129,927 22 $72,685 2 $1,111,210 99 $92,658 5 $52,318 APPLICATIONS APPROVED, NOT ACCEPTED 1 $58,990 20 $125,021 35 $123,644 3 $87,607 0 $0 5 $122,654 2 $47,585 APPLICATIONS DENIED 2 $117,275 55 $104,251 112 $151,814 24 $27,729 1 $102,010 27 $102,429 7 $50,311 APPLICATIONS WITHDRAWN 4 $129,352 36 $125,461 74 $143,809 11 $129,255 1 $423,560 14 $110,914 0 $0 FILES CLOSED FOR INCOMPLETENESS 0 $0 8 $108,392 41 $169,055 1 $38,340 0 $0 4 $157,155 1 $80,530
Aggregated Statistics For Year 2004(Based on 3 partial tracts) A) FHA, FSA/RHS & VA B) Conventional C) Refinancings D) Home Improvement Loans E) Loans on Dwellings For 5+ Families F) Non-occupant Loans on G) Loans On Manufactured Number Average Value Number Average Value Number Average Value Number Average Value Number Average Value Number Average Value Number Average Value
LOANS ORIGINATED 28 $113,360 230 $138,323 257 $135,396 33 $55,369 3 $1,958,490 126 $108,809 4 $53,575 APPLICATIONS APPROVED, NOT ACCEPTED 2 $98,775 18 $119,082 32 $126,950 5 $44,816 0 $0 5 $73,372 3 $26,560 APPLICATIONS DENIED 5 $105,088 28 $95,068 114 $133,870 24 $32,123 0 $0 14 $78,334 6 $48,570 APPLICATIONS WITHDRAWN 4 $133,335 20 $126,028 68 $121,643 5 $40,848 0 $0 8 $85,908 1 $44,890 FILES CLOSED FOR INCOMPLETENESS 1 $159,980 4 $83,708 25 $138,563 2 $30,445 0 $0 5 $115,122 0 $0
Aggregated Statistics For Year 2003(Based on 3 partial tracts) A) FHA, FSA/RHS & VA B) Conventional C) Refinancings D) Home Improvement Loans E) Loans on Dwellings For 5+ Families F) Non-occupant Loans on Number Average Value Number Average Value Number Average Value Number Average Value Number Average Value Number Average Value
LOANS ORIGINATED 47 $113,633 185 $134,684 469 $132,291 17 $41,914 1 $456,320 85 $90,641 APPLICATIONS APPROVED, NOT ACCEPTED 1 $59,330 10 $145,402 49 $128,191 1 $2,170 0 $0 5 $120,072 APPLICATIONS DENIED 3 $83,467 22 $112,169 89 $119,622 14 $25,819 0 $0 9 $78,409 APPLICATIONS WITHDRAWN 3 $82,450 9 $127,410 64 $142,092 1 $26,400 0 $0 4 $123,730 FILES CLOSED FOR INCOMPLETENESS 2 $138,405 6 $106,287 20 $137,911 2 $28,340 0 $0 1 $76,490
Aggregated Statistics For Year 2002(Based on 3 partial tracts) A) FHA, FSA/RHS & VA B) Conventional C) Refinancings D) Home Improvement Loans E) Loans on Dwellings For 5+ Families F) Non-occupant Loans on Number Average Value Number Average Value Number Average Value Number Average Value Number Average Value Number Average Value
LOANS ORIGINATED 58 $110,671 168 $126,486 358 $127,401 27 $26,599 1 $744,280 98 $95,573 APPLICATIONS APPROVED, NOT ACCEPTED 1 $93,170 11 $123,385 40 $137,340 2 $17,400 0 $0 5 $167,318 APPLICATIONS DENIED 3 $125,540 20 $69,454 82 $109,176 9 $17,312 0 $0 6 $83,685 APPLICATIONS WITHDRAWN 3 $133,963 13 $120,329 62 $134,653 3 $67,293 0 $0 12 $130,112 FILES CLOSED FOR INCOMPLETENESS 1 $42,740 2 $68,255 27 $126,231 1 $24,700 0 $0 1 $107,950
Aggregated Statistics For Year 2001(Based on 3 partial tracts) A) FHA, FSA/RHS & VA B) Conventional C) Refinancings D) Home Improvement Loans E) Loans on Dwellings For 5+ Families F) Non-occupant Loans on Number Average Value Number Average Value Number Average Value Number Average Value Number Average Value Number Average Value
LOANS ORIGINATED 60 $107,880 178 $124,629 354 $139,454 30 $35,869 0 $0 82 $169,402 APPLICATIONS APPROVED, NOT ACCEPTED 2 $109,630 11 $100,925 31 $87,489 4 $25,785 0 $0 3 $41,680 APPLICATIONS DENIED 8 $94,424 29 $79,316 97 $97,229 19 $13,565 1 $372,580 7 $142,213 APPLICATIONS WITHDRAWN 9 $109,036 14 $108,514 58 $82,633 8 $50,626 0 $0 5 $85,724 FILES CLOSED FOR INCOMPLETENESS 0 $0 3 $62,357 14 $77,494 0 $0 0 $0 0 $0
Aggregated Statistics For Year 2000(Based on 3 partial tracts) A) FHA, FSA/RHS & VA B) Conventional C) Refinancings D) Home Improvement Loans F) Non-occupant Loans on Number Average Value Number Average Value Number Average Value Number Average Value Number Average Value
LOANS ORIGINATED 71 $105,056 178 $118,070 116 $78,058 41 $29,361 45 $74,310 APPLICATIONS APPROVED, NOT ACCEPTED 1 $62,180 14 $77,789 19 $58,633 10 $28,042 1 $74,150 APPLICATIONS DENIED 6 $94,188 34 $55,956 74 $75,942 36 $21,998 1 $40,570 APPLICATIONS WITHDRAWN 8 $129,681 20 $94,720 40 $72,446 5 $17,688 1 $79,690 FILES CLOSED FOR INCOMPLETENESS 0 $0 3 $92,513 12 $83,202 1 $59,140 0 $0
Aggregated Statistics For Year 1999(Based on 4 partial tracts) A) FHA, FSA/RHS & VA B) Conventional C) Refinancings D) Home Improvement Loans E) Loans on Dwellings For 5+ Families F) Non-occupant Loans on Number Average Value Number Average Value Number Average Value Number Average Value Number Average Value Number Average Value
LOANS ORIGINATED 69 $95,894 182 $115,732 207 $95,697 56 $28,966 1 $131,310 58 $70,649 APPLICATIONS APPROVED, NOT ACCEPTED 1 $74,520 18 $74,552 27 $73,593 9 $41,360 0 $0 1 $103,450 APPLICATIONS DENIED 9 $101,502 53 $73,086 95 $72,655 36 $16,378 0 $0 9 $103,056 APPLICATIONS WITHDRAWN 4 $117,552 25 $113,588 46 $75,332 3 $28,777 0 $0 2 $70,535 FILES CLOSED FOR INCOMPLETENESS 0 $0 5 $78,154 13 $97,398 1 $33,880 0 $0 2 $88,300
Detailed HMDA statistics for the following Tracts:
9604.00
, 9606.00 , 9607.00
Private Mortgage Insurance Companies Aggregated Statistics For Year 2009(Based on 3 partial tracts) A) Conventional B) Refinancings Number Average Value Number Average Value
LOANS ORIGINATED 4 $191,860 4 $175,408 APPLICATIONS APPROVED, NOT ACCEPTED 3 $294,887 2 $126,155 APPLICATIONS DENIED 1 $280,740 0 $0 APPLICATIONS WITHDRAWN 0 $0 0 $0 FILES CLOSED FOR INCOMPLETENESS 0 $0 0 $0
Aggregated Statistics For Year 2008(Based on 3 partial tracts) A) Conventional B) Refinancings C) Non-occupant Loans on Number Average Value Number Average Value Number Average Value
LOANS ORIGINATED 12 $183,632 7 $155,626 2 $93,765 APPLICATIONS APPROVED, NOT ACCEPTED 6 $123,590 8 $160,931 1 $71,940 APPLICATIONS DENIED 2 $53,470 1 $268,800 0 $0 APPLICATIONS WITHDRAWN 2 $117,720 1 $269,190 1 $46,470 FILES CLOSED FOR INCOMPLETENESS 1 $62,900 0 $0 0 $0
Aggregated Statistics For Year 2007(Based on 3 partial tracts) A) Conventional B) Refinancings C) Non-occupant Loans on Number Average Value Number Average Value Number Average Value
LOANS ORIGINATED 45 $162,407 14 $216,527 5 $158,282 APPLICATIONS APPROVED, NOT ACCEPTED 6 $160,472 7 $201,770 1 $204,180 APPLICATIONS DENIED 1 $54,460 0 $0 0 $0 APPLICATIONS WITHDRAWN 1 $125,450 2 $278,145 0 $0 FILES CLOSED FOR INCOMPLETENESS 0 $0 0 $0 0 $0
Aggregated Statistics For Year 2006(Based on 3 partial tracts) A) Conventional B) Refinancings C) Non-occupant Loans on Number Average Value Number Average Value Number Average Value
LOANS ORIGINATED 34 $148,626 10 $155,384 5 $94,496 APPLICATIONS APPROVED, NOT ACCEPTED 5 $132,526 3 $253,950 1 $67,510 APPLICATIONS DENIED 0 $0 0 $0 0 $0 APPLICATIONS WITHDRAWN 0 $0 1 $154,510 0 $0 FILES CLOSED FOR INCOMPLETENESS 0 $0 0 $0 0 $0
Aggregated Statistics For Year 2005(Based on 3 partial tracts) A) Conventional B) Refinancings C) Non-occupant Loans on Number Average Value Number Average Value Number Average Value
LOANS ORIGINATED 24 $173,983 14 $154,300 3 $170,287 APPLICATIONS APPROVED, NOT ACCEPTED 7 $244,711 3 $166,233 0 $0 APPLICATIONS DENIED 0 $0 0 $0 0 $0 APPLICATIONS WITHDRAWN 1 $134,610 0 $0 0 $0 FILES CLOSED FOR INCOMPLETENESS 1 $170,880 0 $0 0 $0
Aggregated Statistics For Year 2004(Based on 3 partial tracts) A) Conventional B) Refinancings C) Non-occupant Loans on Number Average Value Number Average Value Number Average Value
LOANS ORIGINATED 35 $146,840 21 $123,059 11 $110,412 APPLICATIONS APPROVED, NOT ACCEPTED 8 $155,356 6 $164,163 1 $162,690 APPLICATIONS DENIED 0 $0 0 $0 0 $0 APPLICATIONS WITHDRAWN 2 $108,810 3 $187,437 1 $40,240 FILES CLOSED FOR INCOMPLETENESS 0 $0 1 $188,930 0 $0
Aggregated Statistics For Year 2003(Based on 3 partial tracts) A) Conventional B) Refinancings C) Non-occupant Loans on Number Average Value Number Average Value Number Average Value
LOANS ORIGINATED 40 $136,437 44 $144,425 6 $100,397 APPLICATIONS APPROVED, NOT ACCEPTED 3 $132,443 11 $137,450 3 $147,787 APPLICATIONS DENIED 0 $0 3 $145,677 0 $0 APPLICATIONS WITHDRAWN 4 $145,550 4 $180,720 2 $133,965 FILES CLOSED FOR INCOMPLETENESS 0 $0 0 $0 0 $0
Aggregated Statistics For Year 2002(Based on 3 partial tracts) A) Conventional B) Refinancings C) Non-occupant Loans on Number Average Value Number Average Value Number Average Value
LOANS ORIGINATED 45 $131,890 44 $143,588 13 $74,242 APPLICATIONS APPROVED, NOT ACCEPTED 5 $147,728 6 $116,607 1 $90,610 APPLICATIONS DENIED 0 $0 1 $213,770 1 $178,030 APPLICATIONS WITHDRAWN 2 $109,145 3 $147,443 1 $85,340 FILES CLOSED FOR INCOMPLETENESS 0 $0 0 $0 0 $0
Aggregated Statistics For Year 2001(Based on 3 partial tracts) A) Conventional B) Refinancings C) Non-occupant Loans on Number Average Value Number Average Value Number Average Value
LOANS ORIGINATED 57 $136,629 35 $143,891 7 $90,197 APPLICATIONS APPROVED, NOT ACCEPTED 5 $137,574 3 $124,093 1 $82,580 APPLICATIONS DENIED 1 $66,470 1 $64,530 1 $44,370 APPLICATIONS WITHDRAWN 1 $76,560 1 $55,850 0 $0 FILES CLOSED FOR INCOMPLETENESS 0 $0 1 $59,330 1 $59,330
Aggregated Statistics For Year 2000(Based on 3 partial tracts) A) Conventional B) Refinancings C) Non-occupant Loans on Number Average Value Number Average Value Number Average Value
LOANS ORIGINATED 62 $135,097 7 $166,499 4 $91,125 APPLICATIONS APPROVED, NOT ACCEPTED 2 $169,210 1 $104,120 0 $0 APPLICATIONS DENIED 2 $52,570 0 $0 0 $0 APPLICATIONS WITHDRAWN 2 $78,845 0 $0 1 $63,990 FILES CLOSED FOR INCOMPLETENESS 0 $0 0 $0 0 $0
Aggregated Statistics For Year 1999(Based on 4 partial tracts) A) Conventional B) Refinancings C) Non-occupant Loans on Number Average Value Number Average Value Number Average Value
LOANS ORIGINATED 61 $132,841 18 $100,753 2 $93,410 APPLICATIONS APPROVED, NOT ACCEPTED 3 $110,227 2 $88,525 1 $150,800 APPLICATIONS DENIED 3 $85,040 1 $93,530 0 $0 APPLICATIONS WITHDRAWN 2 $176,405 1 $96,780 0 $0 FILES CLOSED FOR INCOMPLETENESS 0 $0 0 $0 0 $0
Detailed PMIC statistics for the following Tracts:
9604.00
, 9606.00 , 9607.00 Fire-safe hotels and motels in Cartersville, Georgia:
Knights Inn, 420 E Church St, Cartersville, Georgia 30121 Phone: (770) 386-7263, Fax: (770) 386-5635
Red Roof Inn, 28 Hwy 20 Spur SE, Cartersville, Georgia 30121 Phone: (770) 387-1800
Best Western Garden Inn & Suites, 5663 Hwy 20 NE, Cartersville, Georgia 30121 Phone: (770) 386-1569, Fax: (770) 386-8720
Country Inn & Suites, 43 SR 20 Spur, Cartersville, Georgia 30121 Phone: (770) 386-5888, Fax: (678) 535-0010
Hampton Inn Cartersville, 5600 Hwy 20 SE, Cartersville, Georgia 30121 Phone: (770) 382-8999, Fax: (770) 383-3000
Sleep Inn, 11 Kent Dr, Cartersville, Georgia 30121 Phone: (770) 386-9259, Fax: (770) 386-9651
America's Best Inns & Suites Cartersville, 35 Carson Loop, Cartersville, Georgia 30121 Phone: (770) 387-9577, Fax: (770) 387-9953
Fairfield Inn & Suites, 20 Canyon Pkwy, Cartersville, Georgia 30120 Phone: (770) 387-0400, Fax: (770) 387-0403
9 other hotels and motels
All 17 fire-safe hotels and motels in Cartersville, Georgia
Most common first names in Cartersville, GA among deceased individuals Name Count Lived (average)
James 303 71.3 years William 254 71.7 years John 237 73.4 years Mary 221 77.5 years Robert 188 70.1 years Charles 109 68.1 years Annie 100 79.9 years George 86 71.1 years Thomas 83 67.7 years Ruby 74 78.3 years
Most common last names in Cartersville, GA among deceased individuals Last name Count Lived (average)
Smith 173 77.6 years Brown 102 71.4 years Johnson 82 68.0 years Jones 78 73.7 years Williams 68 72.9 years Davis 66 76.1 years Wilson 62 72.4 years Harris 61 73.7 years Moore 59 72.4 years Cox 59 76.0 years
Cartersville compared to Georgia state average:
Unemployed percentage below state average. Hispanic race population percentage above state average. Institutionalized population percentage above state average. Cartersville on our top lists :
#32 on the list of "Top 101 cities with the most full-time firefighters per 1000 residents (population 5,000+)"
#40 on the list of "Top 101 counties with highest percentage of residents voting for Romney (Republican) in the 2012 Presidential Election (pop. 50,000+)"
#62 on the list of "Top 101 counties with the smallest number of people without health insurance coverage in 2000 (pop. 50,000+)"
Top Patent Applicants
Pamela Managan Rainey (5)
Andrea Piana (4)
Stacy Arnold (4)
Henry Caughman (4)
Mark Honeycutt (4)
Jeffrey Wright (4)
Gregory Ford (4)
Alejandro Manuel Hernandez (4)
Jeffrey J. Wright (3)
Michael Lippman (3)
Total of 125 patent applications in 2008-2024.
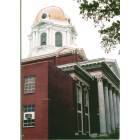
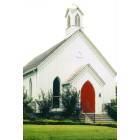
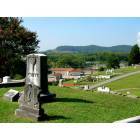


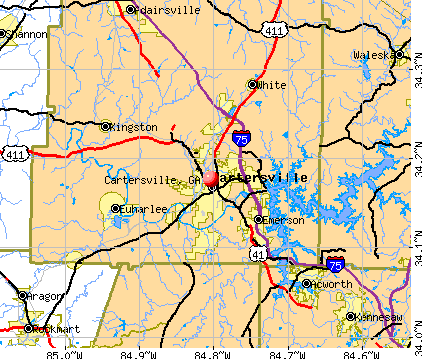


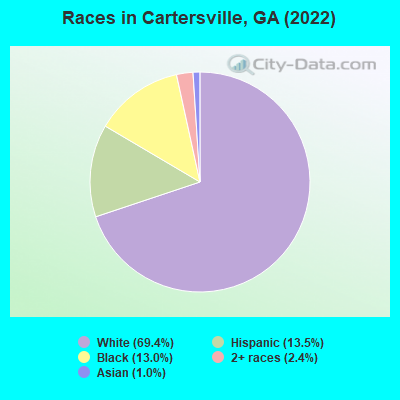
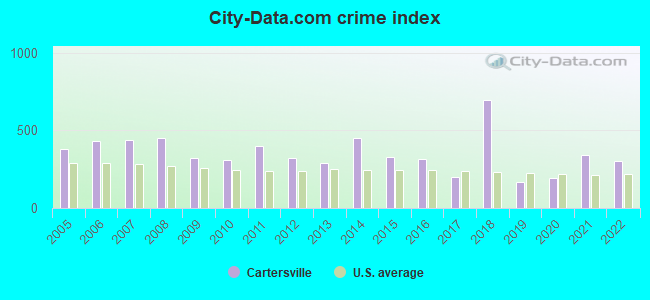
 Recent articles from our blog. Our writers, many of them Ph.D. graduates or candidates, create easy-to-read articles on a wide variety of topics.

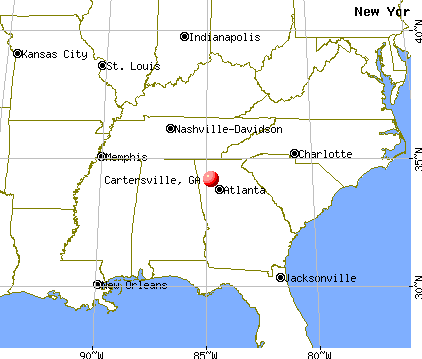
 (21.6 miles
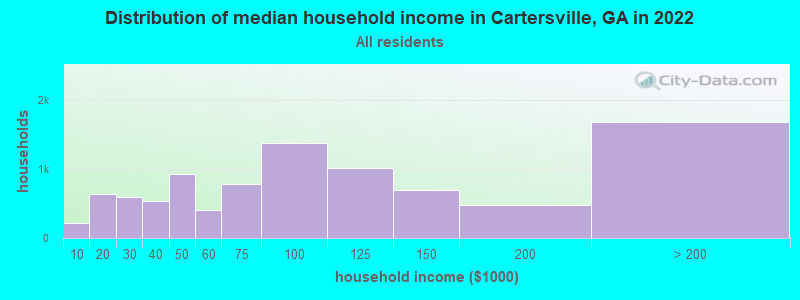
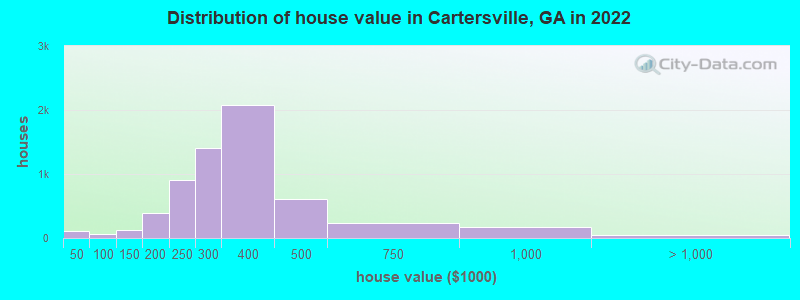
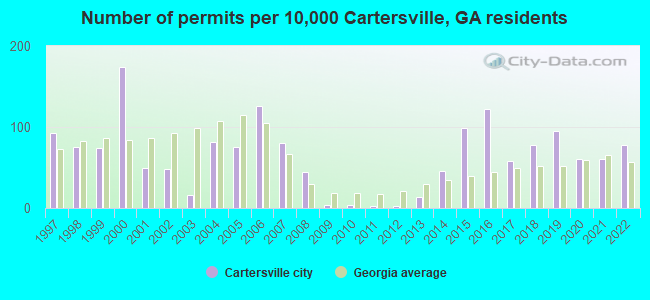
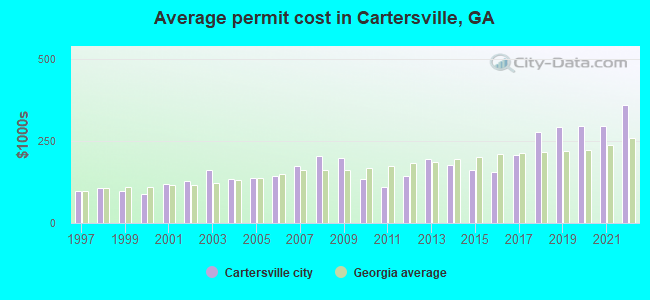
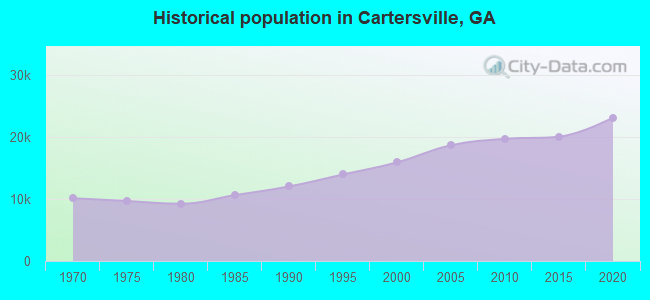
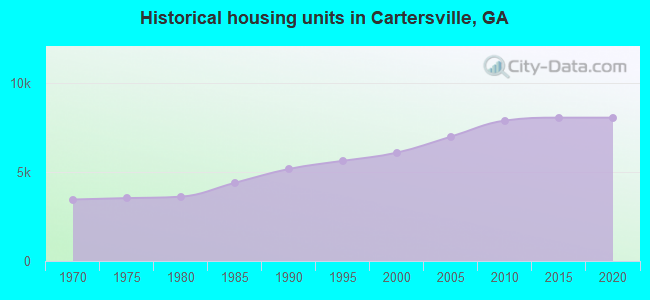
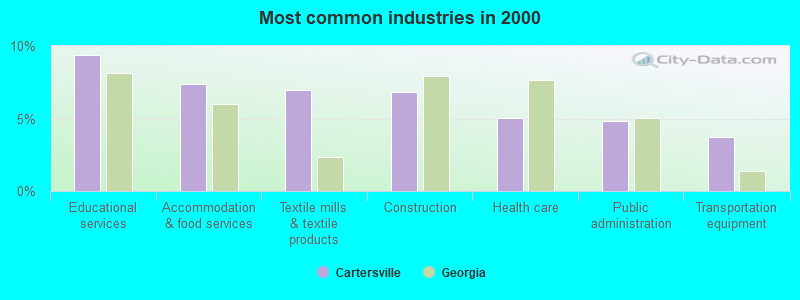
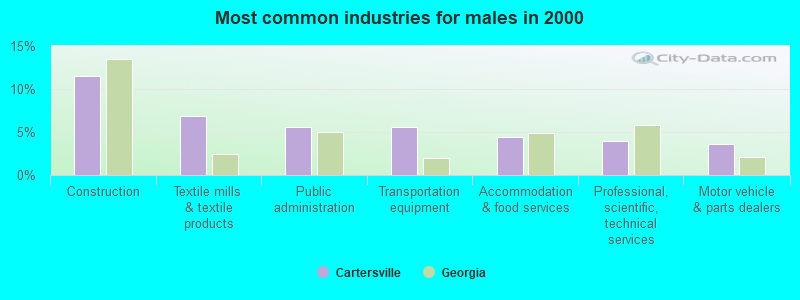
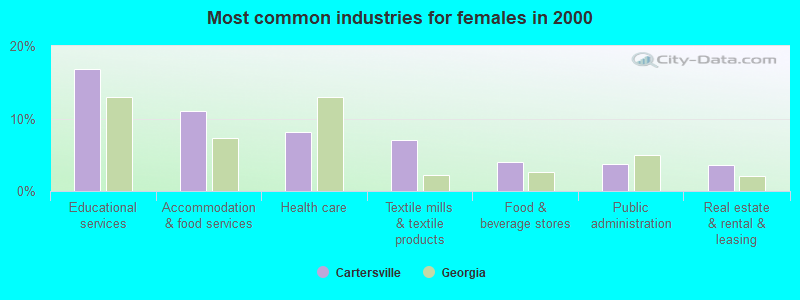
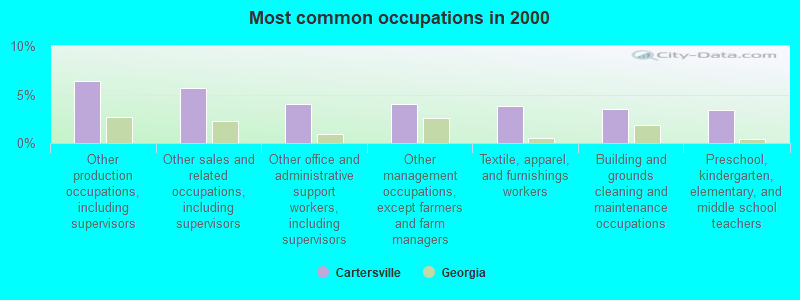
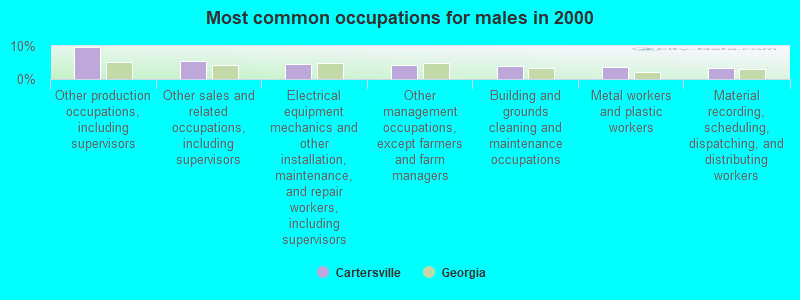
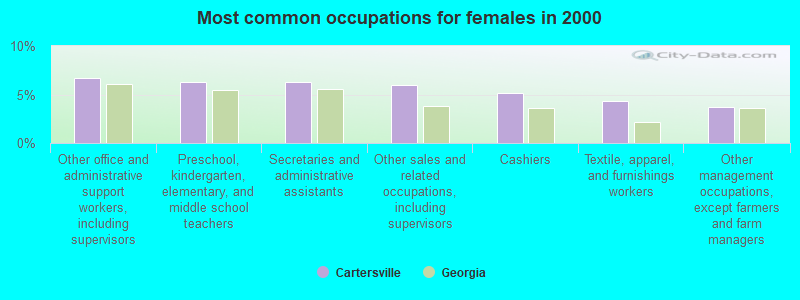


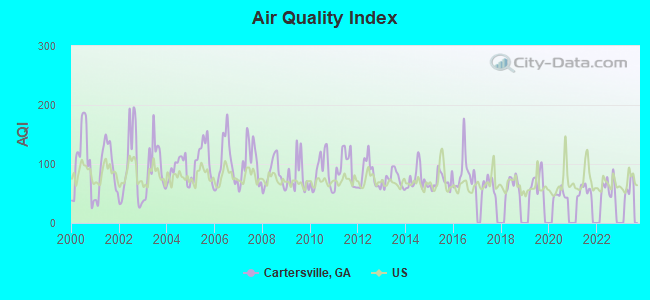
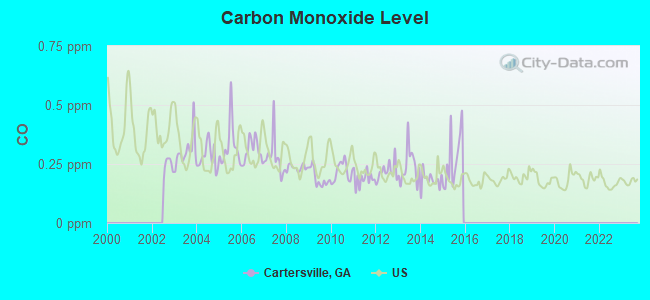
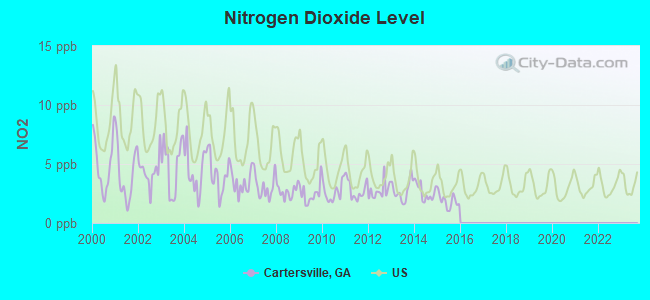
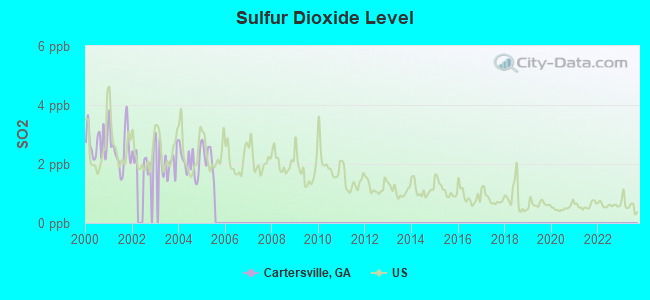
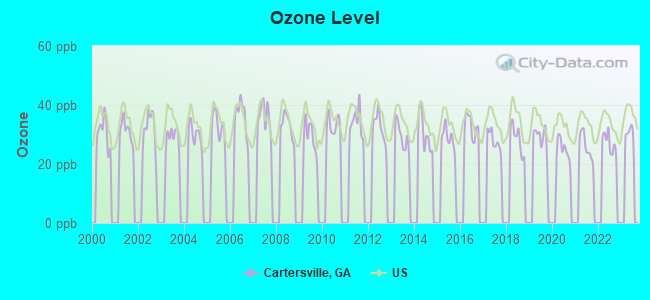
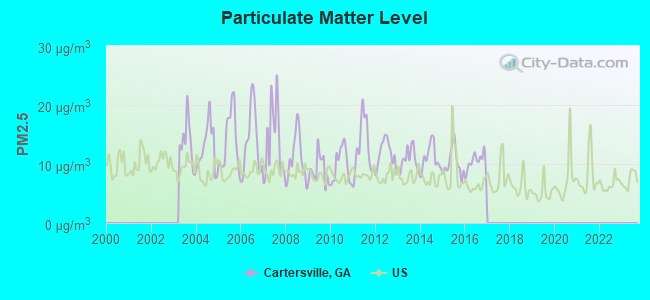
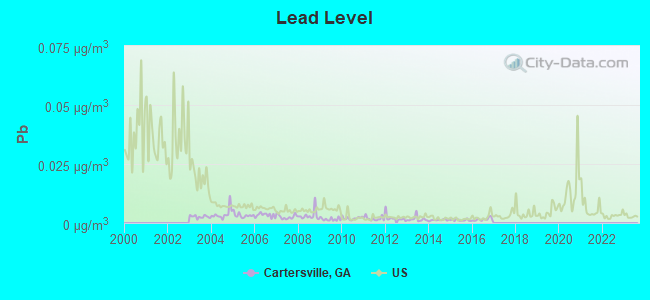

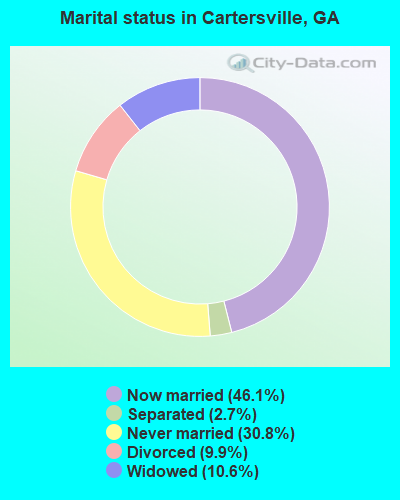
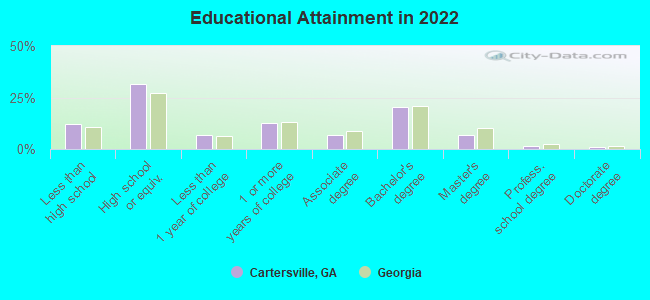
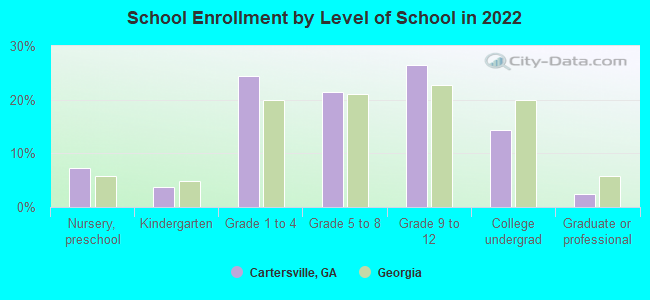
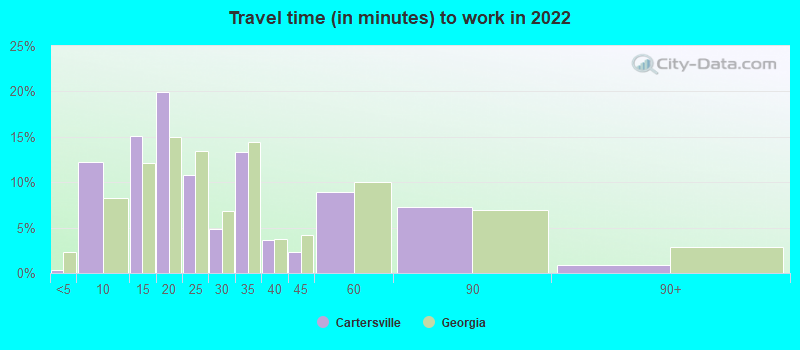
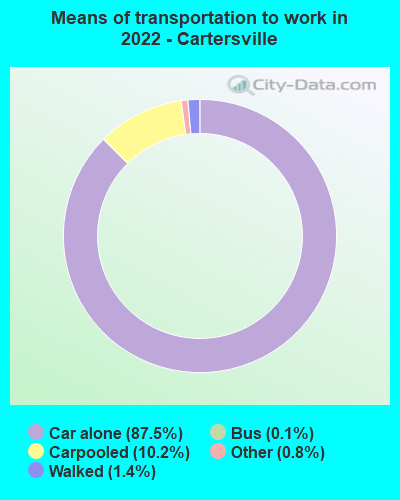
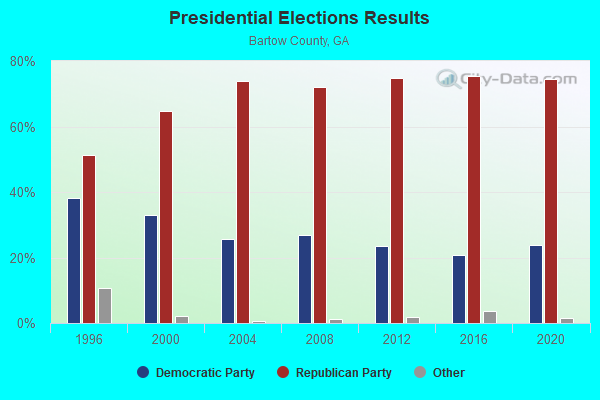
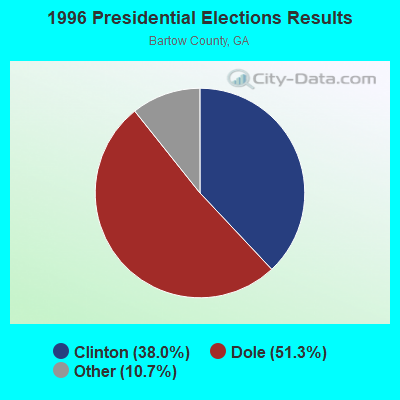
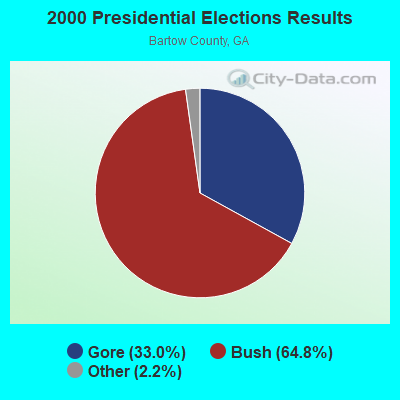
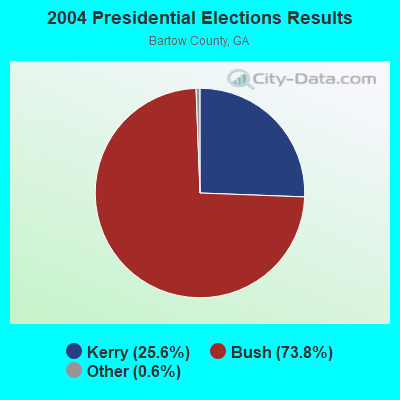
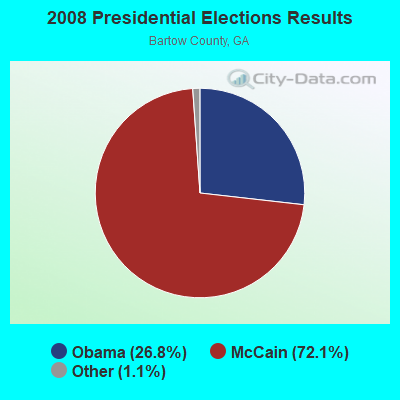
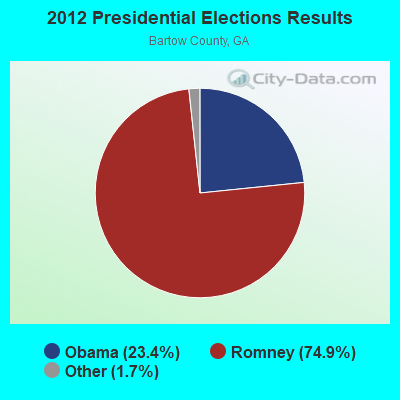
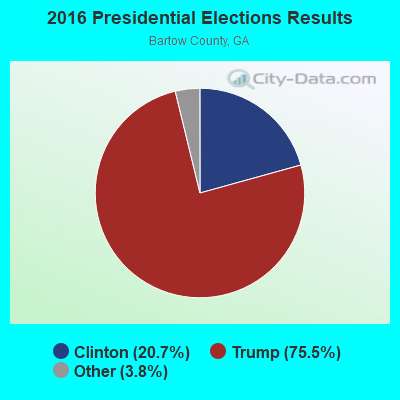
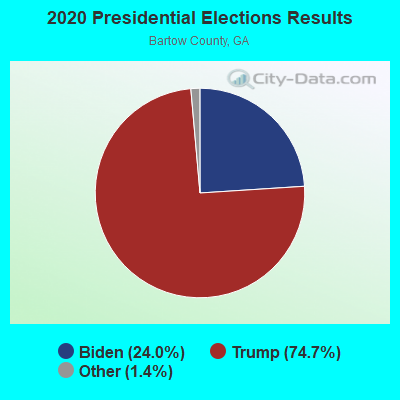
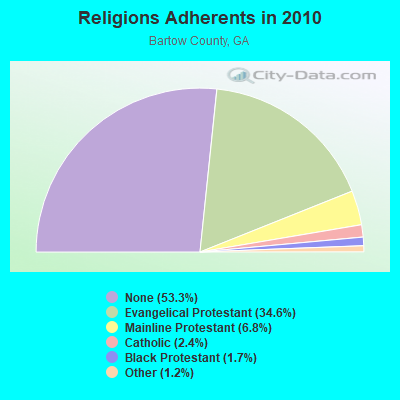
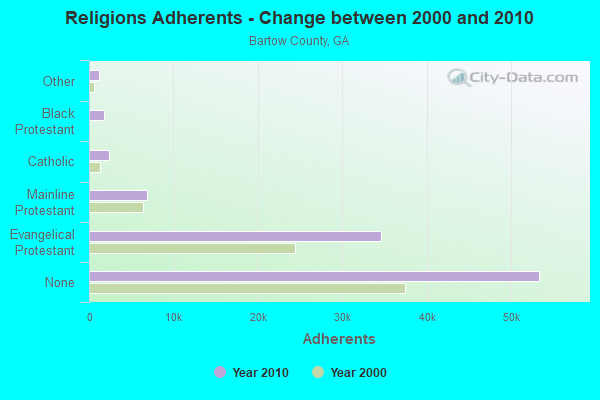
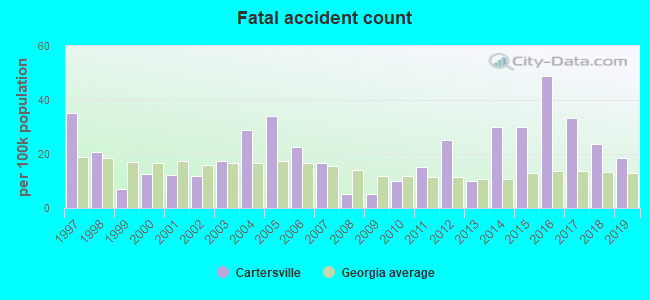
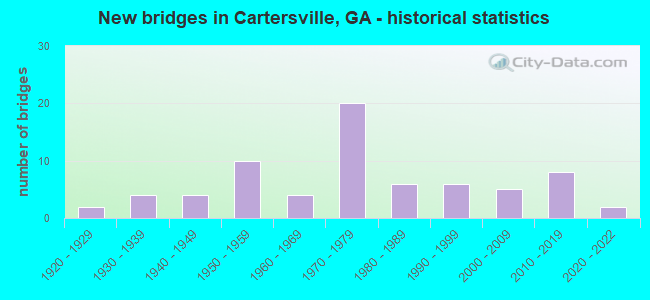
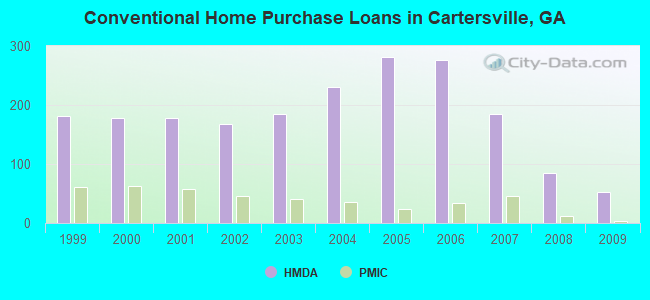
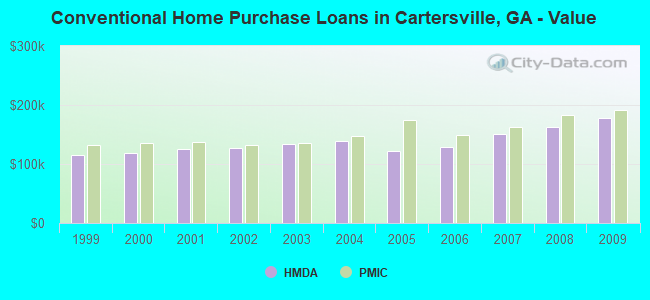
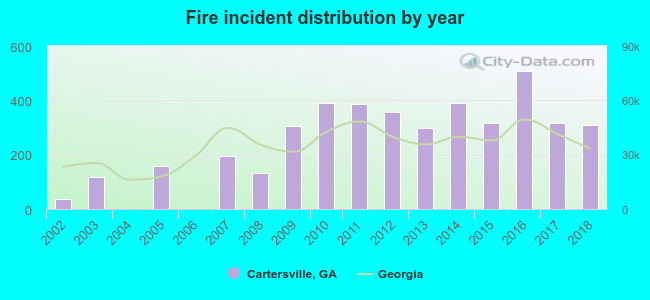 According to the data from the years 2002 - 2018 the average number of fires per year is 248. The highest number of reported fire incidents - 509 took place in 2016, and the least - 0 in 2004. The data has a growing trend.
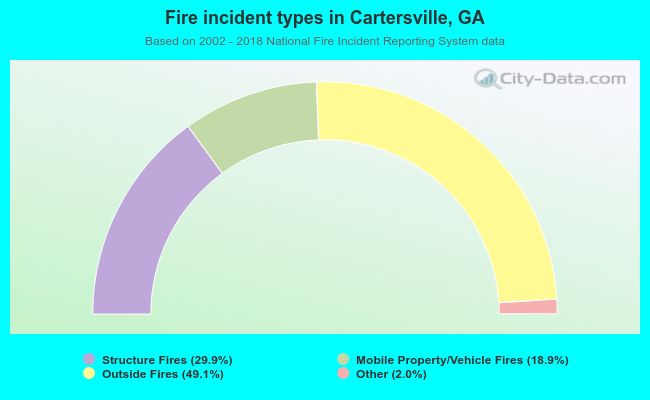 When looking into fire subcategories, the most reports belonged to: Outside Fires (49.1%), and Structure Fires (29.9%).