Estimated zip code population in 2022: 7,075
Zip code population in 2010: 6,847
Zip code population in 2000: 4,890
Houses and condos: 2,603
Renter-occupied apartments: 336
% of renters here:
14%State:
34%
March 2022 cost of living index in zip code 30184: 87.9
(less than average, U.S. average is 100)
Land area: 67.5
sq. mi.
Water area: 2.7
sq. mi.
Population density: 105 people per square mile (very low).
OSM Map
General Map
Google Map
MSN Map
OSM Map
General Map
Google Map
MSN Map
OSM Map
General Map
Google Map
MSN Map
OSM Map
General Map
Google Map
MSN Map
Please wait while loading the map...
Real estate property taxes paid for housing units in 2022:
This zip code:
0.6% ($2,114)Georgia:
0.7% ($2,160)
Median real estate property taxes paid for housing units with mortgages in 2022: $2,057 (0.6%)
Median real estate property taxes paid for housing units with no mortgage in 2022: $2,302 (0.6%)
Profiles of local businesses
Business Search - 14 Million verified businesses
Males: 3,551 Females: 3,524
For population 25 years and over in 30184:
High school or higher: 94.4%Bachelor's degree or higher: 29.6%Graduate or professional degree: 10.3%Unemployed: 4.3%Mean travel time to work (commute): 32.6 minutes
For population 15 years and over in 30184:
Never married: 24.1%Now married: 61.3%Separated: 1.4%Widowed: 6.5%Divorced: 6.7%
Zip code 30184 compared to state average:
Black race population percentage significantly below state average. Hispanic race population percentage significantly below state average. Foreign-born population percentage significantly below state average. Renting percentage significantly below state average. Length of stay since moving in above state average. House age below state average. Number of college students below state average. 6,590 93.2% White 172 2.4% Two or more races 173 2.4% Hispanic or Latino 102 1.4% Black 32 0.5% Asian 5 0.07% Some other race
Data:
Median household income ($)
Median household income (% change since 2000)
Household income diversity
Ratio of average income to average house value (%)
Ratio of average income to average rent
Median household income ($) - White
Median household income ($) - Black or African American
Median household income ($) - Asian
Median household income ($) - Hispanic or Latino
Median household income ($) - American Indian and Alaska Native
Median household income ($) - Multirace
Median household income ($) - Other Race
Median household income for houses/condos with a mortgage ($)
Median household income for apartments without a mortgage ($)
Races - White alone (%)
Races - White alone (% change since 2000)
Races - Black alone (%)
Races - Black alone (% change since 2000)
Races - American Indian alone (%)
Races - American Indian alone (% change since 2000)
Races - Asian alone (%)
Races - Asian alone (% change since 2000)
Races - Hispanic (%)
Races - Hispanic (% change since 2000)
Races - Native Hawaiian and Other Pacific Islander alone (%)
Races - Native Hawaiian and Other Pacific Islander alone (% change since 2000)
Races - Two or more races (%)
Races - Two or more races (% change since 2000)
Races - Other race alone (%)
Races - Other race alone (% change since 2000)
Racial diversity
Unemployment (%)
Unemployment (% change since 2000)
Unemployment (%) - White
Unemployment (%) - Black or African American
Unemployment (%) - Asian
Unemployment (%) - Hispanic or Latino
Unemployment (%) - American Indian and Alaska Native
Unemployment (%) - Multirace
Unemployment (%) - Other Race
Population density (people per square mile)
Population - Males (%)
Population - Females (%)
Population - Males (%) - White
Population - Males (%) - Black or African American
Population - Males (%) - Asian
Population - Males (%) - Hispanic or Latino
Population - Males (%) - American Indian and Alaska Native
Population - Males (%) - Multirace
Population - Males (%) - Other Race
Population - Females (%) - White
Population - Females (%) - Black or African American
Population - Females (%) - Asian
Population - Females (%) - Hispanic or Latino
Population - Females (%) - American Indian and Alaska Native
Population - Females (%) - Multirace
Population - Females (%) - Other Race
Coronavirus confirmed cases (Jun 05, 2024)
Deaths caused by coronavirus (Jun 05, 2024)
Coronavirus confirmed cases (per 100k population) (Jun 05, 2024)
Deaths caused by coronavirus (per 100k population) (Jun 05, 2024)
Daily increase in number of cases (Jun 05, 2024)
Weekly increase in number of cases (Jun 05, 2024)
Cases doubled (in days) (Jun 05, 2024)
Hospitalized patients (Apr 18, 2022)
Negative test results (Apr 18, 2022)
Total test results (Apr 18, 2022)
COVID Vaccine doses distributed (per 100k population) (Sep 19, 2023)
COVID Vaccine doses administered (per 100k population) (Sep 19, 2023)
COVID Vaccine doses distributed (Sep 19, 2023)
COVID Vaccine doses administered (Sep 19, 2023)
Likely homosexual households (%)
Likely homosexual households (% change since 2000)
Likely homosexual households - Lesbian couples (%)
Likely homosexual households - Lesbian couples (% change since 2000)
Likely homosexual households - Gay men (%)
Likely homosexual households - Gay men (% change since 2000)
Cost of living index
Median gross rent ($)
Median contract rent ($)
Median monthly housing costs ($)
Median house or condo value ($)
Median house or condo value ($ change since 2000)
Mean house or condo value by units in structure - 1, detached ($)
Mean house or condo value by units in structure - 1, attached ($)
Mean house or condo value by units in structure - 2 ($)
Mean house or condo value by units in structure by units in structure - 3 or 4 ($)
Mean house or condo value by units in structure - 5 or more ($)
Mean house or condo value by units in structure - Boat, RV, van, etc. ($)
Mean house or condo value by units in structure - Mobile home ($)
Median house or condo value ($) - White
Median house or condo value ($) - Black or African American
Median house or condo value ($) - Asian
Median house or condo value ($) - Hispanic or Latino
Median house or condo value ($) - American Indian and Alaska Native
Median house or condo value ($) - Multirace
Median house or condo value ($) - Other Race
Median resident age
Resident age diversity
Median resident age - Males
Median resident age - Females
Median resident age - White
Median resident age - Black or African American
Median resident age - Asian
Median resident age - Hispanic or Latino
Median resident age - American Indian and Alaska Native
Median resident age - Multirace
Median resident age - Other Race
Median resident age - Males - White
Median resident age - Males - Black or African American
Median resident age - Males - Asian
Median resident age - Males - Hispanic or Latino
Median resident age - Males - American Indian and Alaska Native
Median resident age - Males - Multirace
Median resident age - Males - Other Race
Median resident age - Females - White
Median resident age - Females - Black or African American
Median resident age - Females - Asian
Median resident age - Females - Hispanic or Latino
Median resident age - Females - American Indian and Alaska Native
Median resident age - Females - Multirace
Median resident age - Females - Other Race
Commute - mean travel time to work (minutes)
Travel time to work - Less than 5 minutes (%)
Travel time to work - Less than 5 minutes (% change since 2000)
Travel time to work - 5 to 9 minutes (%)
Travel time to work - 5 to 9 minutes (% change since 2000)
Travel time to work - 10 to 19 minutes (%)
Travel time to work - 10 to 19 minutes (% change since 2000)
Travel time to work - 20 to 29 minutes (%)
Travel time to work - 20 to 29 minutes (% change since 2000)
Travel time to work - 30 to 39 minutes (%)
Travel time to work - 30 to 39 minutes (% change since 2000)
Travel time to work - 40 to 59 minutes (%)
Travel time to work - 40 to 59 minutes (% change since 2000)
Travel time to work - 60 to 89 minutes (%)
Travel time to work - 60 to 89 minutes (% change since 2000)
Travel time to work - 90 or more minutes (%)
Travel time to work - 90 or more minutes (% change since 2000)
Marital status - Never married (%)
Marital status - Now married (%)
Marital status - Separated (%)
Marital status - Widowed (%)
Marital status - Divorced (%)
Median family income ($)
Median family income (% change since 2000)
Median non-family income ($)
Median non-family income (% change since 2000)
Median per capita income ($)
Median per capita income (% change since 2000)
Median family income ($) - White
Median family income ($) - Black or African American
Median family income ($) - Asian
Median family income ($) - Hispanic or Latino
Median family income ($) - American Indian and Alaska Native
Median family income ($) - Multirace
Median family income ($) - Other Race
Median year house/condo built
Median year apartment built
Year house built - Built 2005 or later (%)
Year house built - Built 2000 to 2004 (%)
Year house built - Built 1990 to 1999 (%)
Year house built - Built 1980 to 1989 (%)
Year house built - Built 1970 to 1979 (%)
Year house built - Built 1960 to 1969 (%)
Year house built - Built 1950 to 1959 (%)
Year house built - Built 1940 to 1949 (%)
Year house built - Built 1939 or earlier (%)
Average household size
Household density (households per square mile)
Average household size - White
Average household size - Black or African American
Average household size - Asian
Average household size - Hispanic or Latino
Average household size - American Indian and Alaska Native
Average household size - Multirace
Average household size - Other Race
Occupied housing units (%)
Vacant housing units (%)
Owner occupied housing units (%)
Renter occupied housing units (%)
Vacancy status - For rent (%)
Vacancy status - For sale only (%)
Vacancy status - Rented or sold, not occupied (%)
Vacancy status - For seasonal, recreational, or occasional use (%)
Vacancy status - For migrant workers (%)
Vacancy status - Other vacant (%)
Residents with income below the poverty level (%)
Residents with income below 50% of the poverty level (%)
Children below poverty level (%)
Poor families by family type - Married-couple family (%)
Poor families by family type - Male, no wife present (%)
Poor families by family type - Female, no husband present (%)
Poverty status for native-born residents (%)
Poverty status for foreign-born residents (%)
Poverty among high school graduates not in families (%)
Poverty among people who did not graduate high school not in families (%)
Residents with income below the poverty level (%) - White
Residents with income below the poverty level (%) - Black or African American
Residents with income below the poverty level (%) - Asian
Residents with income below the poverty level (%) - Hispanic or Latino
Residents with income below the poverty level (%) - American Indian and Alaska Native
Residents with income below the poverty level (%) - Multirace
Residents with income below the poverty level (%) - Other Race
Air pollution - Air Quality Index (AQI)
Air pollution - CO
Air pollution - NO2
Air pollution - SO2
Air pollution - Ozone
Air pollution - PM10
Air pollution - PM25
Air pollution - Pb
Crime - Murders per 100,000 population
Crime - Rapes per 100,000 population
Crime - Robberies per 100,000 population
Crime - Assaults per 100,000 population
Crime - Burglaries per 100,000 population
Crime - Thefts per 100,000 population
Crime - Auto thefts per 100,000 population
Crime - Arson per 100,000 population
Crime - City-data.com crime index
Crime - Violent crime index
Crime - Property crime index
Crime - Murders per 100,000 population (5 year average)
Crime - Rapes per 100,000 population (5 year average)
Crime - Robberies per 100,000 population (5 year average)
Crime - Assaults per 100,000 population (5 year average)
Crime - Burglaries per 100,000 population (5 year average)
Crime - Thefts per 100,000 population (5 year average)
Crime - Auto thefts per 100,000 population (5 year average)
Crime - Arson per 100,000 population (5 year average)
Crime - City-data.com crime index (5 year average)
Crime - Violent crime index (5 year average)
Crime - Property crime index (5 year average)
1996 Presidential Elections Results (%) - Democratic Party (Clinton)
1996 Presidential Elections Results (%) - Republican Party (Dole)
1996 Presidential Elections Results (%) - Other
2000 Presidential Elections Results (%) - Democratic Party (Gore)
2000 Presidential Elections Results (%) - Republican Party (Bush)
2000 Presidential Elections Results (%) - Other
2004 Presidential Elections Results (%) - Democratic Party (Kerry)
2004 Presidential Elections Results (%) - Republican Party (Bush)
2004 Presidential Elections Results (%) - Other
2008 Presidential Elections Results (%) - Democratic Party (Obama)
2008 Presidential Elections Results (%) - Republican Party (McCain)
2008 Presidential Elections Results (%) - Other
2012 Presidential Elections Results (%) - Democratic Party (Obama)
2012 Presidential Elections Results (%) - Republican Party (Romney)
2012 Presidential Elections Results (%) - Other
2016 Presidential Elections Results (%) - Democratic Party (Clinton)
2016 Presidential Elections Results (%) - Republican Party (Trump)
2016 Presidential Elections Results (%) - Other
2020 Presidential Elections Results (%) - Democratic Party (Biden)
2020 Presidential Elections Results (%) - Republican Party (Trump)
2020 Presidential Elections Results (%) - Other
Ancestries Reported - Arab (%)
Ancestries Reported - Czech (%)
Ancestries Reported - Danish (%)
Ancestries Reported - Dutch (%)
Ancestries Reported - English (%)
Ancestries Reported - French (%)
Ancestries Reported - French Canadian (%)
Ancestries Reported - German (%)
Ancestries Reported - Greek (%)
Ancestries Reported - Hungarian (%)
Ancestries Reported - Irish (%)
Ancestries Reported - Italian (%)
Ancestries Reported - Lithuanian (%)
Ancestries Reported - Norwegian (%)
Ancestries Reported - Polish (%)
Ancestries Reported - Portuguese (%)
Ancestries Reported - Russian (%)
Ancestries Reported - Scotch-Irish (%)
Ancestries Reported - Scottish (%)
Ancestries Reported - Slovak (%)
Ancestries Reported - Subsaharan African (%)
Ancestries Reported - Swedish (%)
Ancestries Reported - Swiss (%)
Ancestries Reported - Ukrainian (%)
Ancestries Reported - United States (%)
Ancestries Reported - Welsh (%)
Ancestries Reported - West Indian (%)
Ancestries Reported - Other (%)
Educational Attainment - No schooling completed (%)
Educational Attainment - Less than high school (%)
Educational Attainment - High school or equivalent (%)
Educational Attainment - Less than 1 year of college (%)
Educational Attainment - 1 or more years of college (%)
Educational Attainment - Associate degree (%)
Educational Attainment - Bachelor's degree (%)
Educational Attainment - Master's degree (%)
Educational Attainment - Professional school degree (%)
Educational Attainment - Doctorate degree (%)
School Enrollment - Nursery, preschool (%)
School Enrollment - Kindergarten (%)
School Enrollment - Grade 1 to 4 (%)
School Enrollment - Grade 5 to 8 (%)
School Enrollment - Grade 9 to 12 (%)
School Enrollment - College undergrad (%)
School Enrollment - Graduate or professional (%)
School Enrollment - Not enrolled in school (%)
School enrollment - Public schools (%)
School enrollment - Private schools (%)
School enrollment - Not enrolled (%)
Median number of rooms in houses and condos
Median number of rooms in apartments
Housing units lacking complete plumbing facilities (%)
Housing units lacking complete kitchen facilities (%)
Density of houses
Urban houses (%)
Rural houses (%)
Households with people 60 years and over (%)
Households with people 65 years and over (%)
Households with people 75 years and over (%)
Households with one or more nonrelatives (%)
Households with no nonrelatives (%)
Population in households (%)
Family households (%)
Nonfamily households (%)
Population in families (%)
Family households with own children (%)
Median number of bedrooms in owner occupied houses
Mean number of bedrooms in owner occupied houses
Median number of bedrooms in renter occupied houses
Mean number of bedrooms in renter occupied houses
Median number of vehichles in owner occupied houses
Mean number of vehichles in owner occupied houses
Median number of vehichles in renter occupied houses
Mean number of vehichles in renter occupied houses
Mortgage status - with mortgage (%)
Mortgage status - with second mortgage (%)
Mortgage status - with home equity loan (%)
Mortgage status - with both second mortgage and home equity loan (%)
Mortgage status - without a mortgage (%)
Average family size
Average family size - White
Average family size - Black or African American
Average family size - Asian
Average family size - Hispanic or Latino
Average family size - American Indian and Alaska Native
Average family size - Multirace
Average family size - Other Race
Geographical mobility - Same house 1 year ago (%)
Geographical mobility - Moved within same county (%)
Geographical mobility - Moved from different county within same state (%)
Geographical mobility - Moved from different state (%)
Geographical mobility - Moved from abroad (%)
Place of birth - Born in state of residence (%)
Place of birth - Born in other state (%)
Place of birth - Native, outside of US (%)
Place of birth - Foreign born (%)
Housing units in structures - 1, detached (%)
Housing units in structures - 1, attached (%)
Housing units in structures - 2 (%)
Housing units in structures - 3 or 4 (%)
Housing units in structures - 5 to 9 (%)
Housing units in structures - 10 to 19 (%)
Housing units in structures - 20 to 49 (%)
Housing units in structures - 50 or more (%)
Housing units in structures - Mobile home (%)
Housing units in structures - Boat, RV, van, etc. (%)
House/condo owner moved in on average (years ago)
Renter moved in on average (years ago)
Year householder moved into unit - Moved in 1999 to March 2000 (%)
Year householder moved into unit - Moved in 1995 to 1998 (%)
Year householder moved into unit - Moved in 1990 to 1994 (%)
Year householder moved into unit - Moved in 1980 to 1989 (%)
Year householder moved into unit - Moved in 1970 to 1979 (%)
Year householder moved into unit - Moved in 1969 or earlier (%)
Means of transportation to work - Drove car alone (%)
Means of transportation to work - Carpooled (%)
Means of transportation to work - Public transportation (%)
Means of transportation to work - Bus or trolley bus (%)
Means of transportation to work - Streetcar or trolley car (%)
Means of transportation to work - Subway or elevated (%)
Means of transportation to work - Railroad (%)
Means of transportation to work - Ferryboat (%)
Means of transportation to work - Taxicab (%)
Means of transportation to work - Motorcycle (%)
Means of transportation to work - Bicycle (%)
Means of transportation to work - Walked (%)
Means of transportation to work - Other means (%)
Working at home (%)
Industry diversity
Most Common Industries - Agriculture, forestry, fishing and hunting, and mining (%)
Most Common Industries - Agriculture, forestry, fishing and hunting (%)
Most Common Industries - Mining, quarrying, and oil and gas extraction (%)
Most Common Industries - Construction (%)
Most Common Industries - Manufacturing (%)
Most Common Industries - Wholesale trade (%)
Most Common Industries - Retail trade (%)
Most Common Industries - Transportation and warehousing, and utilities (%)
Most Common Industries - Transportation and warehousing (%)
Most Common Industries - Utilities (%)
Most Common Industries - Information (%)
Most Common Industries - Finance and insurance, and real estate and rental and leasing (%)
Most Common Industries - Finance and insurance (%)
Most Common Industries - Real estate and rental and leasing (%)
Most Common Industries - Professional, scientific, and management, and administrative and waste management services (%)
Most Common Industries - Professional, scientific, and technical services (%)
Most Common Industries - Management of companies and enterprises (%)
Most Common Industries - Administrative and support and waste management services (%)
Most Common Industries - Educational services, and health care and social assistance (%)
Most Common Industries - Educational services (%)
Most Common Industries - Health care and social assistance (%)
Most Common Industries - Arts, entertainment, and recreation, and accommodation and food services (%)
Most Common Industries - Arts, entertainment, and recreation (%)
Most Common Industries - Accommodation and food services (%)
Most Common Industries - Other services, except public administration (%)
Most Common Industries - Public administration (%)
Occupation diversity
Most Common Occupations - Management, business, science, and arts occupations (%)
Most Common Occupations - Management, business, and financial occupations (%)
Most Common Occupations - Management occupations (%)
Most Common Occupations - Business and financial operations occupations (%)
Most Common Occupations - Computer, engineering, and science occupations (%)
Most Common Occupations - Computer and mathematical occupations (%)
Most Common Occupations - Architecture and engineering occupations (%)
Most Common Occupations - Life, physical, and social science occupations (%)
Most Common Occupations - Education, legal, community service, arts, and media occupations (%)
Most Common Occupations - Community and social service occupations (%)
Most Common Occupations - Legal occupations (%)
Most Common Occupations - Education, training, and library occupations (%)
Most Common Occupations - Arts, design, entertainment, sports, and media occupations (%)
Most Common Occupations - Healthcare practitioners and technical occupations (%)
Most Common Occupations - Health diagnosing and treating practitioners and other technical occupations (%)
Most Common Occupations - Health technologists and technicians (%)
Most Common Occupations - Service occupations (%)
Most Common Occupations - Healthcare support occupations (%)
Most Common Occupations - Protective service occupations (%)
Most Common Occupations - Fire fighting and prevention, and other protective service workers including supervisors (%)
Most Common Occupations - Law enforcement workers including supervisors (%)
Most Common Occupations - Food preparation and serving related occupations (%)
Most Common Occupations - Building and grounds cleaning and maintenance occupations (%)
Most Common Occupations - Personal care and service occupations (%)
Most Common Occupations - Sales and office occupations (%)
Most Common Occupations - Sales and related occupations (%)
Most Common Occupations - Office and administrative support occupations (%)
Most Common Occupations - Natural resources, construction, and maintenance occupations (%)
Most Common Occupations - Farming, fishing, and forestry occupations (%)
Most Common Occupations - Construction and extraction occupations (%)
Most Common Occupations - Installation, maintenance, and repair occupations (%)
Most Common Occupations - Production, transportation, and material moving occupations (%)
Most Common Occupations - Production occupations (%)
Most Common Occupations - Transportation occupations (%)
Most Common Occupations - Material moving occupations (%)
People in Group quarters - Institutionalized population (%)
People in Group quarters - Correctional institutions (%)
People in Group quarters - Federal prisons and detention centers (%)
People in Group quarters - Halfway houses (%)
People in Group quarters - Local jails and other confinement facilities (including police lockups) (%)
People in Group quarters - Military disciplinary barracks (%)
People in Group quarters - State prisons (%)
People in Group quarters - Other types of correctional institutions (%)
People in Group quarters - Nursing homes (%)
People in Group quarters - Hospitals/wards, hospices, and schools for the handicapped (%)
People in Group quarters - Hospitals/wards and hospices for chronically ill (%)
People in Group quarters - Hospices or homes for chronically ill (%)
People in Group quarters - Military hospitals or wards for chronically ill (%)
People in Group quarters - Other hospitals or wards for chronically ill (%)
People in Group quarters - Hospitals or wards for drug/alcohol abuse (%)
People in Group quarters - Mental (Psychiatric) hospitals or wards (%)
People in Group quarters - Schools, hospitals, or wards for the mentally retarded (%)
People in Group quarters - Schools, hospitals, or wards for the physically handicapped (%)
People in Group quarters - Institutions for the deaf (%)
People in Group quarters - Institutions for the blind (%)
People in Group quarters - Orthopedic wards and institutions for the physically handicapped (%)
People in Group quarters - Wards in general hospitals for patients who have no usual home elsewhere (%)
People in Group quarters - Wards in military hospitals for patients who have no usual home elsewhere (%)
People in Group quarters - Juvenile institutions (%)
People in Group quarters - Long-term care (%)
People in Group quarters - Homes for abused, dependent, and neglected children (%)
People in Group quarters - Residential treatment centers for emotionally disturbed children (%)
People in Group quarters - Training schools for juvenile delinquents (%)
People in Group quarters - Short-term care, detention or diagnostic centers for delinquent children (%)
People in Group quarters - Type of juvenile institution unknown (%)
People in Group quarters - Noninstitutionalized population (%)
People in Group quarters - College dormitories (includes college quarters off campus) (%)
People in Group quarters - Military quarters (%)
People in Group quarters - On base (%)
People in Group quarters - Barracks, unaccompanied personnel housing (UPH), (Enlisted/Officer), ;and similar group living quarters for military personnel (%)
People in Group quarters - Transient quarters for temporary residents (%)
People in Group quarters - Military ships (%)
People in Group quarters - Group homes (%)
People in Group quarters - Homes or halfway houses for drug/alcohol abuse (%)
People in Group quarters - Homes for the mentally ill (%)
People in Group quarters - Homes for the mentally retarded (%)
People in Group quarters - Homes for the physically handicapped (%)
People in Group quarters - Other group homes (%)
People in Group quarters - Religious group quarters (%)
People in Group quarters - Dormitories (%)
People in Group quarters - Agriculture workers' dormitories on farms (%)
People in Group quarters - Job Corps and vocational training facilities (%)
People in Group quarters - Other workers' dormitories (%)
People in Group quarters - Crews of maritime vessels (%)
People in Group quarters - Other nonhousehold living situations (%)
People in Group quarters - Other noninstitutional group quarters (%)
Residents speaking English at home (%)
Residents speaking English at home - Born in the United States (%)
Residents speaking English at home - Native, born elsewhere (%)
Residents speaking English at home - Foreign born (%)
Residents speaking Spanish at home (%)
Residents speaking Spanish at home - Born in the United States (%)
Residents speaking Spanish at home - Native, born elsewhere (%)
Residents speaking Spanish at home - Foreign born (%)
Residents speaking other language at home (%)
Residents speaking other language at home - Born in the United States (%)
Residents speaking other language at home - Native, born elsewhere (%)
Residents speaking other language at home - Foreign born (%)
Class of Workers - Employee of private company (%)
Class of Workers - Self-employed in own incorporated business (%)
Class of Workers - Private not-for-profit wage and salary workers (%)
Class of Workers - Local government workers (%)
Class of Workers - State government workers (%)
Class of Workers - Federal government workers (%)
Class of Workers - Self-employed workers in own not incorporated business and Unpaid family workers (%)
House heating fuel used in houses and condos - Utility gas (%)
House heating fuel used in houses and condos - Bottled, tank, or LP gas (%)
House heating fuel used in houses and condos - Electricity (%)
House heating fuel used in houses and condos - Fuel oil, kerosene, etc. (%)
House heating fuel used in houses and condos - Coal or coke (%)
House heating fuel used in houses and condos - Wood (%)
House heating fuel used in houses and condos - Solar energy (%)
House heating fuel used in houses and condos - Other fuel (%)
House heating fuel used in houses and condos - No fuel used (%)
House heating fuel used in apartments - Utility gas (%)
House heating fuel used in apartments - Bottled, tank, or LP gas (%)
House heating fuel used in apartments - Electricity (%)
House heating fuel used in apartments - Fuel oil, kerosene, etc. (%)
House heating fuel used in apartments - Coal or coke (%)
House heating fuel used in apartments - Wood (%)
House heating fuel used in apartments - Solar energy (%)
House heating fuel used in apartments - Other fuel (%)
House heating fuel used in apartments - No fuel used (%)
Armed forces status - In Armed Forces (%)
Armed forces status - Civilian (%)
Armed forces status - Civilian - Veteran (%)
Armed forces status - Civilian - Nonveteran (%)
Fatal accidents locations in years 2005-2021
Fatal accidents locations in 2005
Fatal accidents locations in 2006
Fatal accidents locations in 2007
Fatal accidents locations in 2008
Fatal accidents locations in 2009
Fatal accidents locations in 2010
Fatal accidents locations in 2011
Fatal accidents locations in 2012
Fatal accidents locations in 2013
Fatal accidents locations in 2014
Fatal accidents locations in 2015
Fatal accidents locations in 2016
Fatal accidents locations in 2017
Fatal accidents locations in 2018
Fatal accidents locations in 2019
Fatal accidents locations in 2020
Fatal accidents locations in 2021
Alcohol use - People drinking some alcohol every month (%)
Alcohol use - People not drinking at all (%)
Alcohol use - Average days/month drinking alcohol
Alcohol use - Average drinks/week
Alcohol use - Average days/year people drink much
Audiometry - Average condition of hearing (%)
Audiometry - People that can hear a whisper from across a quiet room (%)
Audiometry - People that can hear normal voice from across a quiet room (%)
Audiometry - Ears ringing, roaring, buzzing (%)
Audiometry - Had a job exposure to loud noise (%)
Audiometry - Had off-work exposure to loud noise (%)
Blood Pressure & Cholesterol - Has high blood pressure (%)
Blood Pressure & Cholesterol - Checking blood pressure at home (%)
Blood Pressure & Cholesterol - Frequently checking blood cholesterol (%)
Blood Pressure & Cholesterol - Has high cholesterol level (%)
Consumer Behavior - Money monthly spent on food at supermarket/grocery store
Consumer Behavior - Money monthly spent on food at other stores
Consumer Behavior - Money monthly spent on eating out
Consumer Behavior - Money monthly spent on carryout/delivered foods
Consumer Behavior - Income spent on food at supermarket/grocery store (%)
Consumer Behavior - Income spent on food at other stores (%)
Consumer Behavior - Income spent on eating out (%)
Consumer Behavior - Income spent on carryout/delivered foods (%)
Current Health Status - General health condition (%)
Current Health Status - Blood donors (%)
Current Health Status - Has blood ever tested for HIV virus (%)
Current Health Status - Left-handed people (%)
Dermatology - People using sunscreen (%)
Diabetes - Diabetics (%)
Diabetes - Had a blood test for high blood sugar (%)
Diabetes - People taking insulin (%)
Diet Behavior & Nutrition - Diet health (%)
Diet Behavior & Nutrition - Milk product consumption (# of products/month)
Diet Behavior & Nutrition - Meals not home prepared (#/week)
Diet Behavior & Nutrition - Meals from fast food or pizza place (#/week)
Diet Behavior & Nutrition - Ready-to-eat foods (#/month)
Diet Behavior & Nutrition - Frozen meals/pizza (#/month)
Drug Use - People that ever used marijuana or hashish (%)
Drug Use - Ever used hard drugs (%)
Drug Use - Ever used any form of cocaine (%)
Drug Use - Ever used heroin (%)
Drug Use - Ever used methamphetamine (%)
Health Insurance - People covered by health insurance (%)
Kidney Conditions-Urology - Avg. # of times urinating at night
Medical Conditions - People with asthma (%)
Medical Conditions - People with anemia (%)
Medical Conditions - People with psoriasis (%)
Medical Conditions - People with overweight (%)
Medical Conditions - Elderly people having difficulties in thinking or remembering (%)
Medical Conditions - People who ever received blood transfusion (%)
Medical Conditions - People having trouble seeing even with glass/contacts (%)
Medical Conditions - People with arthritis (%)
Medical Conditions - People with gout (%)
Medical Conditions - People with congestive heart failure (%)
Medical Conditions - People with coronary heart disease (%)
Medical Conditions - People with angina pectoris (%)
Medical Conditions - People who ever had heart attack (%)
Medical Conditions - People who ever had stroke (%)
Medical Conditions - People with emphysema (%)
Medical Conditions - People with thyroid problem (%)
Medical Conditions - People with chronic bronchitis (%)
Medical Conditions - People with any liver condition (%)
Medical Conditions - People who ever had cancer or malignancy (%)
Mental Health - People who have little interest in doing things (%)
Mental Health - People feeling down, depressed, or hopeless (%)
Mental Health - People who have trouble sleeping or sleeping too much (%)
Mental Health - People feeling tired or having little energy (%)
Mental Health - People with poor appetite or overeating (%)
Mental Health - People feeling bad about themself (%)
Mental Health - People who have trouble concentrating on things (%)
Mental Health - People moving or speaking slowly or too fast (%)
Mental Health - People having thoughts they would be better off dead (%)
Oral Health - Average years since last visit a dentist
Oral Health - People embarrassed because of mouth (%)
Oral Health - People with gum disease (%)
Oral Health - General health of teeth and gums (%)
Oral Health - Average days a week using dental floss/device
Oral Health - Average days a week using mouthwash for dental problem
Oral Health - Average number of teeth
Pesticide Use - Households using pesticides to control insects (%)
Pesticide Use - Households using pesticides to kill weeds (%)
Physical Activity - People doing vigorous-intensity work activities (%)
Physical Activity - People doing moderate-intensity work activities (%)
Physical Activity - People walking or bicycling (%)
Physical Activity - People doing vigorous-intensity recreational activities (%)
Physical Activity - People doing moderate-intensity recreational activities (%)
Physical Activity - Average hours a day doing sedentary activities
Physical Activity - Average hours a day watching TV or videos
Physical Activity - Average hours a day using computer
Physical Functioning - People having limitations keeping them from working (%)
Physical Functioning - People limited in amount of work they can do (%)
Physical Functioning - People that need special equipment to walk (%)
Physical Functioning - People experiencing confusion/memory problems (%)
Physical Functioning - People requiring special healthcare equipment (%)
Prescription Medications - Average number of prescription medicines taking
Preventive Aspirin Use - Adults 40+ taking low-dose aspirin (%)
Reproductive Health - Vaginal deliveries (%)
Reproductive Health - Cesarean deliveries (%)
Reproductive Health - Deliveries resulted in a live birth (%)
Reproductive Health - Pregnancies resulted in a delivery (%)
Reproductive Health - Women breastfeeding newborns (%)
Reproductive Health - Women that had a hysterectomy (%)
Reproductive Health - Women that had both ovaries removed (%)
Reproductive Health - Women that have ever taken birth control pills (%)
Reproductive Health - Women taking birth control pills (%)
Reproductive Health - Women that have ever used Depo-Provera or injectables (%)
Reproductive Health - Women that have ever used female hormones (%)
Sexual Behavior - People 18+ that ever had sex (vaginal, anal, or oral) (%)
Sexual Behavior - Males 18+ that ever had vaginal sex with a woman (%)
Sexual Behavior - Males 18+ that ever performed oral sex on a woman (%)
Sexual Behavior - Males 18+ that ever had anal sex with a woman (%)
Sexual Behavior - Males 18+ that ever had any sex with a man (%)
Sexual Behavior - Females 18+ that ever had vaginal sex with a man (%)
Sexual Behavior - Females 18+ that ever performed oral sex on a man (%)
Sexual Behavior - Females 18+ that ever had anal sex with a man (%)
Sexual Behavior - Females 18+ that ever had any kind of sex with a woman (%)
Sexual Behavior - Average age people first had sex
Sexual Behavior - Average number of female sex partners in lifetime (males 18+)
Sexual Behavior - Average number of female vaginal sex partners in lifetime (males 18+)
Sexual Behavior - Average age people first performed oral sex on a woman (18+)
Sexual Behavior - Average number of woman performed oral sex on in lifetime (18+)
Sexual Behavior - Average number of male sex partners in lifetime (males 18+)
Sexual Behavior - Average number of male anal sex partners in lifetime (males 18+)
Sexual Behavior - Average age people first performed oral sex on a man (18+)
Sexual Behavior - Average number of male oral sex partners in lifetime (18+)
Sexual Behavior - People using protection when performing oral sex (%)
Sexual Behavior - Average number of times people have vaginal or anal sex a year
Sexual Behavior - People having sex without condom (%)
Sexual Behavior - Average number of male sex partners in lifetime (females 18+)
Sexual Behavior - Average number of male vaginal sex partners in lifetime (females 18+)
Sexual Behavior - Average number of female sex partners in lifetime (females 18+)
Sexual Behavior - Circumcised males 18+ (%)
Sleep Disorders - Average hours sleeping at night
Sleep Disorders - People that has trouble sleeping (%)
Smoking-Cigarette Use - People smoking cigarettes (%)
Taste & Smell - People 40+ having problems with smell (%)
Taste & Smell - People 40+ having problems with taste (%)
Taste & Smell - People 40+ that ever had wisdom teeth removed (%)
Taste & Smell - People 40+ that ever had tonsils teeth removed (%)
Taste & Smell - People 40+ that ever had a loss of consciousness because of a head injury (%)
Taste & Smell - People 40+ that ever had a broken nose or other serious injury to face or skull (%)
Taste & Smell - People 40+ that ever had two or more sinus infections (%)
Weight - Average height (inches)
Weight - Average weight (pounds)
Weight - Average BMI
Weight - People that are obese (%)
Weight - People that ever were obese (%)
Weight - People trying to lose weight (%)
100%
rural population.
Estimated median house/condo value in 2022: $336,949
30184:
$336,949Georgia:
$297,400
According to our research of Georgia and other state lists, there were 11 registered sex offenders living in 30184 zip code as of June 04, 2024 . The ratio of all residents to sex offenders in zip code 30184 is 647 to 1.The ratio of registered sex offenders to all residents in this zip code is lower than the state average.
Median resident age: This zip code:
39.9 yearsGeorgia median age:
37.6 years
Average household size: This zip code:
2.9 peopleGeorgia:
2.6 people
Averages for the 2020 tax year for zip code 30184, filed in 2021:
Average Adjusted Gross Income (AGI) in 2020: $80,742 (Individual Income Tax Returns) Here:
$80,742State:
$70,847
Salary/wage: $65,870 (reported on 82.1% of returns )Here:
$65,870State:
$59,126
(% of AGI for various income ranges: 1089.5% for AGIs below $25k , 3751.6% for AGIs $25k-50k , 6768.5% for AGIs $50k-75k , 9952.5% for AGIs $75k-100k , 18635.6% for AGIs $100k-200k , 73451.7% for AGIs over 200k ) Taxable interest for individuals: $1,224 (reported on 25.6% of returns )This zip code:
$1,224Georgia:
$2,011
(% of AGI for various income ranges: 10.8% for AGIs below $25k , 22.5% for AGIs $25k-50k , 24.7% for AGIs $50k-75k , 12.5% for AGIs $75k-100k , 63.8% for AGIs $100k-200k , 876.7% for AGIs over 200k ) Ordinary dividends: $4,960 (reported on 17.6% of returns )(% of AGI for various income ranges: 21.8% for AGIs below $25k , 31.4% for AGIs $25k-50k , 114.1% for AGIs $50k-75k , 82.9% for AGIs $75k-100k , 180.0% for AGIs $100k-200k , 2395.0% for AGIs over 200k ) Net capital gain/loss in AGI: +$13,277 (reported on 15.6% of returns )Here:
+$13,277State:
+$28,402
(% of AGI for various income ranges: 12.2% for AGIs below $25k , 21.8% for AGIs $25k-50k , 93.5% for AGIs $50k-75k , 68.3% for AGIs $75k-100k , 448.2% for AGIs $100k-200k , 8028.3% for AGIs over 200k ) Profit/loss from business: +$9,545 (reported on 19.1% of returns )Here:
+$9,545State:
+$6,707
(% of AGI for various income ranges: 161.8% for AGIs below $25k , 150.5% for AGIs $25k-50k , 234.7% for AGIs $50k-75k , 301.7% for AGIs $75k-100k , 464.7% for AGIs $100k-200k , 1745.0% for AGIs over 200k ) Taxable individual retirement arrangement distribution: $20,704 (reported on 8.2% of returns )30184:
$20,704Georgia:
$20,525
(% of AGI for various income ranges: 66.9% for AGIs below $25k , 117.2% for AGIs $25k-50k , 198.2% for AGIs $50k-75k , 375.8% for AGIs $75k-100k , 702.6% for AGIs $100k-200k , 1115.0% for AGIs over 200k ) Total itemized deductions: $32,764 (reported on 12.4% of returns )Here:
$32,764State:
$34,001
(% of AGI for various income ranges: 152.6% for AGIs $25k-50k , 391.5% for AGIs $50k-75k , 505.0% for AGIs $75k-100k , 1412.9% for AGIs $100k-200k , 9240.0% for AGIs over 200k ) Charity contributions: $13,140 (reported on 10.3% of returns )Here:
$13,140State:
$14,164
(% of AGI for various income ranges: 18.5% for AGIs below $25k , 60.3% for AGIs $50k-75k , 92.9% for AGIs $75k-100k , 427.1% for AGIs $100k-200k , 4303.3% for AGIs over 200k ) Taxes paid: $7,924 (reported on 12.1% of returns )(% of AGI for various income ranges: 31.9% for AGIs $25k-50k , 96.2% for AGIs $50k-75k , 135.8% for AGIs $75k-100k , 388.8% for AGIs $100k-200k , 1820.0% for AGIs over 200k ) Earned income credit: $2,064 (reported on 15.6% of returns )(% of AGI for various income ranges: 87.8% for AGIs below $25k , 77.9% for AGIs $25k-50k ) Percentage of individuals using paid preparers for their 2020 taxes: 94.7%(% for various income ranges: 94.9% for AGIs below $25k , 94.7% for AGIs $25k-50k , 94.0% for AGIs $50k-75k , 94.4% for AGIs $75k-100k , 94.9% for AGIs $100k-200k , 95.2% for AGIs over 200k )
Averages for the 2012 tax year for zip code 30184, filed in 2013:
Average Adjusted Gross Income (AGI) in 2012: $57,601 (Individual Income Tax Returns) Here:
$57,601State:
$56,131
Salary/wage: $51,172 (reported on 84.2% of returns )Here:
$51,172State:
$47,942
(% of AGI for various income ranges: 69.5% for AGIs below $25k , 80.9% for AGIs $25k-50k , 81.9% for AGIs $50k-75k , 77.7% for AGIs $75k-100k , 81.4% for AGIs $100k-200k , 50.9% for AGIs over 200k ) Taxable interest for individuals: $1,080 (reported on 28.3% of returns )This zip code:
$1,080Georgia:
$1,706
(% of AGI for various income ranges: 1.0% for AGIs below $25k , 0.7% for AGIs $25k-50k , 0.2% for AGIs $50k-75k , 0.2% for AGIs $75k-100k , 0.5% for AGIs $100k-200k , 0.9% for AGIs over 200k ) Ordinary dividends: $3,434 (reported on 16.8% of returns )(% of AGI for various income ranges: 1.0% for AGIs below $25k , 0.7% for AGIs $25k-50k , 0.5% for AGIs $50k-75k , 1.3% for AGIs $75k-100k , 1.2% for AGIs $100k-200k , 1.1% for AGIs over 200k ) Net capital gain/loss in AGI: +$2,918 (reported on 12.2% of returns )Here:
+$2,918State:
+$16,323
(% of AGI for various income ranges: 0.2% for AGIs $25k-50k , 0.1% for AGIs $50k-75k , 0.5% for AGIs $100k-200k , 2.8% for AGIs over 200k ) Profit/loss from business: +$6,402 (reported on 19.4% of returns )Here:
+$6,402State:
+$7,583
(% of AGI for various income ranges: 11.6% for AGIs below $25k , 2.3% for AGIs $25k-50k , 1.1% for AGIs $50k-75k , 1.8% for AGIs $75k-100k , 1.8% for AGIs $100k-200k ) Taxable individual retirement arrangement distribution: $15,735 (reported on 8.2% of returns )30184:
$15,735Georgia:
$17,199
(% of AGI for various income ranges: 3.9% for AGIs below $25k , 2.2% for AGIs $25k-50k , 2.2% for AGIs $50k-75k , 2.9% for AGIs $75k-100k , 2.8% for AGIs $100k-200k ) Total itemized deductions: $21,193 (22% of AGI, reported on 41.6% of returns )Here:
$21,193State:
$23,886
Here:
21.9% of AGIState:
21.5% of AGI
(% of AGI for various income ranges: 9.7% for AGIs below $25k , 13.3% for AGIs $25k-50k , 16.8% for AGIs $50k-75k , 17.4% for AGIs $75k-100k , 16.8% for AGIs $100k-200k , 13.4% for AGIs over 200k ) Charity contributions: $4,323 (reported on 33.7% of returns )(% of AGI for various income ranges: 0.9% for AGIs below $25k , 1.8% for AGIs $25k-50k , 2.3% for AGIs $50k-75k , 2.5% for AGIs $75k-100k , 2.7% for AGIs $100k-200k , 3.8% for AGIs over 200k ) Taxes paid: $6,450 (reported on 41.2% of returns )(% of AGI for various income ranges: 1.4% for AGIs below $25k , 2.5% for AGIs $25k-50k , 4.0% for AGIs $50k-75k , 5.0% for AGIs $75k-100k , 5.9% for AGIs $100k-200k , 5.8% for AGIs over 200k ) Earned income credit: $2,177 (reported on 20.4% of returns )(% of AGI for various income ranges: 8.2% for AGIs below $25k , 1.3% for AGIs $25k-50k ) Percentage of individuals using paid preparers for their 2012 taxes: 59.9%(% for various income ranges: 60.0% for AGIs below $25k , 60.3% for AGIs $25k-50k , 58.1% for AGIs $50k-75k , 59.4% for AGIs $75k-100k , 58.8% for AGIs $100k-200k , 71.4% for AGIs over 200k )
Averages for the 2004 tax year for zip code 30184, filed in 2005:
Average Adjusted Gross Income (AGI) in 2004: $48,640 (Individual Income Tax Returns) Here:
$48,640State:
$47,553
Salary/wage: $45,066 (reported on 86.5% of returns )Here:
$45,066State:
$42,178
(% of AGI for various income ranges: 128.0% for AGIs below $10k , 80.5% for AGIs $10k-25k , 84.6% for AGIs $25k-50k , 87.6% for AGIs $50k-75k , 83.9% for AGIs $75k-100k , 67.8% for AGIs over 100k ) Taxable interest for individuals: $1,543 (reported on 36.2% of returns )This zip code:
$1,543Georgia:
$1,772
(% of AGI for various income ranges: 4.0% for AGIs below $10k , 1.6% for AGIs $10k-25k , 0.9% for AGIs $25k-50k , 0.9% for AGIs $50k-75k , 0.4% for AGIs $75k-100k , 1.7% for AGIs over 100k ) Taxable dividends: $1,988 (reported on 17.2% of returns )(% of AGI for various income ranges: 1.4% for AGIs below $10k , 0.6% for AGIs $10k-25k , 0.5% for AGIs $25k-50k , 0.3% for AGIs $50k-75k , 0.5% for AGIs $75k-100k , 1.2% for AGIs over 100k ) Net capital gain/loss: +$7,372 (reported on 12.1% of returns )Here:
+$7,372State:
+$16,461
(% of AGI for various income ranges: 2.0% for AGIs below $10k , 0.5% for AGIs $10k-25k , -0.1% for AGIs $25k-50k , 1.2% for AGIs $50k-75k , 1.8% for AGIs $75k-100k , 3.8% for AGIs over 100k ) Profit/loss from business: +$8,545 (reported on 19.2% of returns )Here:
+$8,545State:
+$8,201
(% of AGI for various income ranges: 18.8% for AGIs below $10k , 5.2% for AGIs $10k-25k , 3.2% for AGIs $25k-50k , 1.8% for AGIs $50k-75k , 2.2% for AGIs $75k-100k , 4.2% for AGIs over 100k ) Profit/loss from farming: +$300 (reported on 0.8% of returns )
Here : State :
IRA payment deduction: $2,889 (reported on 1.8% of returns )30184:
$2,889Georgia:
$2,969
Self-employed pension: $16,417 (reported on 0.5% of returns )Here:
$16,417Georgia:
$16,203
Total itemized deductions: $18,527 (24% of AGI, reported on 45.4% of returns )Here:
$18,527State:
$19,944
Here:
23.6% of AGIState:
22.6% of AGI
(% of AGI for various income ranges: 17.1% for AGIs below $10k , 11.0% for AGIs $10k-25k , 16.1% for AGIs $25k-50k , 19.6% for AGIs $50k-75k , 19.4% for AGIs $75k-100k , 16.4% for AGIs over 100k ) Charity contributions deductions: $3,157 (4% of AGI, reported on 40.3% of returns )Here:
3.9% of AGIState:
4.7% of AGI
(% of AGI for various income ranges: 1.0% for AGIs below $10k , 1.2% for AGIs $10k-25k , 1.9% for AGIs $25k-50k , 2.6% for AGIs $50k-75k , 2.8% for AGIs $75k-100k , 3.3% for AGIs over 100k ) Total tax: $6,859 (reported on 76.7% of returns )(% of AGI for various income ranges: 5.3% for AGIs below $10k , 4.2% for AGIs $10k-25k , 6.1% for AGIs $25k-50k , 8.0% for AGIs $50k-75k , 9.8% for AGIs $75k-100k , 17.8% for AGIs over 100k ) Earned income credit: $1,694 (reported on 16.2% of returns )Percentage of individuals using paid preparers for their 2004 taxes: 64.7%(% for various income ranges: 56.9% for AGIs below $10k , 71.4% for AGIs $10k-25k , 67.0% for AGIs $25k-50k , 64.3% for AGIs $50k-75k , 61.1% for AGIs $75k-100k , 65.9% for AGIs over 100k )
Estimated median household income in 2022: This zip code:
$104,138Georgia:
$72,837
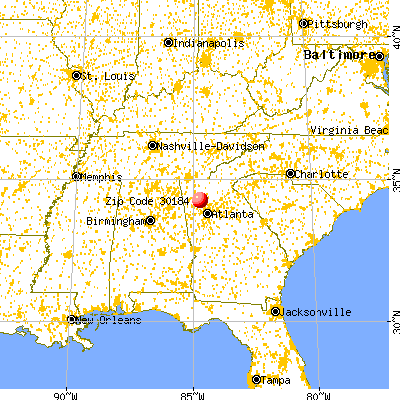
Nearest zip codes: 30121 ,
30171 ,
30137 ,
30120 ,
30183 ,
30102 .
Cartersville Zip Code Map
Percentage of family households: This zip code:
53.5%Georgia:
48.5%
Percentage of households with unmarried partners: This zip code:
8.3%Georgia:
46.9%
Likely homosexual households (counted as self-reported same-sex unmarried-partner households)
Lesbian couples: 0.4% of all households Gay men: 0.0% of all households
Household received Food Stamps/SNAP in the past 12 months: 119Household did not receive Food Stamps/SNAP in the past 12 months: 2,309
Women who had a birth in the past 12 months: 46 (44 now married , 2 unmarried) Women who did not have a birth in the past 12 months: 1,365 (830 now married , 532 unmarried)
Housing units in zip code 30184 with a mortgage: 1,482 (137
second mortgage , 141
both second mortgage and home equity loan )
Houses without a mortgage: 51
Median monthly owner costs for units with a mortgage: $1,413
Median monthly owner costs for units without a mortgage: $519
Residents with income below the poverty level in 2022:
This zip code:
5.2%Whole state:
12.7%
Residents with income below 50% of the poverty level in 2022:
This zip code:
2.9%Whole state:
6.3%
Median number of rooms in houses and condos: Median number of rooms in apartments: Notable locations in this zip code not listed on our city pages
Click to draw/clear zip code borders Notable locations in zip code 30184: (A) , Upper Stamp Creek Campground (B) , Wilderness Camp (C) , Allatoona Lake Dam and Powerhouse (D) , Bartow County Fire Department Station 13 (E) , Bartow County Fire Department Station 5 (F) . Display/hide their locations on the map
Churches in zip code 30184 include: (A) , Dewey Church (B) , Millers Chapel (C) , Mount Olive Church (D) , Mount Zion Church (E) , Woffords Crossroads Church (F) , Stamp Creek Church (G) , Towe Chapel (H) . Display/hide their locations on the map
Cemeteries: (1) , Mount Zion Baptist Church Cemetery (2) , Old Macedonia Cemetery (3) , Shinall Cemetery (4) , Chitwood Cemetery (5) , Hayes Cemetery (6) , Furnace-Goodson Cemetery (7) . Display/hide their locations on the map
Reservoirs: (A) , Allatoona Lake (B) , Upper Aubrey Lake (C) , Richards Lake (D) , Vaughn Lake (E) . Display/hide their locations on the map
Streams, rivers, and creeks: (A) , Wildcat Branch (B) , Illinois Creek (C) , Hawks Branch (D) , Guthrie Creek (E) , Davis Branch (F) , Clear Creek (G) , Bowen Branch (H) , Boston Creek (I) . Display/hide their locations on the map
Year house built (houses)
22 2020 or later290 2010 to 2019849 2000 to 2009728 1990 to 1999185 1980 to 1989223 1970 to 197970 1960 to 196988 1950 to 195968 1940 to 194922 1939 or earlier
Zip code 30184 household income distribution in 2022 104 Less than $10,00071 $10,000 to $14,99964 $15,000 to $19,99947 $20,000 to $24,99989 $25,000 to $29,99925 $30,000 to $34,99924 $35,000 to $39,99990 $40,000 to $44,99944 $45,000 to $49,999134 $50,000 to $59,999292 $60,000 to $74,999219 $75,000 to $99,999417 $100,000 to $124,999257 $125,000 to $149,999363 $150,000 to $199,999215 $200,000 or moreEstimate of home value of owner-occupied houses/condos in 2022 in zip code 30184 2 Less than $10,0001 $20,000 to $24,9991 $25,000 to $29,99934 $35,000 to $39,99914 $40,000 to $49,9999 $60,000 to $69,99952 $70,000 to $79,99915 $80,000 to $89,9997 $90,000 to $99,99938 $100,000 to $124,99929 $125,000 to $149,99994 $150,000 to $174,99972 $175,000 to $199,999280 $200,000 to $249,999422 $250,000 to $299,999507 $300,000 to $399,999354 $400,000 to $499,999212 $500,000 to $749,99931 $1,000,000 to $1,499,99928 $1,500,000 to $1,999,999Rent paid by renters in 2022 in zip code 30184 20 $300 to $34933 $400 to $44911 $450 to $49984 $500 to $54915 $550 to $59924 $650 to $69912 $700 to $7495 $750 to $79914 $800 to $8993 $1,000 to $1,24933 $1,250 to $1,49930 $1,500 to $1,99922 $2,000 to $2,49945 No cash rent
Median gross rent in 2022: $841.
Median price asked for vacant for-sale houses and condos in 2022: $778,927.
Estimated median house (or condo) value in 2022 for: White Non-Hispanic householders: $382,312Black or African American householders: $227,638American Indian or Alaska Native householders: $322,191Some other race householders: $177,628Two or more races householders: $259,611Hispanic or Latino householders: $421,390Estimated median house or condo value in 2022: $336,949
30184:
$336,949Georgia:
$297,400
Lower value quartile - upper value quartile: $241,620 - $448,123
Mean price in 2022: Detached houses: $359,265Here:
$359,265State:
$376,364
Mobile homes: $155,675Here:
$155,675State:
$102,413
Housing units in structures:
One, detached: 2,354Two: 23Mobile homes: 217Unemployment : 4.3%
Means of transportation to work in zip code 30184 76.4% 2,270 Drove a car alone7.1% 210 Carpooled1.4% 43 Taxi0.2% 5 Other means14.4% 428 Worked at homeTravel time to work (commute) in zip code 30184 19 Less than 5 minutes259 5 to 9 minutes243 10 to 14 minutes200 15 to 19 minutes358 20 to 24 minutes389 25 to 29 minutes260 30 to 34 minutes113 35 to 39 minutes139 40 to 44 minutes239 45 to 59 minutes187 60 to 89 minutes118 90 or more minutes
Neighborhoods in zip code 30184: Percentage of zip code residents living and working in this county: 66.9%
Household type by relationship:
Households: 7,075
Male householders: 1,404 (266 living alone ), Female householders: 1,037 (206 living alone )1,727 spouses (1,703 opposite-sex spouses ), 140 unmarried partners , (140 opposite-sex unmarried partners ), 2,233 children (1,996 natural , 64 adopted , 174 stepchildren ), 154 grandchildren , 85 brothers or sisters , 98 parents , 0 foster children , 66 other relatives , 134 non-relatives In group quarters: 3 (-1 institutionalized population )
Size of family households: 825 2-persons , 469 3-persons , 294 4-persons , 163 5-persons , 107 6-persons , 46 7-or-more-persons
Size of nonfamily households: 473 1-person , 57 2-persons , 1 3-persons , 11 4-persons
1,298 married couples with children. single-parent households (132 men , 170 women ).
96.1% of residents of 30184 zip code speak English at home. of residents speak Spanish at home (3% very well, 41% well, 55% not at all ).of residents speak other Indo-European language at home (65% very well, 35% well ).of residents speak Asian or Pacific Island language at home (57% not well, 43% not at all ).
Foreign born population: 195 (2.8%)
(49.2%
of them are naturalized citizens )
This zip code:
2.8%Whole state:
10.7%
28% El Salvador 22% Honduras 15% Japan 13% Romania 2% Bolivia 19% Irish 17% American 10% English 6% Scottish 5% German 3% French 3% European
Year of entry for the foreign-born population
48 2010 or later 21 2000 to 2009 120 1990 to 1999 62 Before 1990
Facilities with environmental interests located in this zip code:
KAHN CATTLE FARM BIRD KILL SITE (227 MANSFIELD ROAD in WHITE, GA)
SUPERFUND (Superfund database) (Integrated Compliance Information System) - ICIS-04-2003-3510, FORMAL ENFORCEMENT ACTION Business SIC classification: GENERAL FARMS, PRIMARILY LIVESTOCK AND ANIMAL SPECIALTIESAlternative names: KAHN CATTLE BIRD KILL
EXXON CO USA 50038 (I-75 & SR 41 in WHITE, GA)
(Resource Conservation and Recovery Act (tracking hazardous waste))
MARGLEN INDUSTRIES INCORPORATED (3439 HIGHWAY 411 NE in WHITE, GA)
COMPLIANCE ACTIVITY (Tracking inspections of insecticide, fungicide, and rodenticide, and toxic substances) Alternative names: MARGLEN INDUSTRIES INC/ WHITE PLANT
MOULDINGS UNLIMITED (3439 HWY 411 SE in WHITE, GA)
AIR SYNTHETIC MINOR (AIRS/AFS) Business SIC classification: MILLWORKAlternative names: MOULDINGS UNLIMITED INC
Housing units lacking complete plumbing facilities: 0.4%
Housing units lacking complete kitchen facilities: 1.7%
74.5% Electricity 14.7% Bottled, tank, or LP gas 8.8% Utility gas 2.0% Wood
Population in 1990: 3,231. Population change in the 1990s: +1,659 (+51.3%).
Place of birth for U.S.-born residents:
This state: 4,517Northeast: 345Midwest: 486South: 1,010West: 430
50% of the 30184 zip code residents lived in the same house 5 years ago.
Out of people who lived in different houses, 43% lived in this county.
Out of people who lived in different counties, 50% lived in Georgia.
95% of the 30184 zip code residents lived in the same house 1 year ago.
Out of people who lived in different houses, 26% moved from this county.
Out of people who lived in different houses, 39% moved from different county within same state.
Out of people who lived in different houses, 38% moved from different state.
Out of people who lived in different houses, 5% moved from abroad.
Private vs. public school enrollment:
Students in private schools in grades 1 to 8 (elementary and middle school): 97
Students in private schools in grades 9 to 12 (high school): 65
Students in private undergraduate colleges: 89
Occupation by median earnings in the past 12 months ($)
176,309 Business and financial operations occupations 159,190 Health diagnosing and treating practitioners and other technical occupations 133,621 Management occupations 88,854 Computer and mathematical occupations 83,335 Health technologists and technicians 74,453 Construction and extraction occupations
Top industries in this zip code by the number of employees in 2005:
Construction: Plumbing, Heating, and Air-Conditioning Contractors (20-49 employees: 1 establishment, 1-4 employees: 1 establishment)Accommodation and Food Services: Full-Service Restaurants (10-19: 1, 1-4: 2)Construction: Electrical Contractors (10-19: 1, 1-4: 1)Health Care and Social Assistance: Offices of Physicians (except Mental Health Specialists) (10-19: 1)
Fatal accident statistics in 2014:
Fatal accident count: 1Vehicles involved in fatal accidents: 1Fatal accidents caused by drunken drivers: 0Fatalities: 1Persons involved in fatal accidents: 2Pedestrians involved in fatal accidents: 1
Fatal accident statistics in 2012:
Fatal accident count: 3Vehicles involved in fatal accidents: 4Fatal accidents caused by drunken drivers: 0Fatalities: 4Persons involved in fatal accidents: 5Pedestrians involved in fatal accidents: 0
Home Mortgage Disclosure Act Aggregated Statistics For Year 2009(Based on 8 partial tracts) A) FHA, FSA/RHS & VA B) Conventional C) Refinancings D) Home Improvement Loans E) Loans on Dwellings For 5+ Families F) Non-occupant Loans on G) Loans On Manufactured Number Average Value Number Average Value Number Average Value Number Average Value Number Average Value Number Average Value Number Average Value
LOANS ORIGINATED 119 $172,020 95 $181,482 503 $185,457 18 $64,694 1 $2,931,500 65 $159,681 14 $72,115 APPLICATIONS APPROVED, NOT ACCEPTED 5 $164,422 8 $209,280 38 $208,635 5 $9,306 0 $0 3 $132,767 3 $65,490 APPLICATIONS DENIED 21 $129,686 20 $181,906 206 $190,165 20 $44,388 0 $0 9 $94,671 9 $78,517 APPLICATIONS WITHDRAWN 16 $132,272 18 $158,357 130 $188,041 4 $91,010 0 $0 7 $112,603 2 $65,035 FILES CLOSED FOR INCOMPLETENESS 3 $154,957 5 $143,436 35 $206,426 2 $49,590 0 $0 3 $84,223 1 $113,780
Aggregated Statistics For Year 2008(Based on 8 partial tracts) A) FHA, FSA/RHS & VA B) Conventional C) Refinancings D) Home Improvement Loans E) Loans on Dwellings For 5+ Families F) Non-occupant Loans on G) Loans On Manufactured Number Average Value Number Average Value Number Average Value Number Average Value Number Average Value Number Average Value Number Average Value
LOANS ORIGINATED 123 $153,908 187 $187,804 363 $175,141 31 $47,237 3 $894,550 118 $136,560 21 $87,363 APPLICATIONS APPROVED, NOT ACCEPTED 6 $138,308 20 $199,400 59 $185,543 6 $49,480 0 $0 7 $125,854 6 $42,790 APPLICATIONS DENIED 15 $156,726 35 $219,958 239 $171,970 28 $69,385 0 $0 17 $130,802 18 $65,354 APPLICATIONS WITHDRAWN 15 $135,147 28 $234,460 109 $191,784 4 $95,775 0 $0 9 $120,804 6 $61,887 FILES CLOSED FOR INCOMPLETENESS 2 $160,320 8 $176,432 25 $213,646 2 $12,125 0 $0 2 $142,630 1 $134,890
Aggregated Statistics For Year 2007(Based on 8 partial tracts) A) FHA, FSA/RHS & VA B) Conventional C) Refinancings D) Home Improvement Loans E) Loans on Dwellings For 5+ Families F) Non-occupant Loans on G) Loans On Manufactured Number Average Value Number Average Value Number Average Value Number Average Value Number Average Value Number Average Value Number Average Value
LOANS ORIGINATED 75 $157,400 462 $164,836 458 $164,019 53 $64,846 1 $5,382,820 146 $138,370 19 $68,539 APPLICATIONS APPROVED, NOT ACCEPTED 1 $182,730 51 $173,189 104 $150,754 7 $32,396 0 $0 9 $140,387 6 $57,045 APPLICATIONS DENIED 16 $146,536 73 $213,826 372 $161,602 51 $60,527 0 $0 24 $229,072 11 $78,515 APPLICATIONS WITHDRAWN 6 $145,468 42 $176,648 184 $179,423 13 $116,911 0 $0 9 $168,582 3 $68,990 FILES CLOSED FOR INCOMPLETENESS 1 $214,460 19 $228,079 44 $220,148 2 $40,190 0 $0 3 $213,180 0 $0
Aggregated Statistics For Year 2006(Based on 8 partial tracts) A) FHA, FSA/RHS & VA B) Conventional C) Refinancings D) Home Improvement Loans E) Loans on Dwellings For 5+ Families F) Non-occupant Loans on G) Loans On Manufactured Number Average Value Number Average Value Number Average Value Number Average Value Number Average Value Number Average Value Number Average Value
LOANS ORIGINATED 72 $146,330 718 $149,354 515 $140,539 78 $59,375 2 $252,895 176 $107,314 29 $64,462 APPLICATIONS APPROVED, NOT ACCEPTED 5 $162,280 64 $149,633 94 $149,432 16 $45,514 0 $0 18 $151,546 5 $58,654 APPLICATIONS DENIED 5 $148,328 146 $142,160 321 $147,189 65 $64,414 0 $0 58 $117,888 26 $70,286 APPLICATIONS WITHDRAWN 7 $123,943 89 $147,686 194 $156,586 21 $124,568 1 $4,861,050 25 $124,443 3 $73,773 FILES CLOSED FOR INCOMPLETENESS 1 $97,740 15 $159,143 63 $150,846 3 $34,227 0 $0 2 $156,140 0 $0
Aggregated Statistics For Year 2005(Based on 8 partial tracts) A) FHA, FSA/RHS & VA B) Conventional C) Refinancings D) Home Improvement Loans E) Loans on Dwellings For 5+ Families F) Non-occupant Loans on G) Loans On Manufactured Number Average Value Number Average Value Number Average Value Number Average Value Number Average Value Number Average Value Number Average Value
LOANS ORIGINATED 61 $145,463 680 $128,988 515 $143,561 51 $61,891 4 $486,940 164 $113,625 24 $61,786 APPLICATIONS APPROVED, NOT ACCEPTED 4 $145,822 43 $127,982 77 $132,898 8 $72,624 0 $0 13 $124,905 5 $48,244 APPLICATIONS DENIED 5 $136,074 104 $136,015 307 $143,418 64 $40,545 0 $0 36 $202,962 17 $81,160 APPLICATIONS WITHDRAWN 7 $145,946 74 $129,175 188 $155,329 31 $112,075 0 $0 16 $123,618 5 $78,244 FILES CLOSED FOR INCOMPLETENESS 1 $67,280 21 $129,180 70 $153,497 3 $74,713 0 $0 5 $157,064 1 $40,950
Aggregated Statistics For Year 2004(Based on 8 partial tracts) A) FHA, FSA/RHS & VA B) Conventional C) Refinancings D) Home Improvement Loans E) Loans on Dwellings For 5+ Families F) Non-occupant Loans on G) Loans On Manufactured Number Average Value Number Average Value Number Average Value Number Average Value Number Average Value Number Average Value Number Average Value
LOANS ORIGINATED 102 $136,192 553 $143,260 515 $138,781 52 $53,160 1 $121,060 152 $113,893 30 $58,159 APPLICATIONS APPROVED, NOT ACCEPTED 4 $100,122 46 $137,256 79 $137,777 10 $40,401 0 $0 13 $100,092 9 $49,771 APPLICATIONS DENIED 10 $127,869 74 $134,516 241 $130,115 60 $38,736 0 $0 27 $94,216 23 $62,507 APPLICATIONS WITHDRAWN 11 $126,420 61 $149,463 153 $133,662 10 $41,805 1 $175,630 19 $118,502 6 $77,505 FILES CLOSED FOR INCOMPLETENESS 0 $0 15 $104,710 70 $151,736 4 $47,168 0 $0 5 $129,844 2 $82,225
Aggregated Statistics For Year 2003(Based on 8 partial tracts) A) FHA, FSA/RHS & VA B) Conventional C) Refinancings D) Home Improvement Loans F) Non-occupant Loans on Number Average Value Number Average Value Number Average Value Number Average Value Number Average Value
LOANS ORIGINATED 115 $123,419 387 $152,366 897 $130,394 28 $22,012 117 $90,861 APPLICATIONS APPROVED, NOT ACCEPTED 5 $123,512 23 $171,703 75 $120,827 4 $23,235 5 $89,612 APPLICATIONS DENIED 7 $100,071 71 $117,731 230 $121,698 34 $21,930 21 $98,582 APPLICATIONS WITHDRAWN 8 $138,111 33 $164,220 129 $118,677 5 $43,248 8 $117,799 FILES CLOSED FOR INCOMPLETENESS 4 $103,155 14 $145,389 34 $134,883 4 $70,575 2 $155,745
Aggregated Statistics For Year 2002(Based on 8 partial tracts) A) FHA, FSA/RHS & VA B) Conventional C) Refinancings D) Home Improvement Loans F) Non-occupant Loans on Number Average Value Number Average Value Number Average Value Number Average Value Number Average Value
LOANS ORIGINATED 137 $120,686 312 $133,705 631 $128,571 36 $27,919 105 $94,095 APPLICATIONS APPROVED, NOT ACCEPTED 5 $135,502 28 $117,343 70 $119,035 9 $35,412 5 $90,630 APPLICATIONS DENIED 12 $124,429 45 $89,726 190 $102,781 30 $25,061 18 $117,840 APPLICATIONS WITHDRAWN 7 $113,501 20 $144,382 114 $122,105 9 $37,882 9 $89,176 FILES CLOSED FOR INCOMPLETENESS 2 $127,425 6 $141,800 52 $105,433 1 $65,850 4 $95,380
Aggregated Statistics For Year 2001(Based on 8 partial tracts) A) FHA, FSA/RHS & VA B) Conventional C) Refinancings D) Home Improvement Loans E) Loans on Dwellings For 5+ Families F) Non-occupant Loans on Number Average Value Number Average Value Number Average Value Number Average Value Number Average Value Number Average Value
LOANS ORIGINATED 147 $115,139 272 $132,333 528 $110,274 48 $32,804 1 $1,060,920 97 $102,568 APPLICATIONS APPROVED, NOT ACCEPTED 2 $110,010 24 $123,538 59 $94,169 6 $15,455 0 $0 5 $64,218 APPLICATIONS DENIED 7 $99,466 57 $66,664 206 $92,089 31 $17,713 0 $0 11 $58,394 APPLICATIONS WITHDRAWN 7 $91,736 27 $157,110 122 $89,267 11 $44,793 0 $0 11 $108,521 FILES CLOSED FOR INCOMPLETENESS 0 $0 4 $122,690 28 $93,206 1 $57,270 0 $0 1 $60,620
Aggregated Statistics For Year 2000(Based on 8 partial tracts) A) FHA, FSA/RHS & VA B) Conventional C) Refinancings D) Home Improvement Loans F) Non-occupant Loans on Number Average Value Number Average Value Number Average Value Number Average Value Number Average Value
LOANS ORIGINATED 112 $109,740 250 $105,453 178 $87,093 59 $18,542 52 $85,474 APPLICATIONS APPROVED, NOT ACCEPTED 2 $132,190 24 $72,540 41 $64,176 27 $18,789 3 $75,270 APPLICATIONS DENIED 12 $86,470 106 $54,339 127 $69,662 40 $17,619 6 $71,542 APPLICATIONS WITHDRAWN 7 $106,513 28 $100,376 62 $72,813 8 $60,012 2 $65,540 FILES CLOSED FOR INCOMPLETENESS 0 $0 6 $110,140 20 $82,476 2 $25,880 0 $0
Aggregated Statistics For Year 1999(Based on 4 partial tracts) A) FHA, FSA/RHS & VA B) Conventional C) Refinancings D) Home Improvement Loans F) Non-occupant Loans on Number Average Value Number Average Value Number Average Value Number Average Value Number Average Value
LOANS ORIGINATED 59 $95,732 127 $98,863 129 $80,933 28 $17,724 29 $64,401 APPLICATIONS APPROVED, NOT ACCEPTED 0 $0 18 $74,754 21 $74,096 10 $17,088 1 $145,450 APPLICATIONS DENIED 6 $98,672 38 $65,673 64 $70,295 23 $19,480 2 $70,510 APPLICATIONS WITHDRAWN 3 $94,220 11 $102,083 33 $62,718 2 $20,120 2 $95,205 FILES CLOSED FOR INCOMPLETENESS 0 $0 2 $78,615 8 $104,025 1 $15,810 0 $0
Detailed HMDA statistics for the following Tracts:
0903.00
,
9601.00 ,
9604.00 ,
9607.00
Private Mortgage Insurance Companies Aggregated Statistics For Year 2009(Based on 8 partial tracts) A) Conventional B) Refinancings Number Average Value Number Average Value
LOANS ORIGINATED 17 $219,638 16 $213,024 APPLICATIONS APPROVED, NOT ACCEPTED 3 $195,477 8 $249,175 APPLICATIONS DENIED 4 $235,955 3 $186,653 APPLICATIONS WITHDRAWN 0 $0 1 $134,170 FILES CLOSED FOR INCOMPLETENESS 1 $214,220 0 $0
Aggregated Statistics For Year 2008(Based on 8 partial tracts) A) Conventional B) Refinancings C) Non-occupant Loans on Number Average Value Number Average Value Number Average Value
LOANS ORIGINATED 52 $221,944 33 $228,064 6 $158,932 APPLICATIONS APPROVED, NOT ACCEPTED 18 $178,144 18 $212,417 4 $93,380 APPLICATIONS DENIED 5 $152,396 2 $289,630 1 $269,820 APPLICATIONS WITHDRAWN 2 $301,390 1 $297,590 0 $0 FILES CLOSED FOR INCOMPLETENESS 4 $136,808 3 $207,870 1 $205,210
Aggregated Statistics For Year 2007(Based on 8 partial tracts) A) Conventional B) Refinancings C) Non-occupant Loans on Number Average Value Number Average Value Number Average Value
LOANS ORIGINATED 134 $181,215 44 $199,740 11 $158,335 APPLICATIONS APPROVED, NOT ACCEPTED 11 $187,955 7 $242,906 1 $312,560 APPLICATIONS DENIED 2 $145,760 0 $0 0 $0 APPLICATIONS WITHDRAWN 7 $245,669 3 $249,720 0 $0 FILES CLOSED FOR INCOMPLETENESS 0 $0 1 $122,940 0 $0
Aggregated Statistics For Year 2006(Based on 8 partial tracts) A) Conventional B) Refinancings C) Non-occupant Loans on D) Loans On Manufactured Number Average Value Number Average Value Number Average Value Number Average Value
LOANS ORIGINATED 80 $175,293 25 $204,307 12 $147,578 1 $58,800 APPLICATIONS APPROVED, NOT ACCEPTED 8 $224,476 4 $298,595 1 $172,720 0 $0 APPLICATIONS DENIED 0 $0 0 $0 0 $0 0 $0 APPLICATIONS WITHDRAWN 3 $144,627 1 $169,050 0 $0 0 $0 FILES CLOSED FOR INCOMPLETENESS 1 $120,490 0 $0 0 $0 0 $0
Aggregated Statistics For Year 2005(Based on 8 partial tracts) A) Conventional B) Refinancings C) Non-occupant Loans on D) Loans On Manufactured Number Average Value Number Average Value Number Average Value Number Average Value
LOANS ORIGINATED 53 $172,397 42 $160,575 9 $138,833 1 $75,600 APPLICATIONS APPROVED, NOT ACCEPTED 10 $213,730 5 $231,624 3 $152,130 0 $0 APPLICATIONS DENIED 0 $0 2 $377,670 1 $316,770 0 $0 APPLICATIONS WITHDRAWN 3 $110,503 2 $122,570 0 $0 0 $0 FILES CLOSED FOR INCOMPLETENESS 1 $192,760 0 $0 1 $61,380 0 $0
Aggregated Statistics For Year 2004(Based on 8 partial tracts) A) Conventional B) Refinancings C) Non-occupant Loans on D) Loans On Manufactured Number Average Value Number Average Value Number Average Value Number Average Value
LOANS ORIGINATED 93 $167,302 51 $137,867 19 $127,246 1 $42,000 APPLICATIONS APPROVED, NOT ACCEPTED 11 $138,271 16 $175,289 3 $112,267 0 $0 APPLICATIONS DENIED 1 $252,630 0 $0 0 $0 0 $0 APPLICATIONS WITHDRAWN 5 $170,880 3 $158,743 2 $114,175 0 $0 FILES CLOSED FOR INCOMPLETENESS 0 $0 1 $204,640 0 $0 0 $0
Aggregated Statistics For Year 2003(Based on 8 partial tracts) A) Conventional B) Refinancings C) Non-occupant Loans on Number Average Value Number Average Value Number Average Value
LOANS ORIGINATED 91 $145,431 109 $134,825 16 $100,126 APPLICATIONS APPROVED, NOT ACCEPTED 9 $140,801 22 $161,072 4 $121,462 APPLICATIONS DENIED 1 $230,410 3 $112,593 0 $0 APPLICATIONS WITHDRAWN 3 $107,187 9 $137,659 3 $119,113 FILES CLOSED FOR INCOMPLETENESS 0 $0 0 $0 0 $0
Aggregated Statistics For Year 2002(Based on 8 partial tracts) A) Conventional B) Refinancings C) Non-occupant Loans on Number Average Value Number Average Value Number Average Value
LOANS ORIGINATED 73 $128,324 88 $129,590 12 $110,694 APPLICATIONS APPROVED, NOT ACCEPTED 11 $125,868 15 $125,554 2 $91,040 APPLICATIONS DENIED 0 $0 1 $386,780 1 $263,940 APPLICATIONS WITHDRAWN 3 $134,850 6 $145,067 0 $0 FILES CLOSED FOR INCOMPLETENESS 0 $0 0 $0 0 $0
Aggregated Statistics For Year 2001(Based on 8 partial tracts) A) Conventional B) Refinancings C) Non-occupant Loans on Number Average Value Number Average Value Number Average Value
LOANS ORIGINATED 99 $140,251 73 $125,200 11 $90,227 APPLICATIONS APPROVED, NOT ACCEPTED 6 $130,732 11 $123,003 2 $123,425 APPLICATIONS DENIED 2 $84,590 3 $123,753 1 $55,840 APPLICATIONS WITHDRAWN 1 $96,360 3 $132,120 0 $0 FILES CLOSED FOR INCOMPLETENESS 1 $61,090 1 $74,680 1 $74,680
Aggregated Statistics For Year 2000(Based on 8 partial tracts) A) Conventional B) Refinancings C) Non-occupant Loans on Number Average Value Number Average Value Number Average Value
LOANS ORIGINATED 91 $130,776 13 $107,049 5 $92,826 APPLICATIONS APPROVED, NOT ACCEPTED 6 $143,133 2 $97,425 1 $45,050 APPLICATIONS DENIED 1 $117,860 1 $162,310 0 $0 APPLICATIONS WITHDRAWN 1 $96,980 0 $0 0 $0 FILES CLOSED FOR INCOMPLETENESS 0 $0 0 $0 0 $0
Aggregated Statistics For Year 1999(Based on 4 partial tracts) A) Conventional B) Refinancings C) Non-occupant Loans on Number Average Value Number Average Value Number Average Value
LOANS ORIGINATED 48 $119,535 12 $120,712 2 $52,705 APPLICATIONS APPROVED, NOT ACCEPTED 1 $145,850 2 $175,990 0 $0 APPLICATIONS DENIED 2 $78,580 1 $92,040 0 $0 APPLICATIONS WITHDRAWN 1 $149,130 0 $0 0 $0 FILES CLOSED FOR INCOMPLETENESS 0 $0 0 $0 0 $0
Detailed PMIC statistics for the following Tracts:
0903.00
,
9601.00 ,
9604.00 ,
9607.00
2002 - 2018 National Fire Incident Reporting System (NFIRS) incidents See full 2006 National Fire Incident Reporting System statistics for zip code 30184, Georgia
Most common first names in zip code 30184 among deceased individuals Name Count Lived (average)
John 25 76.9 years James 22 73.6 years Mary 18 79.5 years William 16 74.9 years George 15 75.3 years Thomas 10 74.9 years Annie 10 78.0 years Charles 10 69.6 years Robert 9 66.6 years David 8 55.8 years
Most common last names in zip code 30184 among deceased individuals Last name Count Lived (average)
Young 13 72.2 years Smith 12 73.6 years Black 10 78.3 years Brown 10 75.1 years Kay 9 70.6 years Satterfield 9 81.2 years Alexander 8 75.3 years Wilson 8 71.4 years Evans 7 78.3 years Morris 7 78.7 years


+$300
-$6,357
 Nearest zip codes: 30121, 30171, 30137, 30120, 30183, 30102.


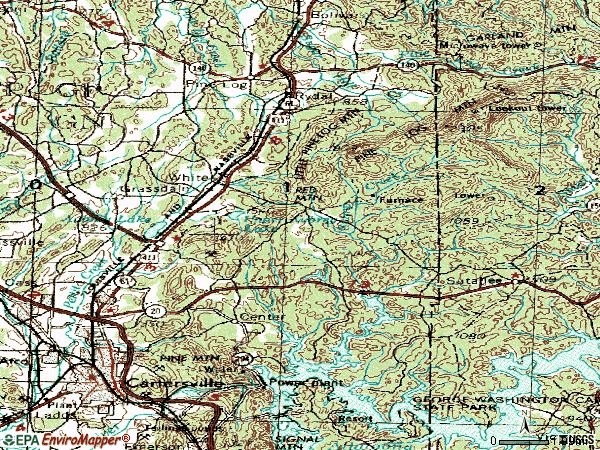


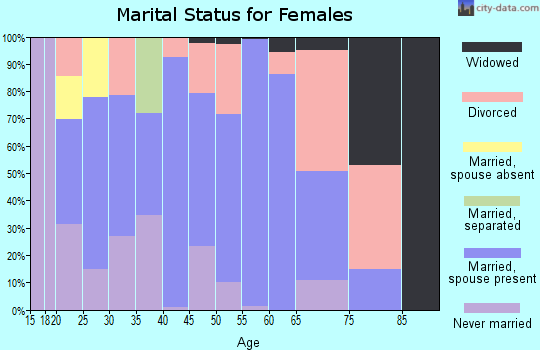


 According to the data from the years 2002 - 2018 the average number of fire incidents per year is 13. The highest number of reported fire incidents - 49 took place in 2010, and the least - 0 in 2004. The data has a growing trend.
 When looking into fire subcategories, the most reports belonged to: Outside Fires (58.5%), and Structure Fires (26.6%).