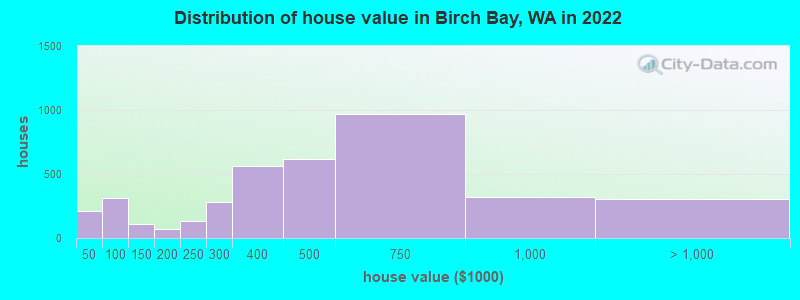
Estimated median house or condo value in 2022: $485,010 (it was $117,000 in 2000)
Birch Bay:
$485,010
WA:
$569,500
Mean prices in 2022:all housing units: $618,668; detached houses: $673,947; townhouses or other attached units: $482,237; in 2-unit structures: $597,815; in 3-to-4-unit structures: $424,563; in 5-or-more-unit structures: $322,462; mobile homes: $232,843; occupied boats, rvs, vans, etc.: $243,510
Median gross rent in 2022: $1,279.
March 2022 cost of living index in Birch Bay: 100.6 (near average, U.S. average is 100)
Percentage of residents living in poverty in 2022: 10.2%
(11.5% for White Non-Hispanic residents, 7.0% for Hispanic or Latino residents, 3.4% for two or more races residents)
Latest news from Birch Bay, WA collected exclusively by city-data.com from local newspapers, TV, and radio stations
Ancestries: American (10.7%), English (9.2%), German (8.9%), Norwegian (6.4%), Russian (5.3%), European (5.1%).
Current Local Time: PST time zone
Elevation: 10 feet
Land area: 15.8 square miles.
Population density: 532 people per square mile (low).
1,267 residents are foreign born (5.0% North America, 2.4% Latin America, 2.2% Asia).
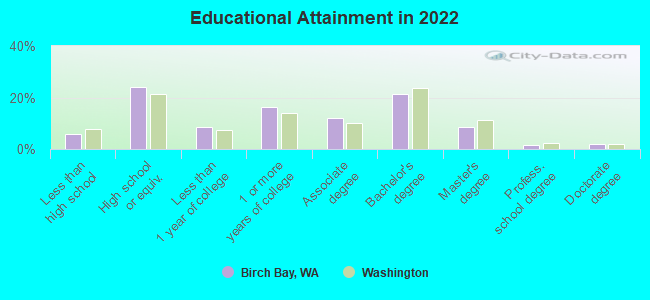
This place:
11.2%
Washington:
14.9%
Median real estate property taxes paid for housing units with mortgages in 2022: $2,849 (0.6%) Median real estate property taxes paid for housing units with no mortgage in 2022: $2,555 (0.5%)
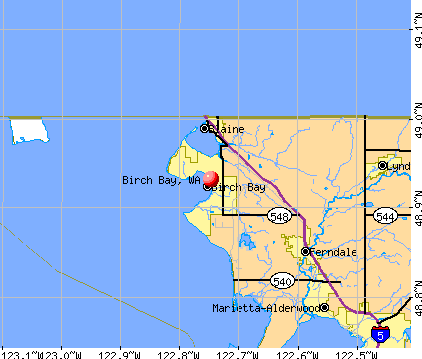
Nearest city with pop. 50,000+: Bellingham, WA (17.7 miles , pop. 67,171).
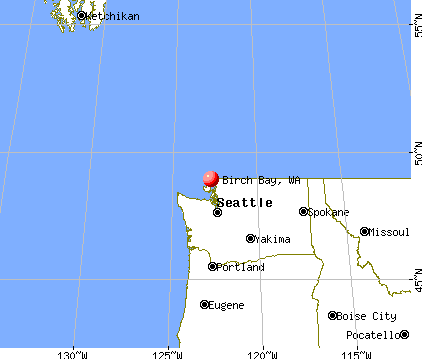
Nearest city with pop. 200,000+: Seattle, WA (92.3 miles , pop. 563,374).
Nearest city with pop. 1,000,000+: Los Angeles, CA (1051.1 miles , pop. 3,694,820).
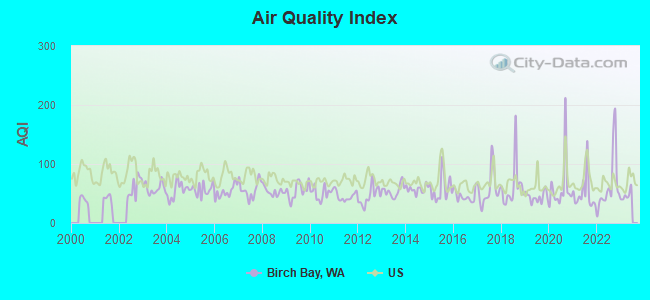
Air Quality Index (AQI) level in 2022 was 64.7. This is about average.
City:
64.7
U.S.:
72.6
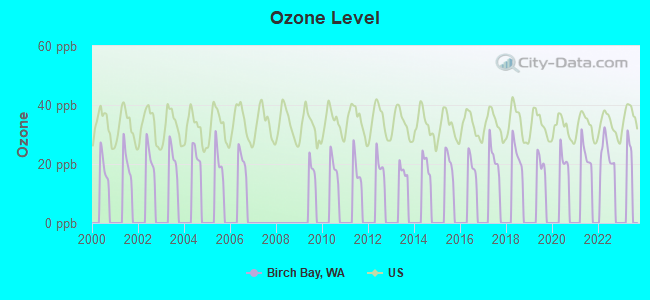
Ozone [ppb] level in 2022 was 24.1. This is better than average.Closest monitor was 8.9 miles away from the city center.
City:
24.1
U.S.:
33.3
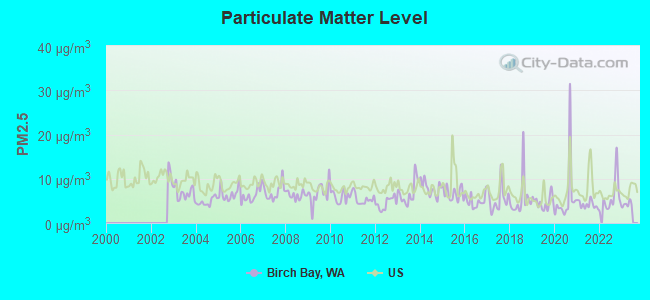
Particulate Matter (PM2.5) [µg/m3] level in 2022 was 6.01. This is better than average.Closest monitor was 17.8 miles away from the city center.
City:
6.01
U.S.:
8.11
Earthquake activity:
Birch Bay-area historical earthquake activity is significantly above Washington state average. It is 923% greater than the overall U.S. average.
On 4/13/1949 at 19:55:42, a magnitude 7.0 (7.0 UK, Class: Major, Intensity: VIII - XII) earthquake occurred 116.9 miles away from Birch Bay center, causing $80,000,000 total damage On 2/28/2001 at 18:54:32, a magnitude 6.8 (6.8 MD, Depth: 32.2 mi, Class: Strong, Intensity: VII - IX) earthquake occurred 123.3 miles away from the city center On 2/28/2001 at 18:54:32, a magnitude 6.8 (6.5 MB, 6.6 MS, 6.8 MW) earthquake occurred 127.7 miles away from the city center, causing $2,000,000,000 total damage and $305,000,000 insured losses On 4/29/1965 at 15:28:43, a magnitude 6.6 (6.6 UK) earthquake occurred 113.3 miles away from the city center, causing $28,000,000 total damage On 7/3/1999 at 01:43:54, a magnitude 5.8 (5.4 MB, 5.5 MS, 5.8 MW, 5.3 ME, Depth: 25.2 mi, Class: Moderate, Intensity: VI - VII) earthquake occurred 131.4 miles away from Birch Bay center On 5/3/1996 at 04:04:22, a magnitude 5.5 (5.2 MB, 5.3 MD, 5.5 ML, Depth: 2.5 mi) earthquake occurred 88.8 miles away from Birch Bay center Magnitude types: body-wave magnitude (MB), duration magnitude (MD), energy magnitude (ME), local magnitude (ML), surface-wave magnitude (MS), moment magnitude (MW)
Natural disasters:
The number of natural disasters in Whatcom County (21) is greater than the US average (15). Major Disasters (Presidential) Declared: 17 Emergencies Declared: 1
Causes of natural disasters: Floods: 13, Storms: 10, Mudslides: 7, Winter Storms: 5, Landslides: 4, Winds: 3, Snows: 2, Earthquake: 1, Fire: 1, Heavy Rain: 1, Hurricane: 1, Tornado: 1, Volcanic Eruption: 1, Other: 1 (Note: some incidents may be assigned to more than one category).
Hospitals and medical centers near Birch Bay:
ICELANDIC OLD FOLKS HOME (Nursing Home, about 5 miles away; BLAINE, WA)
STAFHOLT GOOD SAMARITAN CENTER (Nursing Home, about 5 miles away; BLAINE, WA)
PIONEER RIDGE HEALTH CARE (Nursing Home, about 9 miles away; FERNDALE, WA)
SUTTON GARDENS HEALTH CARE (Nursing Home, about 9 miles away; FERNDALE, WA)
WALGREENS INFUSION AND RESPIRATORY SERVICES (Home Health Center, about 14 miles away; BELLINGHAM, WA)
NORTH CASCADES HEALTH AND REHABILITATION CENTER (Nursing Home, about 15 miles away; BELLINGHAM, WA)
CHRISTIAN HEALTH CARE CENTER (Nursing Home, about 15 miles away; LYNDEN, WA)
Amtrak stations near Birch Bay:
17 miles: SURREY (187 176TH ST.) - Bus Station
19 miles: BELLINGHAM (401 HARRIS AVE.) . Services: ticket office, partially wheelchair accessible, enclosed waiting area, public restrooms, public payphones, free short-term parking, free long-term parking, call for taxi service.
Colleges/universities with over 2000 students nearest to Birch Bay:
Whatcom Community College (about 15 miles; Bellingham, WA; Full-time enrollment: 3,265)
Western Washington University (about 19 miles; Bellingham, WA; FT enrollment: 13,875)
Skagit Valley College (about 40 miles; Mount Vernon, WA; FT enrollment: 3,803)
Peninsula College (about 66 miles; Port Angeles, WA; FT enrollment: 2,012)
Everett Community College (about 69 miles; Everett, WA; FT enrollment: 5,818)
Edmonds Community College (about 80 miles; Lynnwood, WA; FT enrollment: 7,271)
Shoreline Community College (about 84 miles; Shoreline, WA; FT enrollment: 5,026)
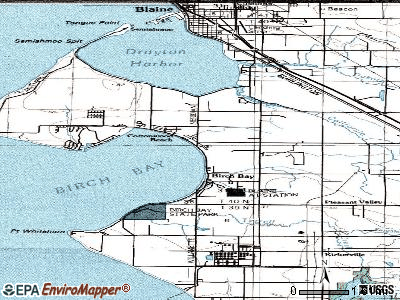
Notable locations in Birch Bay: Birch Bay Village Golf Course (A), Birch Bay Village Marina (B), Birch Bay Sewage Treatment Plant (C), Whatcom County Fire District 7 Grandview Road (D), North Whatcom Fire Rescue Station 63 Birch Bay (E). Display/hide their locations on the map
Churches in Birch Bay include: North Bay Christ the King Community Church (A), Bay Community Baptist Church (B), Birch Bay Bible Community Church (C). Display/hide their locations on the map
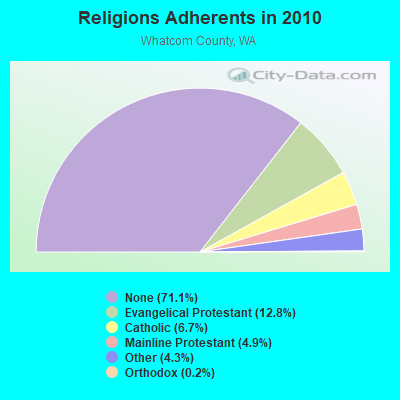
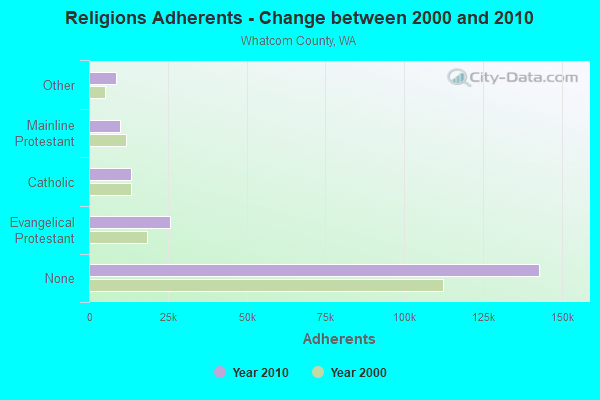
Religion statistics for Birch Bay, WA (based on Whatcom County data)
Religion
Adherents
Congregations
Evangelical Protestant
25,842
105
Catholic
13,397
6
Mainline Protestant
9,859
39
Other
8,714
33
Orthodox
370
2
None
142,958
-
Source: Clifford Grammich, Kirk Hadaway, Richard Houseal, Dale E.Jones, Alexei Krindatch, Richie Stanley and Richard H.Taylor. 2012. 2010 U.S.Religion Census: Religious Congregations & Membership Study. Association of Statisticians of American Religious Bodies. Jones, Dale E., et al. 2002. Congregations and Membership in the United States 2000. Nashville, TN: Glenmary Research Center. Graphs represent county-level data
Kristin A Steiner, 5491 Grandview Road (Lat: 48.892194 Lon: -122.780944), Type: 35.1, Overall height: 35.1 m, Registrant: Pm@mobilitie.Com, , Newpo-rt Beach, Phone: (949) 515-1500
Edward G Roach, 5491 Grandview Road (Lat: 48.892194 Lon: -122.780944), Type: 35.1, Overall height: 35.1 m, Registrant: Sba Monarch Towers Ii, LLC, Eroach@sbasite.Com, , Boca -Raton, Phone: (561) 995-7670
Edward G Roach, 5491 Grandview Road (Lat: 48.892194 Lon: -122.780944), Type: 35.1, Structure height: 53073 m, Overall height: 35.1 m, Registrant: Sba Monarch Towers Iii, LLC, Eroach@sbasite.Com, , Boca -Raton, Phone: (561) 995-7670
FCC Registered Amateur Radio Licenses:
3
Call Sign: KE7YFJ, Licensee ID: L01446586, Grant Date: 11/15/2018, Expiration Date: 11/19/2028, Certifier: Kelvin W Barton, Registrant: Kelvin W Barton, 7691 Francis Ln, Birch Bay, WA 98230
Call Sign: KF7AEQ, Licensee ID: L01466711, Grant Date: 02/13/2009, Expiration Date: 02/13/2019, Cancellation Date: 08/23/2011, Certifier: John W C Simmons, Registrant: John W C Simmons, 5001 Bay Rd G2, Birch Bay, WA 98230
Call Sign: KF7MTV, Licensee ID: L01603863, Grant Date: 10/10/2020, Expiration Date: 11/19/2030, Certifier: Patti A Barton, Registrant: Patti A Barton, 7691 Francis Ln, Birch Bay, WA 98230
Home Mortgage Disclosure Act Aggregated Statistics For Year 2009 (Based on 1 partial tract)
A) FHA, FSA/RHS & VA Home Purchase Loans
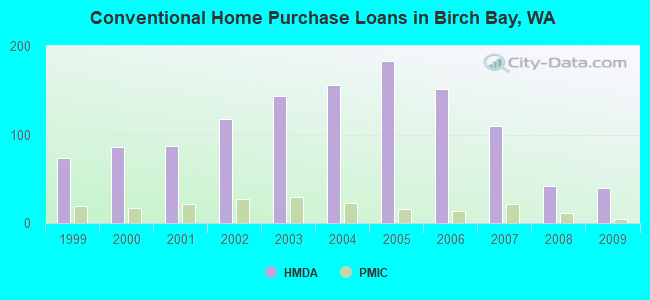
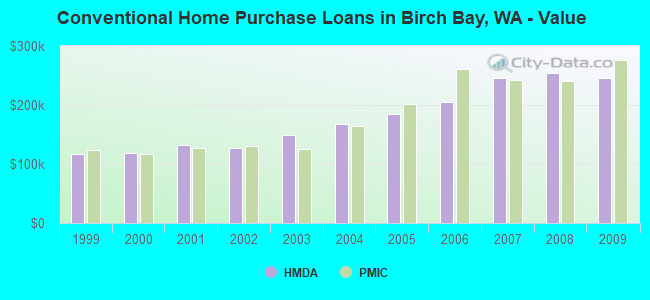
B) Conventional Home Purchase Loans
C) Refinancings
D) Home Improvement Loans
F) Non-occupant Loans on < 5 Family Dwellings (A B C & D)
G) Loans On Manufactured Home Dwelling (A B C & D)
Number
Average Value
Number
Average Value
Number
Average Value
Number
Average Value
Number
Average Value
Number
Average Value
LOANS ORIGINATED
31
$197,056
39
$246,471
182
$229,666
7
$132,286
29
$256,476
30
$162,642
APPLICATIONS APPROVED, NOT ACCEPTED
3
$187,413
5
$210,774
21
$213,952
1
$49,240
6
$192,822
3
$157,897
APPLICATIONS DENIED
6
$192,695
4
$198,292
57
$233,527
3
$132,703
12
$235,827
7
$108,730
APPLICATIONS WITHDRAWN
6
$196,830
5
$211,156
45
$237,706
3
$176,727
8
$306,696
6
$169,220
FILES CLOSED FOR INCOMPLETENESS
0
$0
1
$149,630
8
$244,336
0
$0
0
$0
1
$150,390
Aggregated Statistics For Year 2008 (Based on 1 partial tract)
A) FHA, FSA/RHS & VA Home Purchase Loans
B) Conventional Home Purchase Loans
C) Refinancings
D) Home Improvement Loans
E) Loans on Dwellings For 5+ Families
F) Non-occupant Loans on < 5 Family Dwellings (A B C & D)
G) Loans On Manufactured Home Dwelling (A B C & D)
Number
Average Value
Number
Average Value
Number
Average Value
Number
Average Value
Number
Average Value
Number
Average Value
Number
Average Value
LOANS ORIGINATED
12
$231,151
42
$255,012
109
$232,021
8
$110,741
1
$3,362,780
27
$238,605
24
$169,936
APPLICATIONS APPROVED, NOT ACCEPTED
3
$185,760
5
$228,790
14
$257,266
2
$75,575
0
$0
3
$326,607
4
$103,822
APPLICATIONS DENIED
2
$269,670
8
$236,415
59
$241,480
10
$131,839
0
$0
11
$169,717
11
$139,285
APPLICATIONS WITHDRAWN
3
$225,330
9
$262,864
34
$258,512
2
$227,875
0
$0
8
$241,091
7
$179,071
FILES CLOSED FOR INCOMPLETENESS
0
$0
0
$0
7
$251,323
0
$0
0
$0
1
$150,770
2
$122,525
Aggregated Statistics For Year 2007 (Based on 1 partial tract)
A) FHA, FSA/RHS & VA Home Purchase Loans
B) Conventional Home Purchase Loans
C) Refinancings
D) Home Improvement Loans
F) Non-occupant Loans on < 5 Family Dwellings (A B C & D)
G) Loans On Manufactured Home Dwelling (A B C & D)
Number
Average Value
Number
Average Value
Number
Average Value
Number
Average Value
Number
Average Value
Number
Average Value
LOANS ORIGINATED
13
$192,993
110
$246,429
116
$250,981
24
$80,300
46
$294,166
36
$141,939
APPLICATIONS APPROVED, NOT ACCEPTED
3
$172,273
13
$145,545
23
$232,339
6
$127,742
8
$205,402
7
$140,193
APPLICATIONS DENIED
1
$169,090
22
$236,810
69
$228,362
11
$116,454
10
$293,107
15
$136,954
APPLICATIONS WITHDRAWN
1
$173,670
13
$207,175
31
$263,435
4
$146,762
5
$223,752
6
$140,593
FILES CLOSED FOR INCOMPLETENESS
0
$0
2
$186,080
16
$230,141
0
$0
3
$168,840
2
$125,960
Aggregated Statistics For Year 2006 (Based on 1 partial tract)
A) FHA, FSA/RHS & VA Home Purchase Loans
B) Conventional Home Purchase Loans
C) Refinancings
D) Home Improvement Loans
F) Non-occupant Loans on < 5 Family Dwellings (A B C & D)
G) Loans On Manufactured Home Dwelling (A B C & D)
Number
Average Value
Number
Average Value
Number
Average Value
Number
Average Value
Number
Average Value
Number
Average Value
LOANS ORIGINATED
13
$194,608
151
$205,716
126
$223,731
19
$112,481
69
$240,980
35
$135,885
APPLICATIONS APPROVED, NOT ACCEPTED
1
$140,080
12
$211,462
17
$177,244
2
$344,675
5
$189,704
3
$169,347
APPLICATIONS DENIED
3
$180,417
32
$161,399
75
$201,706
17
$91,114
12
$191,932
19
$118,688
APPLICATIONS WITHDRAWN
1
$154,970
19
$167,687
47
$205,874
4
$112,220
9
$195,897
10
$133,099
FILES CLOSED FOR INCOMPLETENESS
0
$0
1
$321,390
10
$234,478
1
$94,660
1
$274,820
0
$0
Aggregated Statistics For Year 2005 (Based on 1 partial tract)
A) FHA, FSA/RHS & VA Home Purchase Loans
B) Conventional Home Purchase Loans
C) Refinancings
D) Home Improvement Loans
E) Loans on Dwellings For 5+ Families
F) Non-occupant Loans on < 5 Family Dwellings (A B C & D)
G) Loans On Manufactured Home Dwelling (A B C & D)
Number
Average Value
Number
Average Value
Number
Average Value
Number
Average Value
Number
Average Value
Number
Average Value
Number
Average Value
LOANS ORIGINATED
13
$180,515
183
$184,507
153
$181,415
19
$80,780
1
$309,940
58
$187,783
45
$122,186
APPLICATIONS APPROVED, NOT ACCEPTED
2
$159,550
16
$184,289
23
$166,388
3
$204,590
0
$0
5
$255,128
4
$119,185
APPLICATIONS DENIED
6
$174,692
36
$148,407
73
$180,199
12
$94,058
0
$0
14
$177,436
23
$113,232
APPLICATIONS WITHDRAWN
1
$166,040
28
$196,698
45
$178,653
5
$152,146
0
$0
6
$194,032
8
$118,279
FILES CLOSED FOR INCOMPLETENESS
0
$0
5
$163,368
17
$178,524
2
$140,085
0
$0
2
$156,690
5
$130,694
Aggregated Statistics For Year 2004 (Based on 1 partial tract)
A) FHA, FSA/RHS & VA Home Purchase Loans
B) Conventional Home Purchase Loans
C) Refinancings
D) Home Improvement Loans
F) Non-occupant Loans on < 5 Family Dwellings (A B C & D)
G) Loans On Manufactured Home Dwelling (A B C & D)
Number
Average Value
Number
Average Value
Number
Average Value
Number
Average Value
Number
Average Value
Number
Average Value
LOANS ORIGINATED
10
$149,359
156
$167,909
141
$150,850
16
$71,473
52
$152,665
38
$111,507
APPLICATIONS APPROVED, NOT ACCEPTED
3
$108,403
14
$144,937
28
$197,244
3
$102,933
3
$200,773
8
$120,235
APPLICATIONS DENIED
1
$161,080
18
$139,617
74
$150,560
16
$64,364
6
$120,363
27
$111,160
APPLICATIONS WITHDRAWN
2
$183,405
13
$189,118
56
$143,131
5
$62,446
5
$164,590
11
$113,295
FILES CLOSED FOR INCOMPLETENESS
0
$0
2
$246,195
19
$174,798
1
$68,710
0
$0
3
$121,380
Aggregated Statistics For Year 2003 (Based on 1 partial tract)
A) FHA, FSA/RHS & VA Home Purchase Loans
B) Conventional Home Purchase Loans
C) Refinancings
D) Home Improvement Loans
F) Non-occupant Loans on < 5 Family Dwellings (A B C & D)
Number
Average Value
Number
Average Value
Number
Average Value
Number
Average Value
Number
Average Value
LOANS ORIGINATED
12
$145,968
143
$148,313
266
$149,258
6
$42,050
61
$127,832
APPLICATIONS APPROVED, NOT ACCEPTED
0
$0
10
$117,258
29
$144,243
2
$14,695
6
$157,070
APPLICATIONS DENIED
2
$126,915
19
$126,724
61
$137,568
8
$45,040
7
$122,471
APPLICATIONS WITHDRAWN
0
$0
13
$178,401
48
$165,602
2
$70,425
5
$219,020
FILES CLOSED FOR INCOMPLETENESS
0
$0
3
$124,307
7
$141,556
0
$0
0
$0
Aggregated Statistics For Year 2002 (Based on 1 partial tract)
A) FHA, FSA/RHS & VA Home Purchase Loans
B) Conventional Home Purchase Loans
C) Refinancings
D) Home Improvement Loans
F) Non-occupant Loans on < 5 Family Dwellings (A B C & D)
Number
Average Value
Number
Average Value
Number
Average Value
Number
Average Value
Number
Average Value
LOANS ORIGINATED
17
$120,168
118
$127,688
172
$145,874
10
$33,017
39
$113,688
APPLICATIONS APPROVED, NOT ACCEPTED
2
$104,015
12
$107,767
16
$134,716
2
$17,365
4
$84,928
APPLICATIONS DENIED
2
$115,655
14
$106,631
59
$122,144
3
$30,663
8
$88,269
APPLICATIONS WITHDRAWN
2
$71,950
14
$166,066
46
$126,459
1
$57,260
4
$146,190
FILES CLOSED FOR INCOMPLETENESS
1
$126,340
4
$78,248
11
$134,185
0
$0
0
$0
Aggregated Statistics For Year 2001 (Based on 1 partial tract)
A) FHA, FSA/RHS & VA Home Purchase Loans
B) Conventional Home Purchase Loans
C) Refinancings
D) Home Improvement Loans
F) Non-occupant Loans on < 5 Family Dwellings (A B C & D)
Number
Average Value
Number
Average Value
Number
Average Value
Number
Average Value
Number
Average Value
LOANS ORIGINATED
15
$118,073
87
$132,832
122
$140,225
6
$51,085
29
$125,171
APPLICATIONS APPROVED, NOT ACCEPTED
1
$141,990
8
$123,622
13
$127,458
0
$0
4
$86,360
APPLICATIONS DENIED
2
$56,300
20
$90,062
48
$127,011
6
$27,928
5
$100,464
APPLICATIONS WITHDRAWN
2
$72,905
14
$122,662
39
$142,844
2
$31,110
2
$97,525
FILES CLOSED FOR INCOMPLETENESS
0
$0
2
$136,075
10
$141,611
0
$0
0
$0
Aggregated Statistics For Year 2000 (Based on 1 partial tract)
A) FHA, FSA/RHS & VA Home Purchase Loans
B) Conventional Home Purchase Loans
C) Refinancings
D) Home Improvement Loans
F) Non-occupant Loans on < 5 Family Dwellings (A B C & D)
Number
Average Value
Number
Average Value
Number
Average Value
Number
Average Value
Number
Average Value
LOANS ORIGINATED
8
$113,031
86
$118,229
39
$106,347
11
$27,066
17
$88,936
APPLICATIONS APPROVED, NOT ACCEPTED
2
$93,135
10
$102,372
10
$129,778
3
$41,477
4
$163,655
APPLICATIONS DENIED
2
$146,955
21
$75,650
31
$108,403
7
$32,936
5
$65,118
APPLICATIONS WITHDRAWN
1
$137,790
6
$164,703
17
$106,966
2
$62,025
1
$257,270
FILES CLOSED FOR INCOMPLETENESS
0
$0
1
$167,570
5
$107,716
0
$0
0
$0
Aggregated Statistics For Year 1999 (Based on 1 partial tract)
A) FHA, FSA/RHS & VA Home Purchase Loans
B) Conventional Home Purchase Loans
C) Refinancings
D) Home Improvement Loans
F) Non-occupant Loans on < 5 Family Dwellings (A B C & D)
#35 on the list of "Top 101 cities with the most residents born in Northern America (population 500+)"
#35 on the list of "Top 101 cities with the most residents born in Canada (population 500+)"
#7 on the list of "Top 101 counties with the lowest Ozone (1-hour) air pollution readings in 2012 (ppm)"
#8 on the list of "Top 101 counties with the lowest Particulate Matter (PM2.5) Annual air pollution readings in 2012 (µg/m3)"
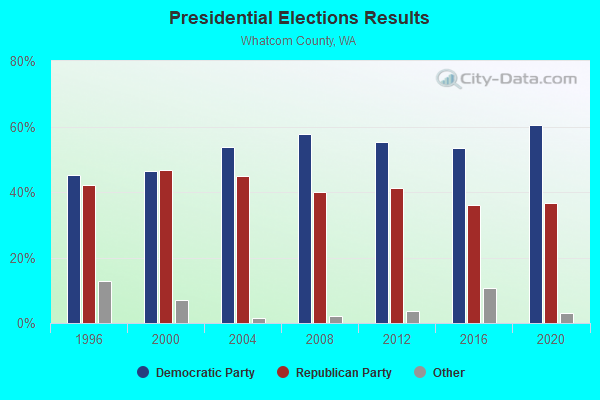
#42 on the list of "Top 101 counties with highest percentage of residents voting for 3rd party candidates in the 2012 Presidential Election (pop. 50,000+)"


 Recent articles from our blog. Our writers, many of them Ph.D. graduates or candidates, create easy-to-read articles on a wide variety of topics.

 (17.7 miles