Trenton: Fire Incidents, New Jersey (NJ)
Where are fire incidents reported in Trenton, NJ
Something went wrong! Please refresh the page.
| Fire incidents reported | |
|---|---|
| Sreet name | Count |
| STATE ST | 3,398 |
| CLINTON AVE | 722 |
| BROAD ST | 608 |
| GREENWOOD AVE | 480 |
| BRUNSWICK AVE | 438 |
| OAKLAND ST | 334 |
| HAMILTON AVE | 288 |
| BELLEVUE AVE | 254 |
| HOFFMAN AVE | 254 |
| STUYVESANT AVE | 244 |
| ACADEMY ST | 240 |
| KINGSBURY SQ | 226 |
| SULLIVAN WAY | 214 |
| OLDEN AVE | 180 |
| HANOVER ST | 170 |
| PENNINGTON AVE | 164 |
| CENTRE ST | 162 |
| GENESEE ST | 160 |
| WILLOW ST | 160 |
| EDGEWOOD AVE | 156 |
| CHESTNUT AVE | 150 |
| COOLIDGE AVE | 150 |
| FRANKLIN ST | 142 |
| RIVERSIDE DR | 138 |
| MONMOUTH ST | 132 |
| CHAMBERS ST | 126 |
| PERRY ST | 122 |
| SOUTHARD ST | 120 |
| ANDERSON ST | 118 |
| FERRY ST | 116 |
2005 - 2018 National Fire Incident Reporting System (NFIRS) incidents
- Incident types reported to NFIRS in Trenton, NJ
- 13,13433.8%Rescue & EMS
- 9,64724.8%Fire
- 7,96620.5%Hazardous Condition
- 4,47611.5%False Alarm
- 2,1045.4%Service Call
- 1,4353.7%Good Intent Call
- 730.2%Overpressure Rupture
- 620.2%Special Incident
- Fire incident types reported to NFIRS in Trenton, NJ
- 7,45577.3%Structure Fires
- 1,22112.7%Outside Fires
- 8188.5%Mobile Property/Vehicle Fires
- 1531.6%Other
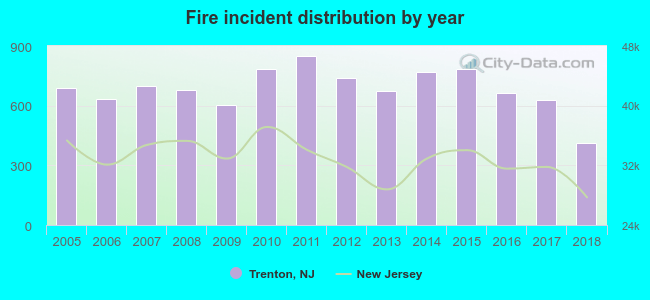 Based on the data from the years 2005 - 2018 the average number of fire incidents per year is 687. The highest number of fire incidents - 851 took place in 2011, and the least - 411 in 2018. The data has a decreasing trend.
The average number of yearly fire incidents per 10k residents in Trenton, NJ compared to nearest cities:
(Note: Based on data for the last 3 years, including only cities with population 5,000 and above)
| Trenton: | 67.6 |
| Ewing: | 70.3 |
| Yardville: | 1.4 |
| Princeton: | 24.9 |
| Burlington: | 10.2 |
| Hightstown: | 74.8 |
| Franklin Park: | 26.3 |
| Dayton: | 16.0 |
| Kendall Park: | 7.1 |
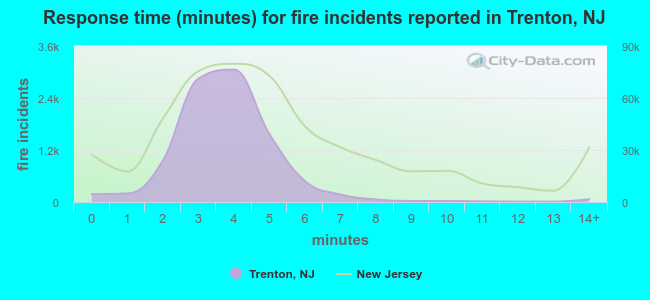 The median response time based on all reported fire incidents is 4 minutes. This is lower compared to the state median value.
The median response time in Trenton, NJ compared to nearest cities:
(Note: Based on data for all years, including only cities with at least 500 fire incidents)
| Trenton: | 4 minutes |
| Ewing: | 6 minutes |
| Lawrenceville: | 7 minutes |
| Bordentown: | 7 minutes |
| Robbinsville: | 5 minutes |
| Pennington: | 7 minutes |
| Florence: | 8 minutes |
| Princeton: | 8 minutes |
| Hopewell: | 9 minutes |
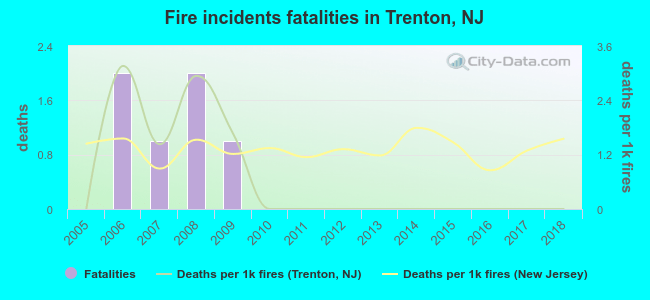 According to the data from the years 2005 - 2018 the average number of fire-related yearly deaths is 0. The highest number of reported deaths - 2 took place in 2006, and the lowest - 0 in 2005. The data has a constant trend.
The average number of fatalities per 1,000 fires is 1. This indicator was the highest - 3 in 2006, and the lowest 0 in 2005. The trend for deaths per 1,000 fire incidents is dropping. Compared to the New Jersey value the number of deaths per 1,000 incidents is much lower.
According to the data from the years 2005 - 2018 the average number of fire-related yearly deaths is 0. The highest number of reported deaths - 2 took place in 2006, and the lowest - 0 in 2005. The data has a constant trend.
The average number of fatalities per 1,000 fires is 1. This indicator was the highest - 3 in 2006, and the lowest 0 in 2005. The trend for deaths per 1,000 fire incidents is dropping. Compared to the New Jersey value the number of deaths per 1,000 incidents is much lower.Deaths per 1,000 incidents in Trenton, NJ compared to nearest cities:
(Note: Based on data for all years, including only cities with at least 2,500 fire incidents)
| Trenton: | 0.6 |
| Ewing: | 0.8 |
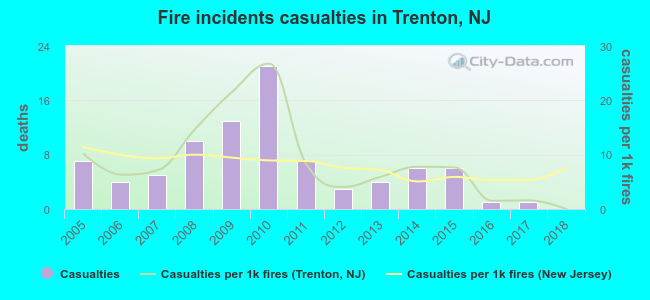 Based on the data from the years 2005 - 2018 the average number of fire-related casualties per year is 6. The highest number of reported casualties - 21 took place in 2010, and the lowest - 0 in 2018. The data has a dropping trend.
The average number of casualties per 1,000 fire incidents is 9. This indicator was the highest - 27 in 2010, and the lowest 0 in 2018. The trend for casualties per 1,000 incidents is declining. Compared to the state value the number of casualties per 1,000 fire incidents is similar.
Based on the data from the years 2005 - 2018 the average number of fire-related casualties per year is 6. The highest number of reported casualties - 21 took place in 2010, and the lowest - 0 in 2018. The data has a dropping trend.
The average number of casualties per 1,000 fire incidents is 9. This indicator was the highest - 27 in 2010, and the lowest 0 in 2018. The trend for casualties per 1,000 incidents is declining. Compared to the state value the number of casualties per 1,000 fire incidents is similar.Casualties per 1,000 incidents in Trenton, NJ compared to nearest cities:
(Note: Based on data for all years, including only cities with at least 500 fire incidents)
| Trenton: | 9.2 |
| Ewing: | 3.4 |
| Lawrenceville: | 9.6 |
| Bordentown: | 0.0 |
| Robbinsville: | 3.1 |
| Pennington: | 2.9 |
| Florence: | 9.5 |
| Princeton: | 9.0 |
| Hopewell: | 6.6 |
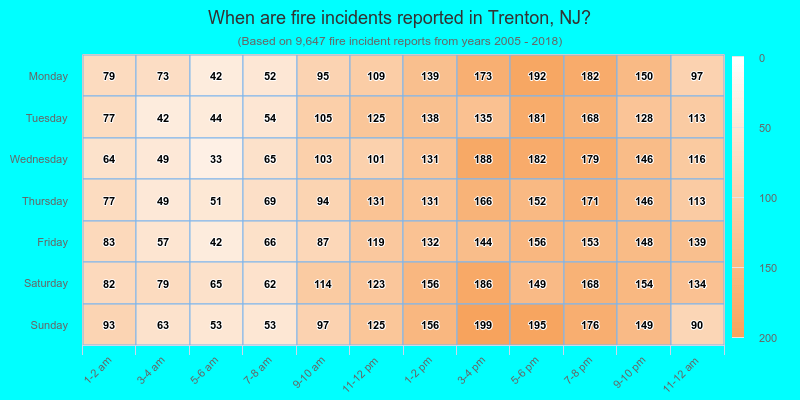
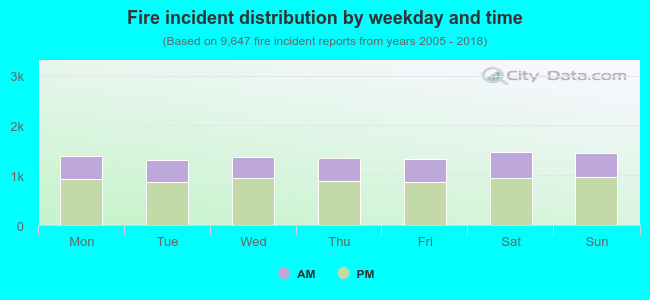 33.6% incidents where reported in the morning and 66.4% in the evening. The most fires (15.3%) took place on Saturday, and the least (13.6%) on Tuesday.
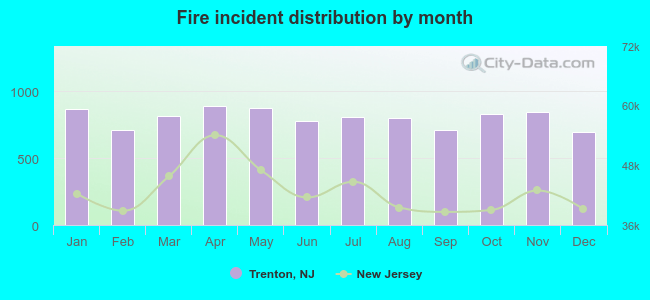 Based on the 9,647 fire incident reports from years 2005 - 2018 most fires (9.2%) took place during April, and the least (7.2%) in December.
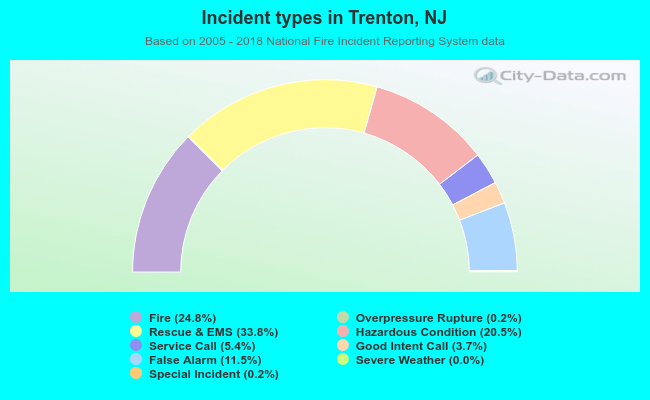 Out of all 38,904 cases reported during the years 2005 - 2018, the most belonged to the categories: Rescue & EMS (33.8%), Fire (24.8%), and Hazardous Condition (20.5%).
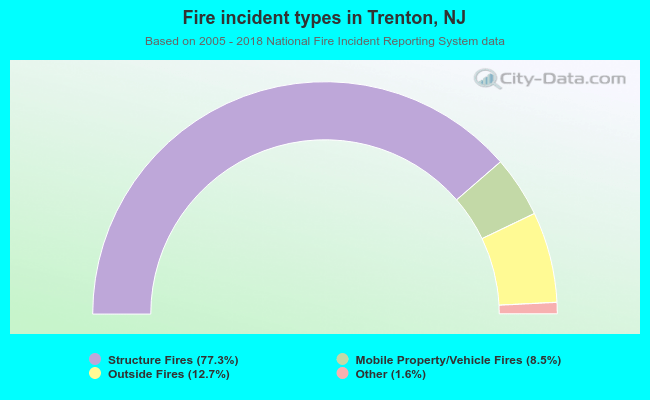 When looking into fire subcategories, the most incidents belonged to: Structure Fires (77.3%), and Outside Fires (12.7%).