Princeton: Fire Incidents, New Jersey (NJ)
Where are fire incidents reported in Princeton, NJ
Something went wrong! Please refresh the page.
| Fire incidents reported | |
|---|---|
| Sreet name | Count |
| NASSAU ST | 150 |
| WITHERSPOON ST | 138 |
| NASSAU PARK BLVD | 112 |
| ROUTE ONE | 88 |
| ALEXANDER RD | 66 |
| PROSPECT AVE | 62 |
| BRUNSWICK PIKE HWY | 60 |
| RAYMOND RD | 58 |
| PALMER SQ | 48 |
| WASHINGTON RD | 48 |
| ELM DR | 44 |
| ELM RD | 40 |
| STATE RD | 40 |
| HARRISON ST | 38 |
| EWING ST | 36 |
| MOORE ST | 36 |
| ROUTE 27 | 32 |
| REDDING CIR | 26 |
| GREAT RD | 22 |
| HODGE RD | 22 |
| QUARRY ST | 22 |
| SPRING ST | 22 |
| JOHN ST | 20 |
| LAWRENCE DR | 20 |
| LEIGH AVE | 20 |
| STOCKTON ST | 20 |
| BRUNSWICK PIKE | 18 |
| MERCER ST | 18 |
| SERGEANT ST | 18 |
| BAYARD LN | 16 |
| Other | 191 |
2002 - 2018 National Fire Incident Reporting System (NFIRS) incidents
- Incident types reported to NFIRS in Princeton, NJ
- 2,23636.9%Hazardous Condition
- 1,55125.6%Fire
- 1,12918.7%False Alarm
- 61110.1%Good Intent Call
- 3215.3%Service Call
- 1752.9%Rescue & EMS
- 120.2%Overpressure Rupture
- 100.2%Special Incident
- 80.1%Severe Weather
- Fire incident types reported to NFIRS in Princeton, NJ
- 95861.8%Structure Fires
- 42327.3%Outside Fires
- 1378.8%Mobile Property/Vehicle Fires
- 332.1%Other
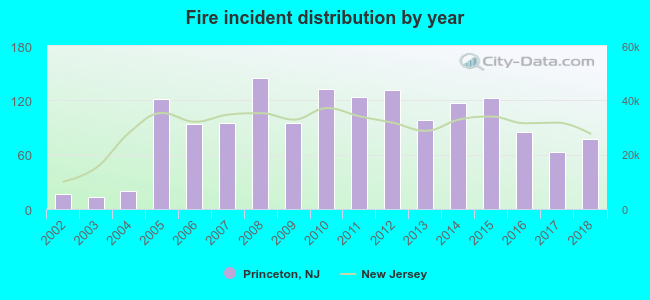 According to the data from the years 2002 - 2018 the average number of fires per year is 91. The highest number of fire incidents - 145 took place in 2008, and the least - 13 in 2003. The data has a growing trend.
The average number of yearly fire incidents per 10k residents in Princeton, NJ compared to nearest cities:
(Note: Based on data for the last 3 years, including only cities with population 5,000 and above)
| Princeton: | 24.9 |
| Kendall Park: | 7.1 |
| Dayton: | 16.0 |
| Hightstown: | 74.8 |
| Ewing: | 70.3 |
| Trenton: | 67.6 |
| Jamesburg: | 16.6 |
| Yardville: | 1.4 |
| Manville: | 7.7 |
 The median response time based on all reported fire incidents is 8 minutes. This is higher compared to the state median value.
The median response time in Princeton, NJ compared to nearest cities:
(Note: Based on data for all years, including only cities with at least 500 fire incidents)
| Princeton: | 8 minutes |
| Lawrenceville: | 7 minutes |
| Hopewell: | 9 minutes |
| Monmouth Junction: | 6 minutes |
| Pennington: | 7 minutes |
| Cranbury: | 7 minutes |
| Ewing: | 6 minutes |
| Robbinsville: | 5 minutes |
| Trenton: | 4 minutes |
 According to the reports from the years 2002 - 2018 the average number of fire-related yearly deaths is 0. The highest number of reported deaths - 1 took place in 2002, and the lowest - 0 in 2003. The data has a dropping trend.
 Based on the reports from the years 2002 - 2018 the average number of fire-related yearly casualties is 1. The highest number of reported injuries - 5 took place in 2008, and the lowest - 0 in 2003. The data has a dropping trend.
The average number of casualties per 1,000 fire incidents is 15. This indicator was the highest - 176 in 2002, and the lowest 0 in 2003. The trend for casualties per 1,000 incidents is dropping. Compared to the New Jersey value the number of injuries per 1,000 fires is about the same.
Based on the reports from the years 2002 - 2018 the average number of fire-related yearly casualties is 1. The highest number of reported injuries - 5 took place in 2008, and the lowest - 0 in 2003. The data has a dropping trend.
The average number of casualties per 1,000 fire incidents is 15. This indicator was the highest - 176 in 2002, and the lowest 0 in 2003. The trend for casualties per 1,000 incidents is dropping. Compared to the New Jersey value the number of injuries per 1,000 fires is about the same.Casualties per 1,000 incidents in Princeton, NJ compared to nearest cities:
(Note: Based on data for all years, including only cities with at least 500 fire incidents)
| Princeton: | 9.0 |
| Lawrenceville: | 9.6 |
| Hopewell: | 6.6 |
| Monmouth Junction: | 15.6 |
| Pennington: | 2.9 |
| Cranbury: | 0.0 |
| Ewing: | 3.4 |
| Robbinsville: | 3.1 |
| Trenton: | 9.2 |
 31.7% incidents where reported in the morning and 68.3% in the evening. The most fires (17.2%) took place on Saturday, and the least (12.1%) on Sunday.
 Based on the 1,551 incident reports from years 2002 - 2018 most fires (10.8%) took place during April, and the least (5.9%) in October.
 Out of all 6,053 cases reported during the years 2002 - 2018, the most belonged to the categories: Hazardous Condition (36.9%), Fire (25.6%), and False Alarm (18.7%).
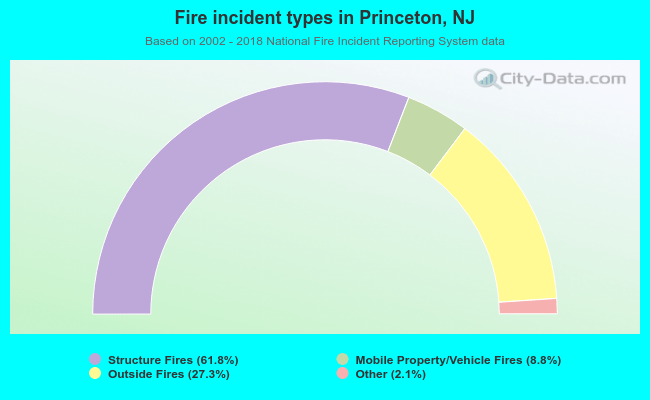 When looking into fire subcategories, the most reports belonged to: Structure Fires (61.8%), and Outside Fires (27.3%).