Franklin Park: Fire Incidents, New Jersey (NJ)
Where are fire incidents reported in Franklin Park, NJ
Something went wrong! Please refresh the page.
|
| |||||||||||||||||||||||||||||||||||||||||||||||||||||||||||||||||||||||||||||||||||||||||||||||||||||||||||||
2005 - 2018 National Fire Incident Reporting System (NFIRS) incidents
- Incident types reported to NFIRS in Franklin Park, NJ
- 97038.2%Hazardous Condition
- 67926.8%False Alarm
- 46718.4%Fire
- 1787.0%Service Call
- 1626.4%Good Intent Call
- 773.0%Rescue & EMS
- 30.1%Special Incident
- Fire incident types reported to NFIRS in Franklin Park, NJ
- 19140.9%Outside Fires
- 13128.1%Structure Fires
- 10121.6%Other
- 449.4%Mobile Property/Vehicle Fires
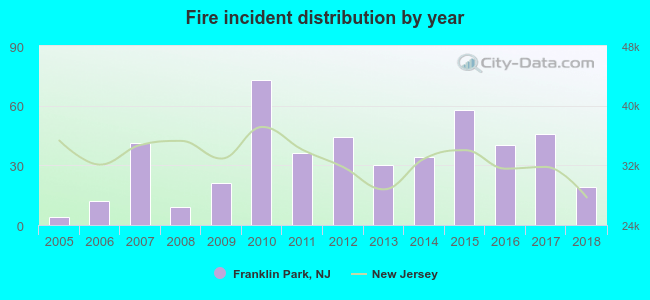 According to the data from the years 2005 - 2018 the average number of fire incidents per year is 33. The highest number of reported fire incidents - 73 took place in 2010, and the least - 4 in 2005. The data has a growing trend.
The average number of yearly fire incidents per 10k residents in Franklin Park, NJ compared to nearest cities:
(Note: Based on data for the last 3 years, including only cities with population 5,000 and above)
| Franklin Park: | 26.3 |
| Burlington: | 10.2 |
| Palmyra: | 35.0 |
| Marlton: | 8.6 |
| Pennsauken: | 43.1 |
| Haddonfield: | 26.9 |
| Collingswood: | 84.3 |
| Camden: | 55.5 |
| Audubon: | 35.6 |
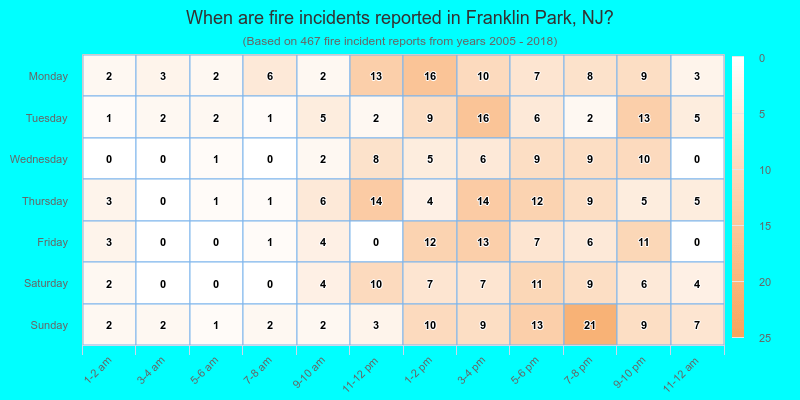
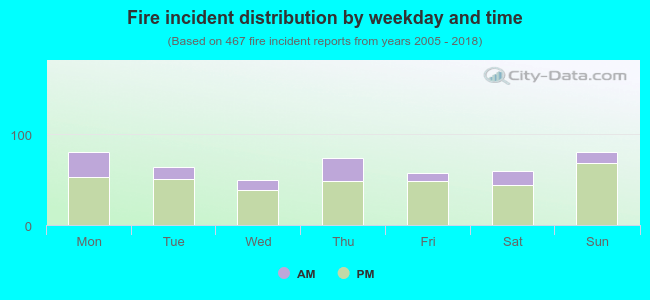 24.2% incidents where reported in the morning and 75.8% in the evening. The most fires (17.3%) took place on Monday, and the least (10.7%) on Wednesday.
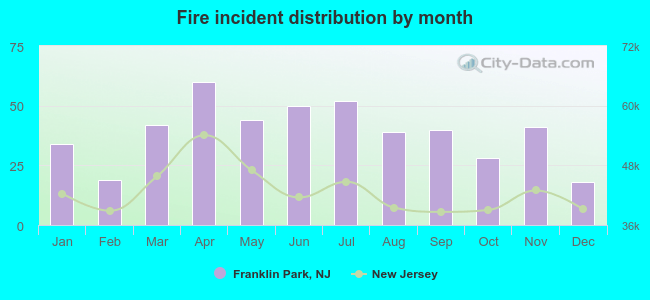 Based on the 467 fire incident reports from years 2005 - 2018 most fires (12.8%) took place during April, and the least (3.9%) in December.
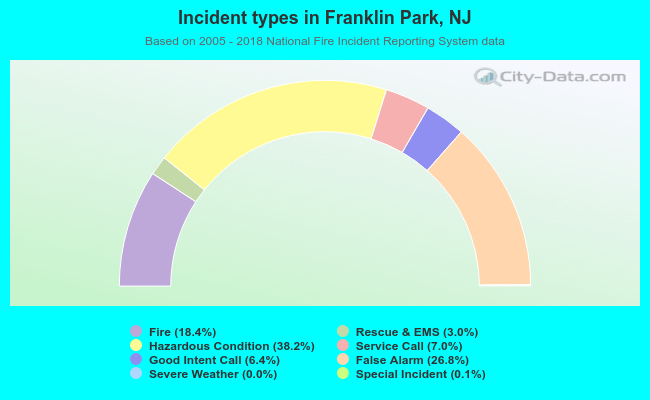 Out of all 2,537 cases reported during the years 2005 - 2018, the most belonged to the categories: Rescue & EMS (38.2%), Good Intent Call (26.8%), and Fire (18.4%).
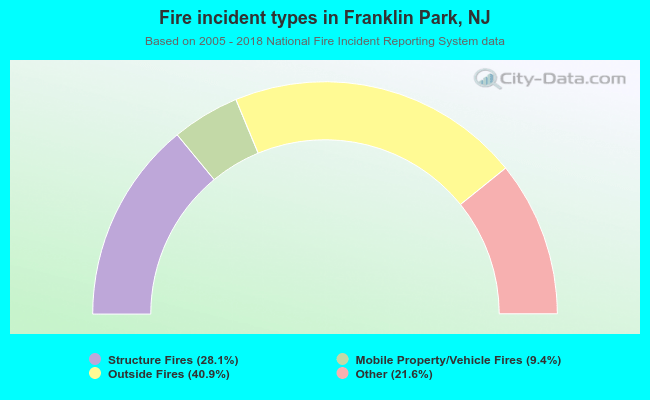 When looking into fire subcategories, the most incidents belonged to: Outside Fires (40.9%), and Structure Fires (28.1%).