Sudbury: Fire Incidents, Massachusetts (MA)
Where are fire incidents reported in Sudbury, MA
Something went wrong! Please refresh the page.
| Fire incidents reported | |
|---|---|
| Sreet name | Count |
| BOSTON POST RD | 234 |
| HUDSON RD | 78 |
| DUTTON RD | 44 |
| NORTH RD | 44 |
| CONCORD RD | 40 |
| NOBSCOT RD | 40 |
| GOODMANS HILL RD | 34 |
| PEAKHAM RD | 26 |
| MAYNARD RD | 20 |
| OLD SUDBURY RD | 20 |
| UNION AVE | 20 |
| MORSE RD | 18 |
| HORSE POND RD | 16 |
| POWERS RD | 16 |
| PRATTS MILL RD | 16 |
| WAYSIDE INN RD | 16 |
| BOSTON POST ROAD | 14 |
| HAYNES RD | 14 |
| LANDHAM RD | 14 |
| OLD COUNTY RD | 14 |
| STONE RD | 14 |
| WILLIS RD | 14 |
| BRIMSTONE LA | 10 |
| MARLBORO RD | 10 |
| MOSSMAN RD | 10 |
| RUDDOCK RD | 10 |
| STOCK FARM RD | 10 |
| BLUEBERRY HILL LA | 8 |
| DUDLEY RD | 8 |
| GREAT RD | 8 |
2002 - 2018 National Fire Incident Reporting System (NFIRS) incidents
- Incident types reported to NFIRS in Sudbury, MA
- 5,98947.3%Rescue & EMS
- 2,31018.3%Hazardous Condition
- 1,75413.9%False Alarm
- 8526.7%Service Call
- 8176.5%Fire
- 7576.0%Good Intent Call
- 1431.1%Special Incident
- 190.2%Severe Weather
- Fire incident types reported to NFIRS in Sudbury, MA
- 39248.0%Structure Fires
- 34642.4%Outside Fires
- 546.6%Mobile Property/Vehicle Fires
- 253.1%Other
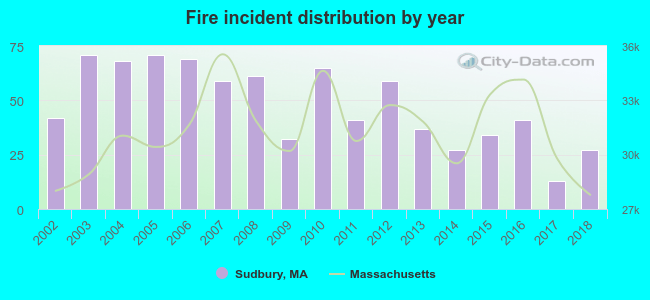 According to the data from the years 2002 - 2018 the average number of fires per year is 48. The highest number of reported fire incidents - 71 took place in 2003, and the least - 13 in 2017. The data has a declining trend.
The average number of yearly fire incidents per 10k residents in Sudbury, MA compared to nearest cities:
(Note: Based on data for the last 3 years, including only cities with population 5,000 and above)
| Sudbury: | 15.3 |
| Maynard: | 25.7 |
| Wayland: | 19.2 |
| Stow: | 22.8 |
| Concord: | 30.8 |
| Framingham: | 89.7 |
| Acton: | 24.9 |
| Marlborough: | 31.4 |
| Hudson: | 44.1 |
 The median response time based on all reported fire incidents is 4 minutes. This is similar to the state median value.
The median response time in Sudbury, MA compared to nearest cities:
(Note: Based on data for all years, including only cities with at least 500 fire incidents)
| Sudbury: | 4 minutes |
| Wayland: | 3 minutes |
| Concord: | 6 minutes |
| Framingham: | 4 minutes |
| Acton: | 4 minutes |
| Marlborough: | 5 minutes |
| Hudson: | 3 minutes |
| Lincoln: | 5 minutes |
| Weston: | 4 minutes |
 Based on the reports from the years 2002 - 2018 the average number of fire-related yearly casualties is 0. The highest number of reported injuries - 2 took place in 2012, and the lowest - 0 in 2002. The data has a rising trend.
The average number of injuries per 1,000 fires is 9. This indicator was the highest - 49 in 2016, and the lowest 0 in 2002. The trend for injuries per 1,000 fire incidents is growing. Compared to the state value the number of injuries per 1,000 fires is lower.
Based on the reports from the years 2002 - 2018 the average number of fire-related yearly casualties is 0. The highest number of reported injuries - 2 took place in 2012, and the lowest - 0 in 2002. The data has a rising trend.
The average number of injuries per 1,000 fires is 9. This indicator was the highest - 49 in 2016, and the lowest 0 in 2002. The trend for injuries per 1,000 fire incidents is growing. Compared to the state value the number of injuries per 1,000 fires is lower.Casualties per 1,000 incidents in Sudbury, MA compared to nearest cities:
(Note: Based on data for all years, including only cities with at least 500 fire incidents)
| Sudbury: | 8.6 |
| Wayland: | 11.6 |
| Concord: | 10.1 |
| Framingham: | 8.3 |
| Acton: | 1.3 |
| Marlborough: | 21.3 |
| Hudson: | 34.8 |
| Lincoln: | 0.0 |
| Weston: | 12.5 |
 29.4% incidents where reported in the morning and 70.6% in the evening. The most fires (16.4%) took place on Thursday, and the least (12.6%) on Sunday.
 Based on the 817 incident reports from years 2002 - 2018 most fires (14.1%) took place during April, and the least (5.4%) in September.
 Out of all 12,649 cases reported during the years 2002 - 2018, the most belonged to the categories: Rescue & EMS (47.3%), Hazardous Condition (18.3%), and False Alarm (13.9%).
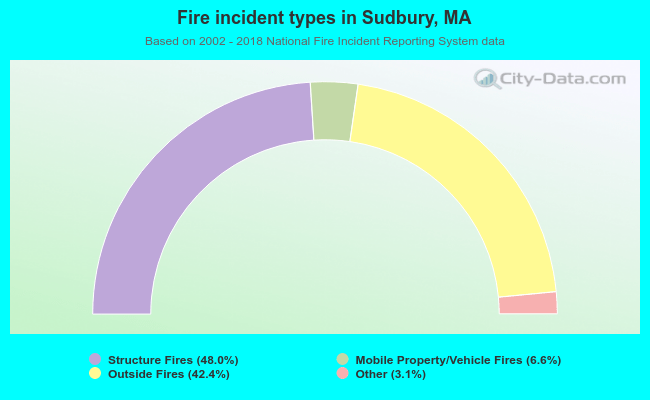 When looking into fire subcategories, the most incidents belonged to: Structure Fires (48.0%), and Outside Fires (42.4%).