Stow: Fire Incidents, Massachusetts (MA)
Where are fire incidents reported in Stow, MA
Something went wrong! Please refresh the page.
|
| |||||||||||||||||||||||||||||||||||||||||||||||||||||||||||||||||||||||||||||||||||||||||||||||||||||||||||||
2002 - 2018 National Fire Incident Reporting System (NFIRS) incidents
- Incident types reported to NFIRS in Stow, MA
- 1,99653.0%Rescue & EMS
- 55914.8%Hazardous Condition
- 43011.4%False Alarm
- 3008.0%Fire
- 2767.3%Service Call
- 1594.2%Good Intent Call
- 220.6%Special Incident
- 210.6%Severe Weather
- 40.1%Overpressure Rupture
- Fire incident types reported to NFIRS in Stow, MA
- 13545.0%Structure Fires
- 12040.0%Outside Fires
- 279.0%Mobile Property/Vehicle Fires
- 186.0%Other
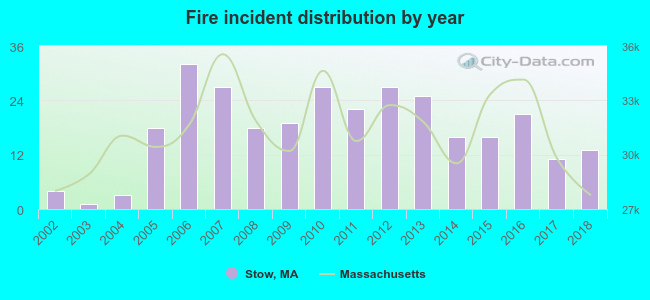 According to the data from the years 2002 - 2018 the average number of fires per year is 18. The highest number of reported fire incidents - 32 took place in 2006, and the least - 1 in 2003. The data has a rising trend.
The average number of yearly fire incidents per 10k residents in Stow, MA compared to nearest cities:
(Note: Based on data for the last 3 years, including only cities with population 5,000 and above)
| Stow: | 22.8 |
| Maynard: | 25.7 |
| Hudson: | 44.1 |
| Sudbury: | 15.3 |
| Acton: | 24.9 |
| Marlborough: | 31.4 |
| Concord: | 30.8 |
| Harvard: | 36.3 |
| Littleton: | 35.5 |

 31.3% incidents where reported in the morning and 68.7% in the evening. The most fires (17.3%) took place on Saturday, and the least (11.3%) on Thursday.
 According to the 300 fire incident reports from years 2002 - 2018 most fires (20.0%) took place during April, and the least (4.3%) in October.
 Out of all 3,767 cases reported during the years 2002 - 2018, the most belonged to the categories: Rescue & EMS (53.0%), Hazardous Condition (14.8%), and False Alarm (11.4%).
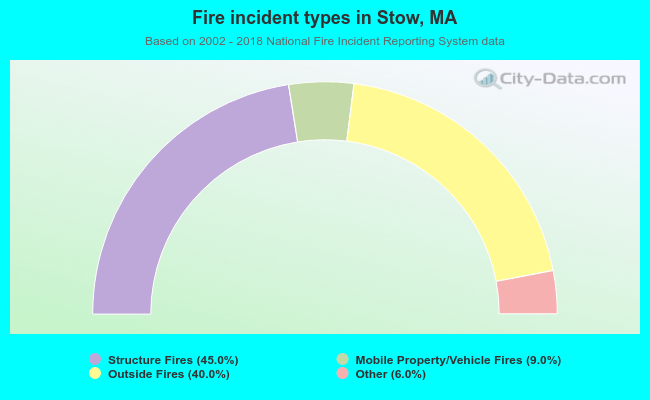 When looking into fire subcategories, the most incidents belonged to: Structure Fires (45.0%), and Outside Fires (40.0%).