Concord: Fire Incidents, Massachusetts (MA)
Where are fire incidents reported in Concord, MA
Something went wrong! Please refresh the page.
| Fire incidents reported | |
|---|---|
| Sreet name | Count |
| MAIN ST | 120 |
| LOWELL RD | 72 |
| WALDEN ST | 62 |
| COMMONWEALTH AVE | 58 |
| ELM ST | 56 |
| SUDBURY RD | 48 |
| CONCORD TPKE | 46 |
| OLD ROAD TO NINE ACRE COR | 46 |
| MONUMENT ST | 36 |
| BARRETTS MILL RD | 34 |
| BEDFORD ST | 34 |
| LEXINGTON RD | 32 |
| OLD MARLBORO RD | 28 |
| THOREAU ST | 26 |
| BAKER AVE | 22 |
| FAIRHAVEN RD | 22 |
| OLD BEDFORD RD | 18 |
| STRAWBERRY HILL RD | 18 |
| WESTFORD RD | 18 |
| CAMBRIDGE TPKE | 16 |
| BEHARRELL ST | 14 |
| HUBBARD ST | 14 |
| LAWS BROOK RD | 14 |
| VIRGINIA RD | 14 |
| CATERINA HTS | 12 |
| EVERETT ST | 12 |
| MAIN STREET | 12 |
| COLLEGE RD | 10 |
| ELSINORE ST | 10 |
| GARFIELD RD | 10 |
2002 - 2018 National Fire Incident Reporting System (NFIRS) incidents
- Incident types reported to NFIRS in Concord, MA
- 6,86043.2%Rescue & EMS
- 3,03819.1%False Alarm
- 3,01519.0%Hazardous Condition
- 1,3298.4%Service Call
- 8945.6%Fire
- 6534.1%Good Intent Call
- 560.4%Special Incident
- 190.1%Severe Weather
- Fire incident types reported to NFIRS in Concord, MA
- 42948.0%Structure Fires
- 29633.1%Outside Fires
- 9310.4%Mobile Property/Vehicle Fires
- 768.5%Other
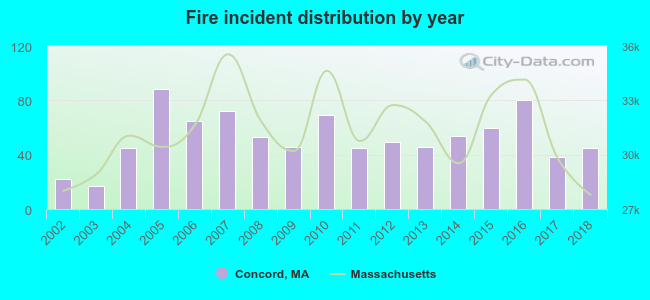 According to the data from the years 2002 - 2018 the average number of fires per year is 53. The highest number of reported fires - 88 took place in 2005, and the least - 17 in 2003. The data has a rising trend.
The average number of yearly fire incidents per 10k residents in Concord, MA compared to nearest cities:
(Note: Based on data for the last 3 years, including only cities with population 5,000 and above)
| Concord: | 30.8 |
| Acton: | 24.9 |
| Lincoln: | 111.1 |
| Maynard: | 25.7 |
| Sudbury: | 15.3 |
| Bedford: | 18.5 |
| Stow: | 22.8 |
| Lexington: | 11.5 |
| Wayland: | 19.2 |
 The median response time based on all reported fire incidents is 6 minutes. This is higher than the state median value.
The median response time in Concord, MA compared to nearest cities:
(Note: Based on data for all years, including only cities with at least 500 fire incidents)
| Concord: | 6 minutes |
| Acton: | 4 minutes |
| Lincoln: | 5 minutes |
| Sudbury: | 4 minutes |
| Bedford: | 4 minutes |
| Lexington: | 5 minutes |
| Wayland: | 3 minutes |
| Weston: | 4 minutes |
| Littleton: | 6 minutes |
 According to the reports from the years 2002 - 2018 the average number of fire-related yearly casualties is 1. The highest number of reported casualties - 3 took place in 2005, and the lowest - 0 in 2002. The data has a constant trend.
The average number of injuries per 1,000 fires is 7. This indicator was the highest - 43 in 2010, and the lowest 0 in 2002. The trend for injuries per 1,000 fires is constant. Compared to the Massachusetts value the number of casualties per 1,000 incidents is about the same.
According to the reports from the years 2002 - 2018 the average number of fire-related yearly casualties is 1. The highest number of reported casualties - 3 took place in 2005, and the lowest - 0 in 2002. The data has a constant trend.
The average number of injuries per 1,000 fires is 7. This indicator was the highest - 43 in 2010, and the lowest 0 in 2002. The trend for injuries per 1,000 fires is constant. Compared to the Massachusetts value the number of casualties per 1,000 incidents is about the same.
 33.9% incidents where reported in the morning and 66.1% in the evening. The most fires (15.4%) took place on Saturday, and the least (12.0%) on Thursday.
 Based on the 894 incident reports from years 2002 - 2018 most fires (13.3%) took place during April, and the least (5.7%) in February.
 Out of all 15,873 cases reported during the years 2002 - 2018, the most belonged to the categories: Rescue & EMS (43.2%), False Alarm (19.1%), and Hazardous Condition (19.0%).
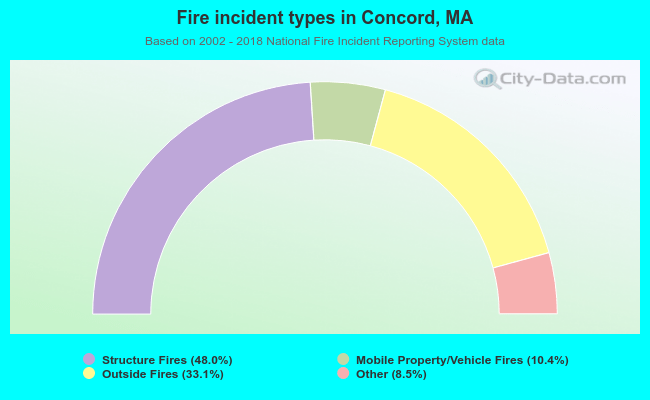 When looking into fire subcategories, the most reports belonged to: Structure Fires (48.0%), and Outside Fires (33.1%).