South Boston: Fire Incidents, Virginia (VA)
Where are fire incidents reported in South Boston, VA
Something went wrong! Please refresh the page.
| Fire incidents reported | |
|---|---|
| Sreet name | Count |
| BILL TUCK HWY | 140 |
| PHILPOTT RD | 112 |
| BOLD SPRINGS RD | 104 |
| HALIFAX RD | 92 |
| MAIN ST | 78 |
| OLD HALIFAX RD | 78 |
| BANE ST | 68 |
| HUELL MATTHEWS HWY | 52 |
| SINAI RD | 52 |
| OLD CLUSTER SPRINGS RD | 48 |
| RIVER RD | 48 |
| WILBORN AVE | 46 |
| CLUSTER SPRINGS RD | 40 |
| HAMILTON BLVD | 40 |
| JAMES D HAGOOD HWY | 40 |
| HYCO RD | 38 |
| BERRY HILL RD | 36 |
| POPLAR CREEK ST | 36 |
| CHERRY HILL CHURCH RD | 34 |
| ALPHONSE DAIRY RD | 32 |
| DAN RIVER CHURCH RD | 32 |
| EAST HYCO RD | 32 |
| FERRY ST | 30 |
| PHILPOTT HWY | 26 |
| GREENS FOLLY RD | 24 |
| LINCOLN DR | 24 |
| ALDERSON AVE | 22 |
| NORTH MAIN ST | 22 |
| ROSE HILL DR | 22 |
| SEYMOUR DR | 22 |
| Other | 455 |
2002 - 2018 National Fire Incident Reporting System (NFIRS) incidents
- Incident types reported to NFIRS in South Boston, VA
- 7,68664.9%Rescue & EMS
- 1,92516.3%Fire
- 7706.5%Hazardous Condition
- 6595.6%Good Intent Call
- 5014.2%False Alarm
- 2802.4%Service Call
- Fire incident types reported to NFIRS in South Boston, VA
- 91647.6%Structure Fires
- 66934.8%Outside Fires
- 29915.5%Mobile Property/Vehicle Fires
- 412.1%Other
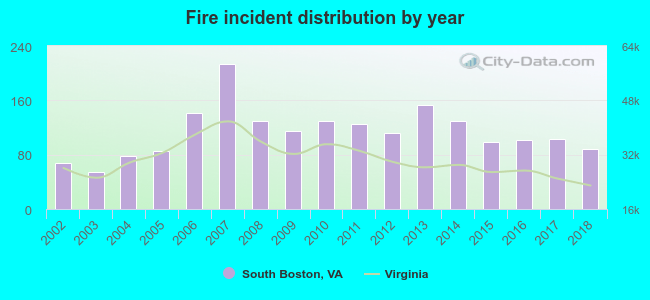 Based on the data from the years 2002 - 2018 the average number of fires per year is 113. The highest number of reported fire incidents - 214 took place in 2007, and the least - 55 in 2003. The data has a rising trend.
The average number of yearly fire incidents per 10k residents in South Boston, VA compared to nearest cities:
(Note: Based on data for the last 3 years, including only cities with population 5,000 and above)
| South Boston: | 121.9 |
| Danville: | 62.9 |
| Timberlake: | 0.8 |
| Farmville: | 106.5 |
| Forest: | 44.3 |
| Lynchburg: | 28.0 |
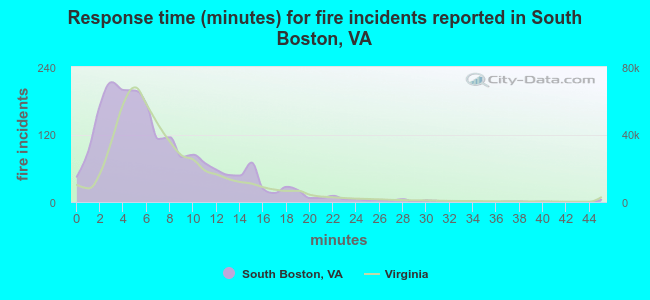 The median response time based on all reported fire incidents is 6 minutes. This is close to the state median value.
The median response time in South Boston, VA compared to nearest cities:
(Note: Based on data for all years, including only cities with at least 500 fire incidents)
| South Boston: | 6 minutes |
| Halifax: | 10 minutes |
| Nathalie: | 9 minutes |
| Clarksville: | 10 minutes |
| Roxboro: | 8 minutes |
| Chase City: | 8 minutes |
| Blairs: | 10 minutes |
| Chatham: | 12 minutes |
| Boydton: | 8 minutes |
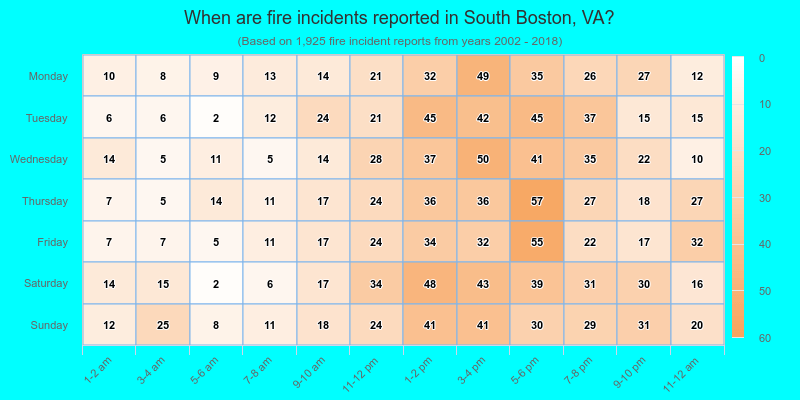
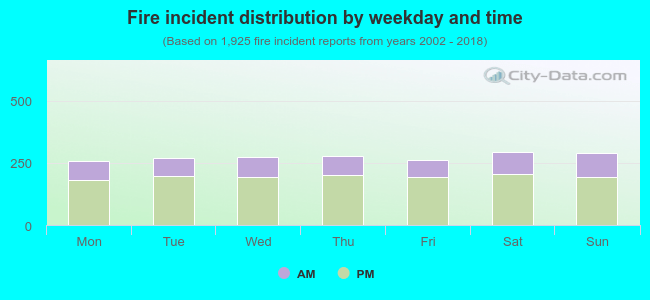 29.0% incidents where reported in the morning and 71.0% in the evening. The most fires (15.3%) took place on Saturday, and the least (13.3%) on Monday.
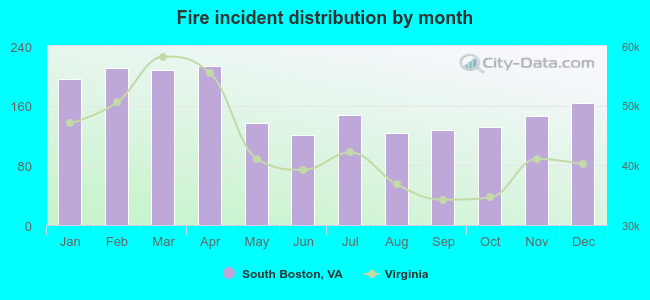 According to the 1,925 fire incident reports from years 2002 - 2018 most fires (11.1%) took place during April, and the least (6.3%) in June.
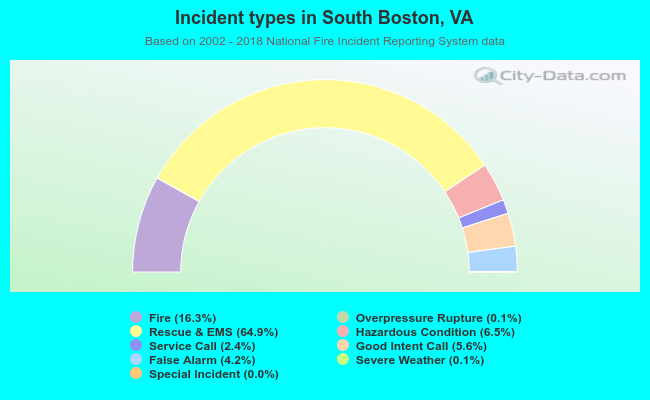 Out of all 11,837 cases reported during the years 2002 - 2018, the most belonged to the categories: Rescue & EMS (64.9%), Fire (16.3%), and Hazardous Condition (6.5%).
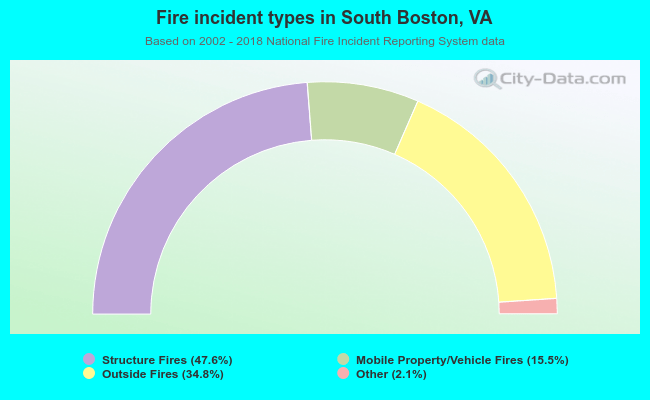 When looking into fire subcategories, the most reports belonged to: Structure Fires (47.6%), and Outside Fires (34.8%).