Danville: Fire Incidents, Virginia (VA)
Where are fire incidents reported in Danville, VA
Something went wrong! Please refresh the page.
| Fire incidents reported | |
|---|---|
| Sreet name | Count |
| MAIN ST | 820 |
| RIVERSIDE DR | 426 |
| PINEY FOREST RD | 330 |
| SOUTH BOSTON RD | 210 |
| WESTOVER DR | 198 |
| HALIFAX RD | 120 |
| MARTINSVILLE HWY | 114 |
| MEMORIAL DR | 112 |
| FRANKLIN TPKE | 100 |
| ARNETT BLVD | 90 |
| RICHMOND BLVD | 90 |
| MT CROSS RD | 82 |
| OLD RICHMOND RD | 80 |
| CHATELAINE AVE | 78 |
| STOKES ST | 66 |
| PIEDMONT DR | 64 |
| CENTRAL BLVD | 60 |
| CLAIBORNE ST | 58 |
| MOUNT CROSS RD | 58 |
| KEMPER RD | 56 |
| GOODYEAR BLVD | 54 |
| PAXTON ST | 52 |
| PARKER RD | 50 |
| THIRD AVE | 50 |
| WASHINGTON ST | 50 |
| AIRPORT DR | 48 |
| CROWN DR | 48 |
| NORTH HILLS CT | 48 |
| FERRY RD | 46 |
| INDUSTRIAL AVE | 46 |
| Other | 2,476 |
2002 - 2018 National Fire Incident Reporting System (NFIRS) incidents
- Incident types reported to NFIRS in Danville, VA
- 25,70453.9%Rescue & EMS
- 7,79816.3%Hazardous Condition
- 6,18012.9%Fire
- 2,7945.9%False Alarm
- 2,5385.3%Service Call
- 2,4495.1%Good Intent Call
- 1380.3%Severe Weather
- 1040.2%Overpressure Rupture
- Fire incident types reported to NFIRS in Danville, VA
- 2,71143.9%Outside Fires
- 2,43839.4%Structure Fires
- 86914.1%Mobile Property/Vehicle Fires
- 1622.6%Other
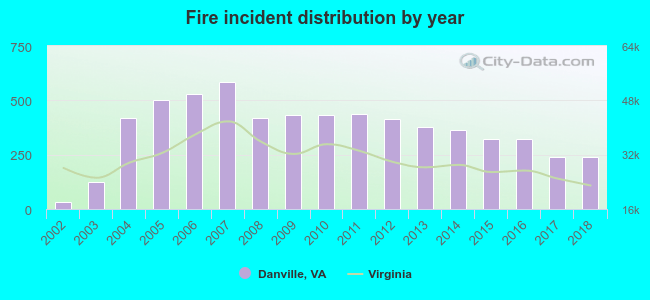 According to the data from the years 2002 - 2018 the average number of fires per year is 364. The highest number of fires - 584 took place in 2007, and the least - 31 in 2002. The data has an increasing trend.
The average number of yearly fire incidents per 10k residents in Danville, VA compared to nearest cities:
(Note: Based on data for the last 3 years, including only cities with population 5,000 and above)
| Danville: | 62.9 |
| Martinsville: | 134.4 |
| South Boston: | 121.9 |
| Collinsville: | 35.0 |
 The median response time based on all reported fire incidents is 5 minutes. This is lower compared to the state median value.
The median response time in Danville, VA compared to nearest cities:
(Note: Based on data for all years, including only cities with at least 500 fire incidents)
| Danville: | 5 minutes |
| Blairs: | 10 minutes |
| Chatham: | 12 minutes |
| Eden: | 4 minutes |
| Reidsville: | 5 minutes |
| Ridgeway: | 8 minutes |
| Gretna: | 12 minutes |
| Martinsville: | 7 minutes |
| Roxboro: | 8 minutes |
 According to the data from the years 2002 - 2018 the average number of fire-related fatalities per year is 1. The highest number of deaths - 5 took place in 2008, and the lowest - 0 in 2002. The data has a rising trend.
The average number of deaths per 1,000 fires is 3. This indicator was the highest - 12 in 2008, and the lowest 0 in 2002. The trend for deaths per 1,000 fires is rising. Compared to the Virginia value the number of fatalities per 1,000 fires is higher.
According to the data from the years 2002 - 2018 the average number of fire-related fatalities per year is 1. The highest number of deaths - 5 took place in 2008, and the lowest - 0 in 2002. The data has a rising trend.
The average number of deaths per 1,000 fires is 3. This indicator was the highest - 12 in 2008, and the lowest 0 in 2002. The trend for deaths per 1,000 fires is rising. Compared to the Virginia value the number of fatalities per 1,000 fires is higher.Deaths per 1,000 incidents in Danville, VA compared to nearest cities:
(Note: Based on data for all years, including only cities with at least 2,500 fire incidents)
| Danville: | 3.7 |
| Reidsville: | 2.9 |
| Martinsville: | 6.6 |
| Burlington: | 2.0 |
| Greensboro: | 1.9 |
 According to the data from the years 2002 - 2018 the average number of fire-related casualties per year is 8. The highest number of injuries - 17 took place in 2008, and the lowest - 0 in 2002. The data has a growing trend.
The average number of casualties per 1,000 fire incidents is 20. This indicator was the highest - 41 in 2008, and the lowest 0 in 2002. The trend for injuries per 1,000 fires is rising. Compared to the Virginia value the number of injuries per 1,000 fires is higher.
According to the data from the years 2002 - 2018 the average number of fire-related casualties per year is 8. The highest number of injuries - 17 took place in 2008, and the lowest - 0 in 2002. The data has a growing trend.
The average number of casualties per 1,000 fire incidents is 20. This indicator was the highest - 41 in 2008, and the lowest 0 in 2002. The trend for injuries per 1,000 fires is rising. Compared to the Virginia value the number of injuries per 1,000 fires is higher.Casualties per 1,000 incidents in Danville, VA compared to nearest cities:
(Note: Based on data for all years, including only cities with at least 500 fire incidents)
| Danville: | 21.7 |
| Blairs: | 0.0 |
| Chatham: | 10.4 |
| Eden: | 7.5 |
| Reidsville: | 13.9 |
| Ridgeway: | 2.2 |
| Gretna: | 0.0 |
| Martinsville: | 13.2 |
| Roxboro: | 1.2 |
 27.9% incidents where reported in the morning and 72.1% in the evening. The most fires (15.3%) took place on Saturday, and the least (13.4%) on Sunday.
 According to the 6,180 fire incident reports from years 2002 - 2018 most fires (11.1%) took place during March, and the least (6.4%) in October.
 Out of all 47,726 cases reported during the years 2002 - 2018, the most belonged to the categories: Rescue & EMS (53.9%), Hazardous Condition (16.3%), and Fire (12.9%).
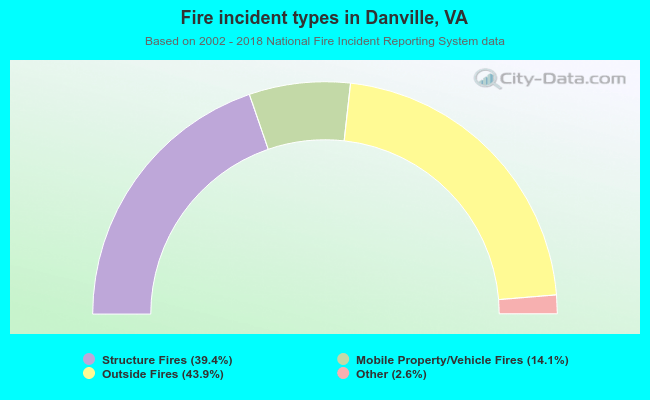 When looking into fire subcategories, the most reports belonged to: Outside Fires (43.9%), and Structure Fires (39.4%).