Eden: Fire Incidents, North Carolina (NC)
Where are fire incidents reported in Eden, NC
Something went wrong! Please refresh the page.
| Fire incidents reported | |
|---|---|
| Sreet name | Count |
| VAN BUREN RD | 122 |
| MEADOW RD | 100 |
| KINGS HWY | 86 |
| STADIUM DR | 76 |
| GANT RD | 68 |
| BRIDGE ST | 62 |
| FIELDCREST RD | 60 |
| NC 770 HWY | 58 |
| FRIENDLY RD | 52 |
| NC 700 HWY | 50 |
| NC 87 HWY | 40 |
| WASHINGTON ST | 40 |
| PRICE RD | 38 |
| KLYCE ST | 36 |
| MORGAN RD | 36 |
| BOONE RD | 34 |
| DISHMON LOOP | 34 |
| HARRIS ST | 34 |
| RIVERSIDE DR | 34 |
| MARTINWOOD RD | 32 |
| LINCOLN ST | 30 |
| CHURCH ST | 28 |
| PIERCE ST | 28 |
| VIRGINIA ST | 28 |
| ARBOR LN | 26 |
| BRYANT ST | 26 |
| GARRETT RD | 26 |
| GREENWOOD ST | 26 |
| NC 14 HWY | 26 |
| FISHER HILL RD | 24 |
| Other | 633 |
2003 - 2018 National Fire Incident Reporting System (NFIRS) incidents
- Incident types reported to NFIRS in Eden, NC
- 1,99329.0%Fire
- 1,73325.2%Hazardous Condition
- 1,08015.7%Rescue & EMS
- 77211.2%Service Call
- 6609.6%False Alarm
- 6038.8%Good Intent Call
- 250.4%Severe Weather
- 90.1%Overpressure Rupture
- 70.1%Special Incident
- Fire incident types reported to NFIRS in Eden, NC
- 99049.7%Structure Fires
- 66133.2%Outside Fires
- 23611.8%Mobile Property/Vehicle Fires
- 1065.3%Other
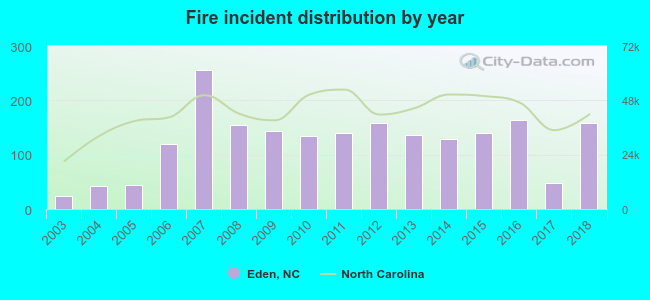 Based on the data from the years 2003 - 2018 the average number of fire incidents per year is 124. The highest number of reported fire incidents - 255 took place in 2007, and the least - 24 in 2003. The data has a growing trend.
The average number of yearly fire incidents per 10k residents in Eden, NC compared to nearest cities:
(Note: Based on data for the last 3 years, including only cities with population 5,000 and above)
| Eden: | 80.3 |
| Reidsville: | 108.2 |
| Summerfield: | 41.2 |
| Stokesdale: | 65.5 |
| Oak Ridge: | 30.8 |
| Greensboro: | 33.0 |
| Gibsonville: | 135.9 |
| Elon: | 49.2 |
| Kernersville: | 86.2 |
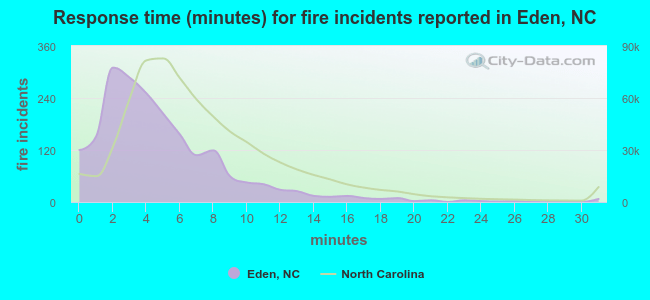 The median response time based on all reported fire incidents is 4 minutes. This is lower compared to the state median value.
The median response time in Eden, NC compared to nearest cities:
(Note: Based on data for all years, including only cities with at least 500 fire incidents)
| Eden: | 4 minutes |
| Stoneville: | 7 minutes |
| Reidsville: | 5 minutes |
| Madison: | 7 minutes |
| Summerfield: | 6 minutes |
| Stokesdale: | 7 minutes |
| Walnut Cove: | 9 minutes |
| McLeansville: | 6 minutes |
| Greensboro: | 4 minutes |
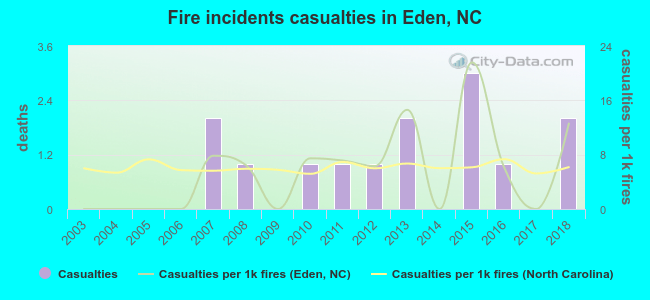 According to the data from the years 2003 - 2018 the average number of fire-related yearly casualties is 1. The highest number of injuries - 3 took place in 2015, and the lowest - 0 in 2003. The data has a growing trend.
The average number of injuries per 1,000 fire incidents is 6. This indicator was the highest - 22 in 2015, and the lowest 0 in 2003. The trend for injuries per 1,000 fire incidents is increasing. Compared to the North Carolina value the number of casualties per 1,000 incidents is higher.
According to the data from the years 2003 - 2018 the average number of fire-related yearly casualties is 1. The highest number of injuries - 3 took place in 2015, and the lowest - 0 in 2003. The data has a growing trend.
The average number of injuries per 1,000 fire incidents is 6. This indicator was the highest - 22 in 2015, and the lowest 0 in 2003. The trend for injuries per 1,000 fire incidents is increasing. Compared to the North Carolina value the number of casualties per 1,000 incidents is higher.Casualties per 1,000 incidents in Eden, NC compared to nearest cities:
(Note: Based on data for all years, including only cities with at least 500 fire incidents)
| Eden: | 7.5 |
| Stoneville: | 0.0 |
| Reidsville: | 13.9 |
| Madison: | 4.7 |
| Summerfield: | 7.3 |
| Stokesdale: | 5.8 |
| Walnut Cove: | 1.9 |
| McLeansville: | 2.3 |
| Greensboro: | 12.2 |
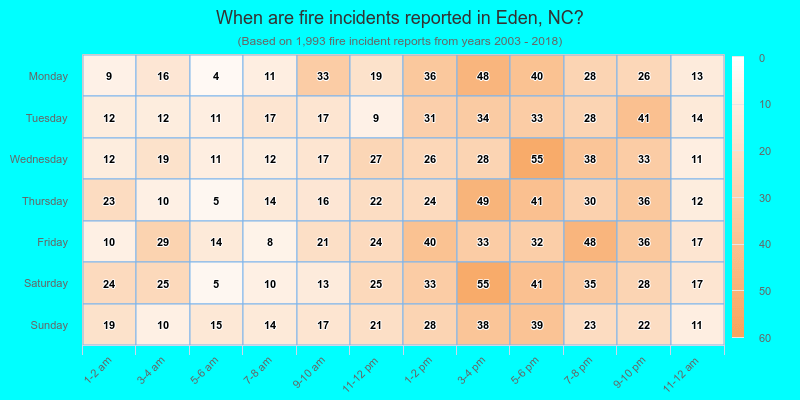
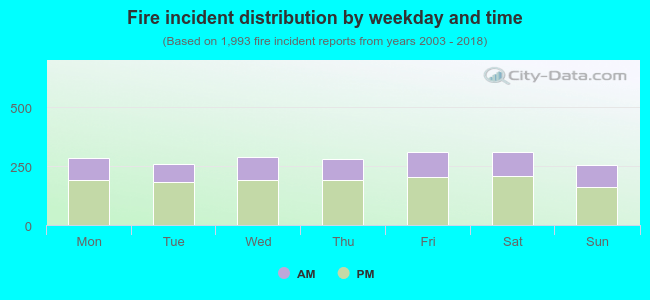 33.2% incidents where reported in the morning and 66.8% in the evening. The most fires (15.7%) took place on Friday, and the least (12.9%) on Sunday.
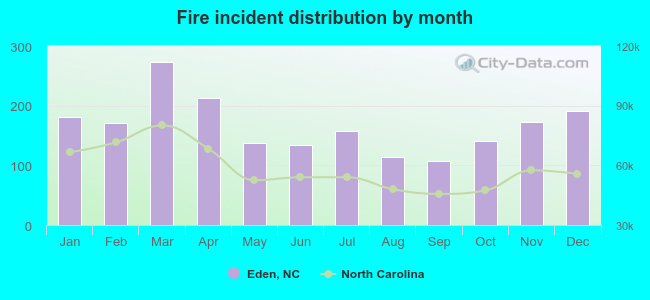 According to the 1,993 fire incident reports from years 2003 - 2018 most fires (13.7%) took place during March, and the least (5.4%) in September.
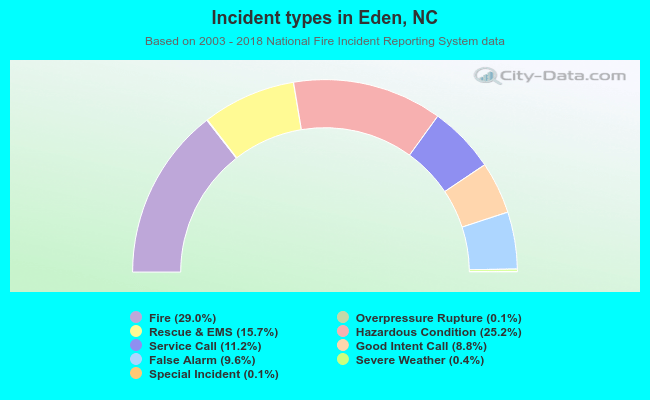 Out of all 6,882 cases reported during the years 2003 - 2018, the most belonged to the categories: Fire (29.0%), Hazardous Condition (25.2%), and Rescue & EMS (15.7%).
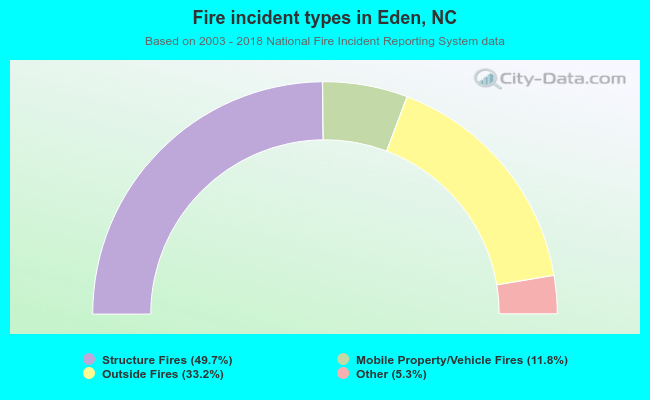 When looking into fire subcategories, the most incidents belonged to: Structure Fires (49.7%), and Outside Fires (33.2%).