Kernersville: Fire Incidents, North Carolina (NC)
Where are fire incidents reported in Kernersville, NC
Something went wrong! Please refresh the page.
| Fire incidents reported | |
|---|---|
| Sreet name | Count |
| MAIN ST | 428 |
| MOUNTAIN ST | 334 |
| PINEY GROVE RD | 260 |
| WEST MOUNTAIN ST | 158 |
| UNION CROSS RD | 148 |
| BODENHAMER ST | 96 |
| HWY 66 | 92 |
| HIGH POINT RD | 90 |
| HIGHWAY 66 | 84 |
| HASTINGS HILL RD | 80 |
| FARMWOOD DR | 78 |
| HOPKINS RD | 76 |
| OLD HOLLOW RD | 76 |
| KERNER RD | 74 |
| OLD VALLEY SCHOOL RD | 72 |
| JOHNSON CONTROLS DR | 64 |
| OLD SALEM RD | 62 |
| SEDGE GARDEN RD | 62 |
| ARBOR HILL RD | 58 |
| VANCE RD | 58 |
| BUSINESS 40 | 54 |
| DRUMMOND ST | 54 |
| INDUSTRIAL PARK DR | 54 |
| PINEVIEW DR | 50 |
| REIDSVILLE RD | 50 |
| ABBOTTS CREEK CHURCH RD | 48 |
| CHERRY ST | 48 |
| KERNERSVILLE RD | 48 |
| NELSON ST | 48 |
| PISGAH CHURCH RD | 48 |
| Other | 1,606 |
2002 - 2018 National Fire Incident Reporting System (NFIRS) incidents
- Incident types reported to NFIRS in Kernersville, NC
- 12,93846.1%Rescue & EMS
- 4,55816.3%Fire
- 3,07411.0%Good Intent Call
- 2,96710.6%Hazardous Condition
- 2,4758.8%Service Call
- 1,9236.9%False Alarm
- 600.2%Severe Weather
- Fire incident types reported to NFIRS in Kernersville, NC
- 1,91642.0%Structure Fires
- 1,31628.9%Outside Fires
- 71115.6%Other
- 61513.5%Mobile Property/Vehicle Fires
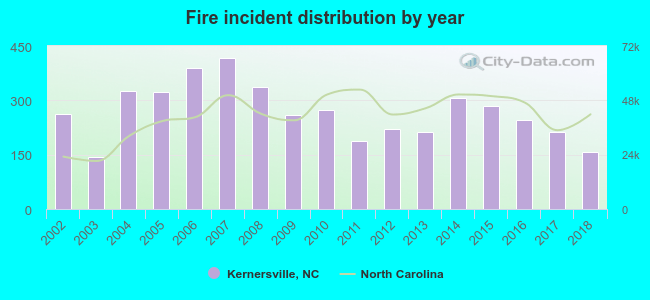 According to the data from the years 2002 - 2018 the average number of fire incidents per year is 268. The highest number of reported fire incidents - 417 took place in 2007, and the least - 144 in 2003. The data has a declining trend.
The average number of yearly fire incidents per 10k residents in Kernersville, NC compared to nearest cities:
(Note: Based on data for the last 3 years, including only cities with population 5,000 and above)
| Kernersville: | 86.2 |
| Oak Ridge: | 30.8 |
| Stokesdale: | 65.5 |
| High Point: | 21.2 |
| Summerfield: | 41.2 |
| Greensboro: | 33.0 |
| Thomasville: | 78.8 |
| Archdale: | 54.0 |
| Trinity: | 78.1 |
 The median response time based on all reported fire incidents is 5 minutes. This is lower compared to the state median value.
The median response time in Kernersville, NC compared to nearest cities:
(Note: Based on data for all years, including only cities with at least 500 fire incidents)
| Kernersville: | 5 minutes |
| Hampstead: | 8 minutes |
| Walkertown: | 7 minutes |
| Stokesdale: | 7 minutes |
| Winston-Salem: | 4 minutes |
| High Point: | 4 minutes |
| Jamestown: | 5 minutes |
| Summerfield: | 6 minutes |
| Walnut Cove: | 9 minutes |
 Based on the data from the years 2002 - 2018 the average number of fire-related fatalities per year is 0. The highest number of deaths - 3 took place in 2015, and the lowest - 0 in 2002. The data has a constant trend.
The average number of fatalities per 1,000 fire incidents is 1. This indicator was the highest - 11 in 2015, and the lowest 0 in 2002. The trend for fatalities per 1,000 fire incidents is constant. Compared to the North Carolina value the number of deaths per 1,000 fire incidents is lower.
Based on the data from the years 2002 - 2018 the average number of fire-related fatalities per year is 0. The highest number of deaths - 3 took place in 2015, and the lowest - 0 in 2002. The data has a constant trend.
The average number of fatalities per 1,000 fire incidents is 1. This indicator was the highest - 11 in 2015, and the lowest 0 in 2002. The trend for fatalities per 1,000 fire incidents is constant. Compared to the North Carolina value the number of deaths per 1,000 fire incidents is lower.Deaths per 1,000 incidents in Kernersville, NC compared to nearest cities:
(Note: Based on data for all years, including only cities with at least 2,500 fire incidents)
| Kernersville: | 1.1 |
| Winston-Salem: | 2.1 |
| High Point: | 1.2 |
| Greensboro: | 1.9 |
| Thomasville: | 2.5 |
| Lexington: | 0.0 |
| Reidsville: | 2.9 |
| Mocksville: | 1.7 |
| Asheboro: | 0.3 |
 Based on the reports from the years 2002 - 2018 the average number of fire-related yearly casualties is 4. The highest number of reported injuries - 8 took place in 2013, and the lowest - 0 in 2003. The data has a decreasing trend.
The average number of casualties per 1,000 fire incidents is 14. This indicator was the highest - 38 in 2013, and the lowest 0 in 2003. The trend for casualties per 1,000 fire incidents is declining. Compared to the state value the number of casualties per 1,000 fires is much higher.
Based on the reports from the years 2002 - 2018 the average number of fire-related yearly casualties is 4. The highest number of reported injuries - 8 took place in 2013, and the lowest - 0 in 2003. The data has a decreasing trend.
The average number of casualties per 1,000 fire incidents is 14. This indicator was the highest - 38 in 2013, and the lowest 0 in 2003. The trend for casualties per 1,000 fire incidents is declining. Compared to the state value the number of casualties per 1,000 fires is much higher.Casualties per 1,000 incidents in Kernersville, NC compared to nearest cities:
(Note: Based on data for all years, including only cities with at least 500 fire incidents)
| Kernersville: | 13.6 |
| Hampstead: | 6.4 |
| Walkertown: | 5.9 |
| Stokesdale: | 5.8 |
| Winston-Salem: | 14.9 |
| High Point: | 14.9 |
| Jamestown: | 15.7 |
| Summerfield: | 7.3 |
| Walnut Cove: | 1.9 |
 31.0% incidents where reported in the morning and 69.0% in the evening. The most fires (15.7%) took place on Tuesday, and the least (13.1%) on Wednesday.
 Based on the 4,558 fire incident reports from years 2002 - 2018 most fires (11.7%) took place during March, and the least (6.3%) in September.
 Out of all 28,040 cases reported during the years 2002 - 2018, the most belonged to the categories: Rescue & EMS (46.1%), Fire (16.3%), and Good Intent Call (11.0%).
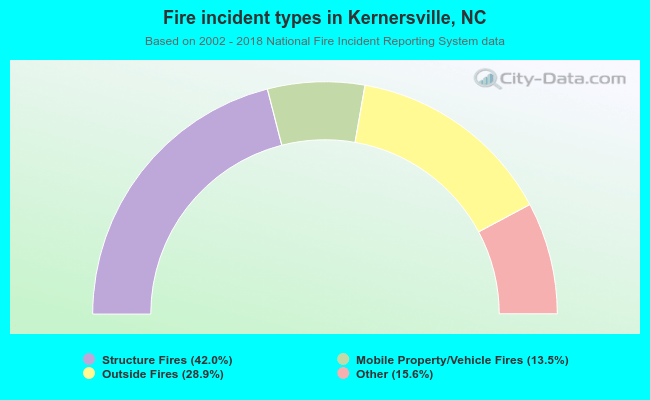 When looking into fire subcategories, the most incidents belonged to: Structure Fires (42.0%), and Outside Fires (28.9%).