Thomasville: Fire Incidents, North Carolina (NC)
Where are fire incidents reported in Thomasville, NC
Something went wrong! Please refresh the page.
| Fire incidents reported | |
|---|---|
| Sreet name | Count |
| RANDOLPH ST | 180 |
| NATIONAL HWY | 134 |
| I 85 HWY | 124 |
| KENNEDY RD | 106 |
| LIBERTY DR | 94 |
| JOHNSONTOWN RD | 80 |
| FISHER FERRY ST | 78 |
| MAIN ST | 76 |
| DENTON RD | 74 |
| I 85 | 72 |
| UNITY ST | 64 |
| FULLER MILL RD | 62 |
| HOLLY GROVE RD | 62 |
| HOLLY HILL RD | 62 |
| BLAIR ST | 58 |
| HASTY SCHOOL RD | 58 |
| UPPER LAKE RD | 56 |
| KANOY RD | 48 |
| HASTY HILL RD | 42 |
| MARTIN LUTHER KING DR | 42 |
| MIDWAY SCHOOL RD | 40 |
| LIGHT RD | 38 |
| LOWER LAKE RD | 38 |
| WRIGHT RD | 36 |
| CALVIN RD | 34 |
| CLONIGER DR | 34 |
| MENDENHALL ST | 34 |
| OLD GREENSBORO RD | 34 |
| REDDY FOXX LN | 34 |
| 2970 HWY | 32 |
| Other | 1,689 |
2002 - 2018 National Fire Incident Reporting System (NFIRS) incidents
- Incident types reported to NFIRS in Thomasville, NC
- 4,83028.4%Rescue & EMS
- 3,61521.3%Fire
- 3,51920.7%Hazardous Condition
- 1,6459.7%Good Intent Call
- 1,5168.9%False Alarm
- 1,2867.6%Service Call
- 5083.0%Severe Weather
- 520.3%Special Incident
- 360.2%Overpressure Rupture
- Fire incident types reported to NFIRS in Thomasville, NC
- 1,54942.8%Structure Fires
- 1,36137.6%Outside Fires
- 53114.7%Mobile Property/Vehicle Fires
- 1744.8%Other
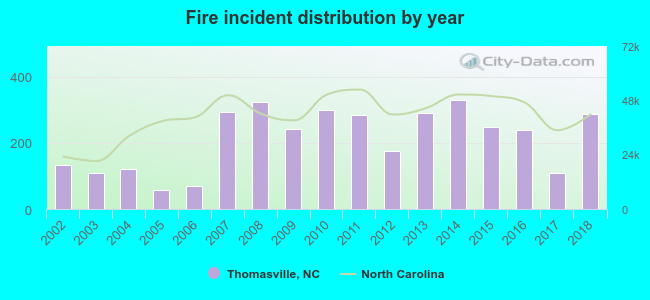 According to the data from the years 2002 - 2018 the average number of fires per year is 213. The highest number of reported fires - 329 took place in 2014, and the least - 59 in 2005. The data has a growing trend.
The average number of yearly fire incidents per 10k residents in Thomasville, NC compared to nearest cities:
(Note: Based on data for the last 3 years, including only cities with population 5,000 and above)
| Thomasville: | 78.8 |
| Trinity: | 78.1 |
| Archdale: | 54.0 |
| High Point: | 21.2 |
| Lexington: | 172.1 |
| Kernersville: | 86.2 |
| Asheboro: | 63.9 |
| Greensboro: | 33.0 |
| Clemmons: | 41.7 |
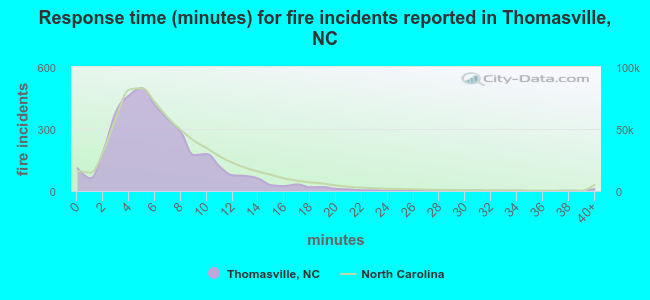 The median response time based on all reported fire incidents is 6 minutes. This is comparable to the North Carolina median value.
The median response time in Thomasville, NC compared to nearest cities:
(Note: Based on data for all years, including only cities with at least 500 fire incidents)
| Thomasville: | 6 minutes |
| Trinity: | 6 minutes |
| Archdale: | 5 minutes |
| High Point: | 4 minutes |
| Jamestown: | 5 minutes |
| Lexington: | 7 minutes |
| Kernersville: | 5 minutes |
| Randleman: | 6 minutes |
| Denton: | 8 minutes |
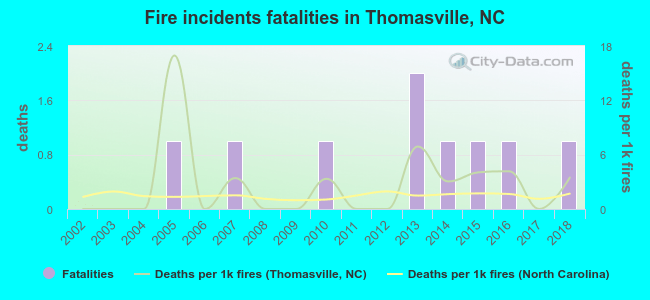 According to the data from the years 2002 - 2018 the average number of fire-related yearly deaths is 1. The highest number of deaths - 2 took place in 2013, and the lowest - 0 in 2002. The data has an increasing trend.
The average number of fatalities per 1,000 fire incidents is 3. This indicator was the highest - 17 in 2005, and the lowest 0 in 2002. The trend for deaths per 1,000 fires is rising. Compared to the North Carolina value the number of fatalities per 1,000 incidents is higher.
According to the data from the years 2002 - 2018 the average number of fire-related yearly deaths is 1. The highest number of deaths - 2 took place in 2013, and the lowest - 0 in 2002. The data has an increasing trend.
The average number of fatalities per 1,000 fire incidents is 3. This indicator was the highest - 17 in 2005, and the lowest 0 in 2002. The trend for deaths per 1,000 fires is rising. Compared to the North Carolina value the number of fatalities per 1,000 incidents is higher.Deaths per 1,000 incidents in Thomasville, NC compared to nearest cities:
(Note: Based on data for all years, including only cities with at least 2,500 fire incidents)
| Thomasville: | 2.5 |
| High Point: | 1.2 |
| Lexington: | 0.0 |
| Kernersville: | 1.1 |
| Winston-Salem: | 2.1 |
| Asheboro: | 0.3 |
| Greensboro: | 1.9 |
| Salisbury: | 1.8 |
| Mocksville: | 1.7 |
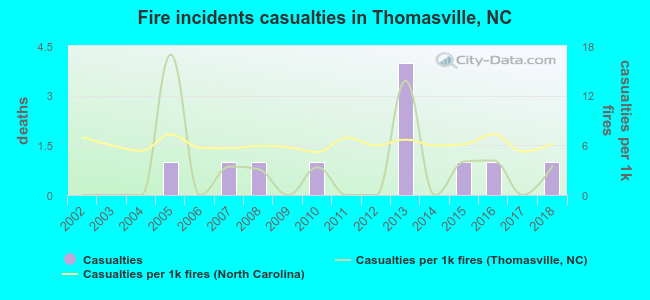 According to the data from the years 2002 - 2018 the average number of fire-related yearly casualties is 1. The highest number of reported casualties - 4 took place in 2013, and the lowest - 0 in 2002. The data has a rising trend.
The average number of injuries per 1,000 fires is 3. This indicator was the highest - 17 in 2005, and the lowest 0 in 2002. The trend for injuries per 1,000 incidents is rising. Compared to the North Carolina value the number of injuries per 1,000 incidents is much lower.
According to the data from the years 2002 - 2018 the average number of fire-related yearly casualties is 1. The highest number of reported casualties - 4 took place in 2013, and the lowest - 0 in 2002. The data has a rising trend.
The average number of injuries per 1,000 fires is 3. This indicator was the highest - 17 in 2005, and the lowest 0 in 2002. The trend for injuries per 1,000 incidents is rising. Compared to the North Carolina value the number of injuries per 1,000 incidents is much lower.Casualties per 1,000 incidents in Thomasville, NC compared to nearest cities:
(Note: Based on data for all years, including only cities with at least 500 fire incidents)
| Thomasville: | 3.0 |
| Trinity: | 9.5 |
| Archdale: | 10.1 |
| High Point: | 14.9 |
| Jamestown: | 15.7 |
| Lexington: | 2.5 |
| Kernersville: | 13.6 |
| Randleman: | 2.4 |
| Denton: | 0.0 |
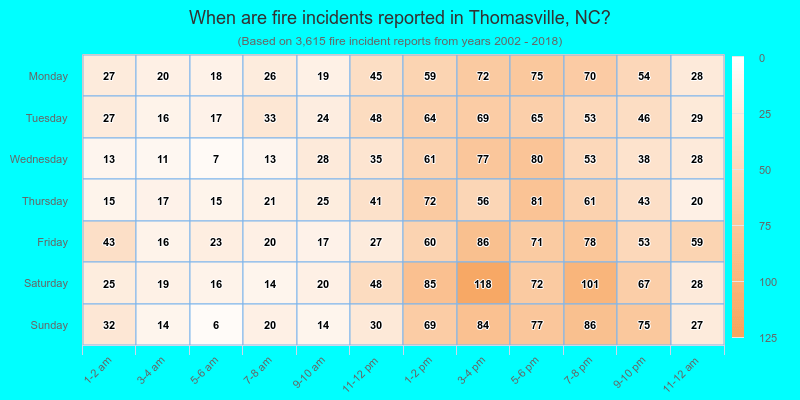
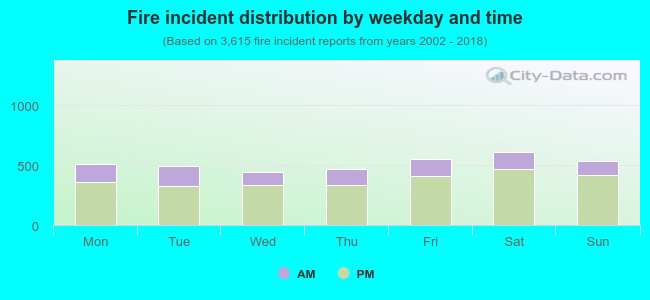 26.7% incidents where reported in the morning and 73.3% in the evening. The most fires (17.0%) took place on Saturday, and the least (12.3%) on Wednesday.
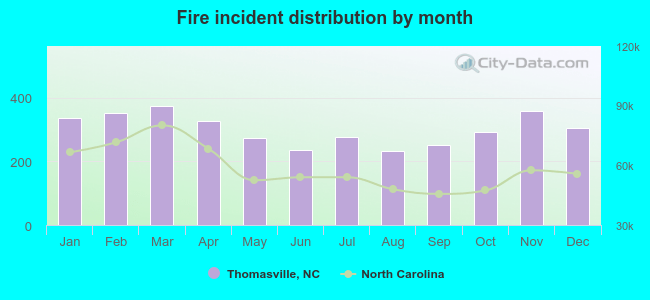 According to the 3,615 fires from years 2002 - 2018 most fires (10.4%) took place during March, and the least (6.4%) in August.
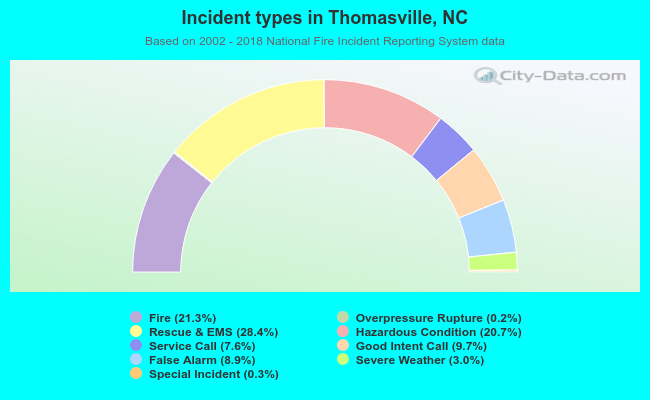 Out of all 17,007 cases reported during the years 2002 - 2018, the most belonged to the categories: Rescue & EMS (28.4%), Fire (21.3%), and Hazardous Condition (20.7%).
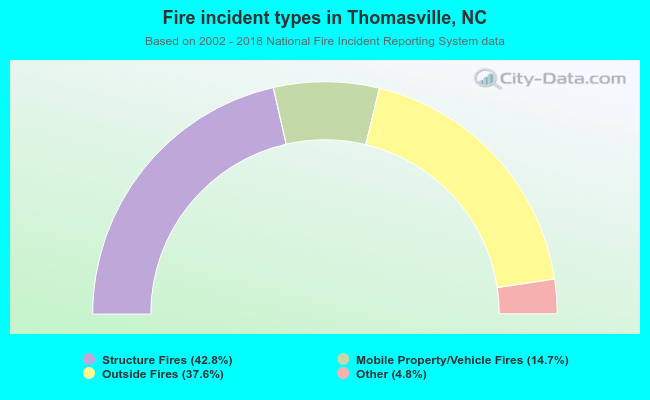 When looking into fire subcategories, the most reports belonged to: Structure Fires (42.8%), and Outside Fires (37.6%).