Lynchburg: Fire Incidents, Virginia (VA)
Where are fire incidents reported in Lynchburg, VA
Something went wrong! Please refresh the page.
| Fire incidents reported | |
|---|---|
| Sreet name | Count |
| WARDS RD | 370 |
| CANDLERS MOUNTAIN RD | 252 |
| LAKESIDE DR | 200 |
| RIVERMONT AVE | 194 |
| TIMBERLAKE RD | 194 |
| CAMPBELL AVE | 186 |
| FORT AVE | 166 |
| OLD FOREST RD | 154 |
| MEMORIAL AVE | 138 |
| FEDERAL ST | 136 |
| LANGHORNE RD | 108 |
| LEESVILLE RD | 100 |
| PARK AVE | 98 |
| GREENFIELD DR | 94 |
| BOONSBORO RD | 90 |
| HOLLINS ST | 86 |
| GRACE ST | 84 |
| FLORIDA AVE | 80 |
| MAIN ST | 76 |
| TAYLOR ST | 76 |
| 12TH ST | 68 |
| ENTERPRISE DR | 62 |
| GRAVES MILL RD | 62 |
| POLK ST | 60 |
| CHURCH ST | 58 |
| UNIVERSITY BLVD | 58 |
| 29 EXN | 56 |
| FLOYD ST | 56 |
| BEDFORD AVE | 54 |
| CABELL ST | 54 |
| Other | 2,819 |
2002 - 2018 National Fire Incident Reporting System (NFIRS) incidents
- Incident types reported to NFIRS in Lynchburg, VA
- 46,35663.9%Rescue & EMS
- 10,05813.9%Hazardous Condition
- 6,2898.7%Fire
- 4,4686.2%Good Intent Call
- 2,8974.0%False Alarm
- 2,2313.1%Service Call
- 960.1%Special Incident
- 950.1%Severe Weather
- Fire incident types reported to NFIRS in Lynchburg, VA
- 2,51239.9%Outside Fires
- 2,42538.6%Structure Fires
- 1,07917.2%Mobile Property/Vehicle Fires
- 2734.3%Other
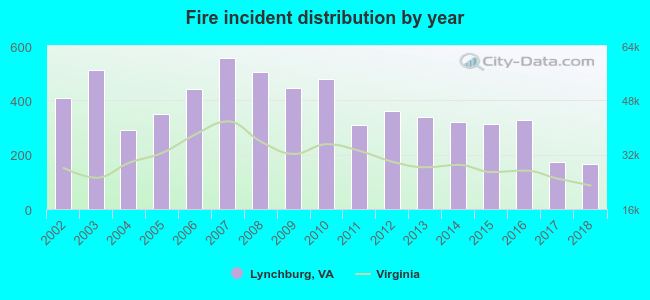 According to the data from the years 2002 - 2018 the average number of fire incidents per year is 370. The highest number of reported fires - 554 took place in 2007, and the least - 166 in 2018. The data has a decreasing trend.
The average number of yearly fire incidents per 10k residents in Lynchburg, VA compared to nearest cities:
(Note: Based on data for the last 3 years, including only cities with population 5,000 and above)
| Lynchburg: | 28.0 |
| Madison Heights: | 66.8 |
| Forest: | 44.3 |
| Timberlake: | 0.8 |
| Bedford: | 163.4 |
| Buena Vista: | 75.7 |
| Lexington: | 145.4 |
| Vinton: | 79.9 |
| Farmville: | 106.5 |
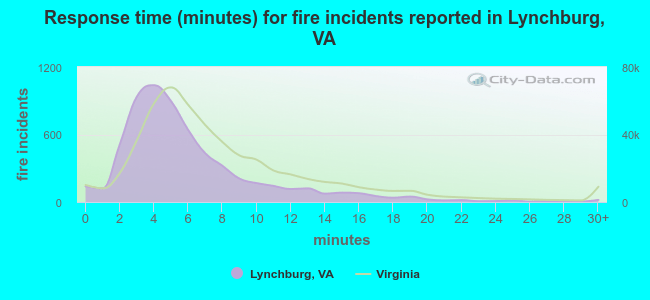 The median response time based on all reported fire incidents is 5 minutes. This is lower than the state median value.
The median response time in Lynchburg, VA compared to nearest cities:
(Note: Based on data for all years, including only cities with at least 500 fire incidents)
| Lynchburg: | 5 minutes |
| Madison Heights: | 12 minutes |
| Forest: | 9 minutes |
| Rustburg: | 10 minutes |
| Amherst: | 15 minutes |
| Appomattox: | 12 minutes |
| Bedford: | 10 minutes |
| Hurt: | 12 minutes |
| Buena Vista: | 10 minutes |
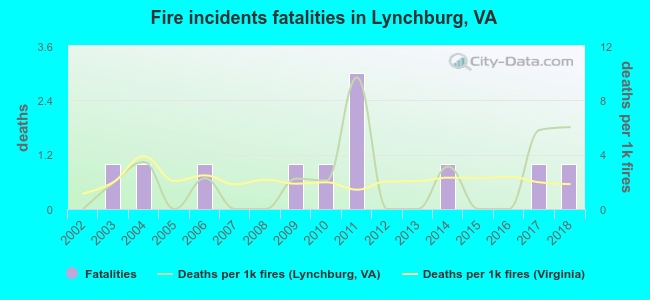 Based on the reports from the years 2002 - 2018 the average number of fire-related yearly deaths is 1. The highest number of reported deaths - 3 took place in 2011, and the lowest - 0 in 2002. The data has a growing trend.
The average number of deaths per 1,000 fires is 2. This indicator was the highest - 10 in 2011, and the lowest 0 in 2002. The trend for fatalities per 1,000 incidents is growing. Compared to the Virginia value the number of fatalities per 1,000 fires is similar.
Based on the reports from the years 2002 - 2018 the average number of fire-related yearly deaths is 1. The highest number of reported deaths - 3 took place in 2011, and the lowest - 0 in 2002. The data has a growing trend.
The average number of deaths per 1,000 fires is 2. This indicator was the highest - 10 in 2011, and the lowest 0 in 2002. The trend for fatalities per 1,000 incidents is growing. Compared to the Virginia value the number of fatalities per 1,000 fires is similar.Deaths per 1,000 incidents in Lynchburg, VA compared to nearest cities:
(Note: Based on data for all years, including only cities with at least 2,500 fire incidents)
| Lynchburg: | 1.7 |
| Roanoke: | 3.2 |
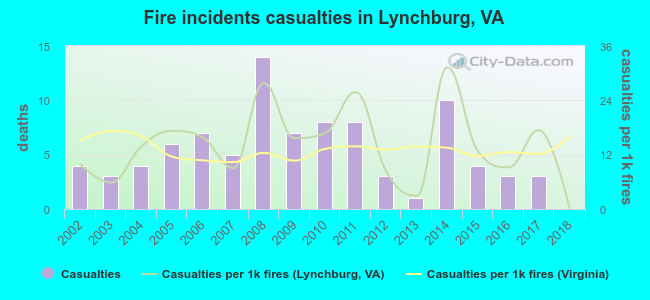 According to the reports from the years 2002 - 2018 the average number of fire-related yearly casualties is 5. The highest number of injuries - 14 took place in 2008, and the lowest - 0 in 2018. The data has a declining trend.
The average number of casualties per 1,000 fire incidents is 14. This indicator was the highest - 31 in 2014, and the lowest 0 in 2018. The trend for injuries per 1,000 fire incidents is declining. Compared to the state value the number of injuries per 1,000 fire incidents is similar.
According to the reports from the years 2002 - 2018 the average number of fire-related yearly casualties is 5. The highest number of injuries - 14 took place in 2008, and the lowest - 0 in 2018. The data has a declining trend.
The average number of casualties per 1,000 fire incidents is 14. This indicator was the highest - 31 in 2014, and the lowest 0 in 2018. The trend for injuries per 1,000 fire incidents is declining. Compared to the state value the number of injuries per 1,000 fire incidents is similar.Casualties per 1,000 incidents in Lynchburg, VA compared to nearest cities:
(Note: Based on data for all years, including only cities with at least 500 fire incidents)
| Lynchburg: | 14.3 |
| Madison Heights: | 10.7 |
| Forest: | 1.1 |
| Rustburg: | 2.3 |
| Amherst: | 0.8 |
| Appomattox: | 0.0 |
| Bedford: | 1.5 |
| Hurt: | 1.7 |
| Buena Vista: | 2.1 |
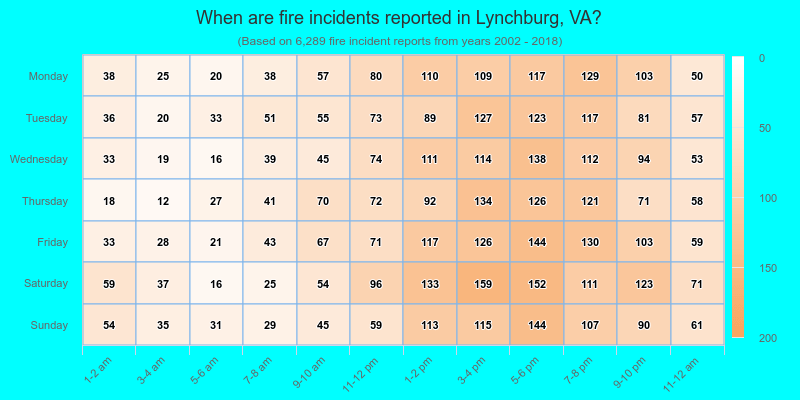
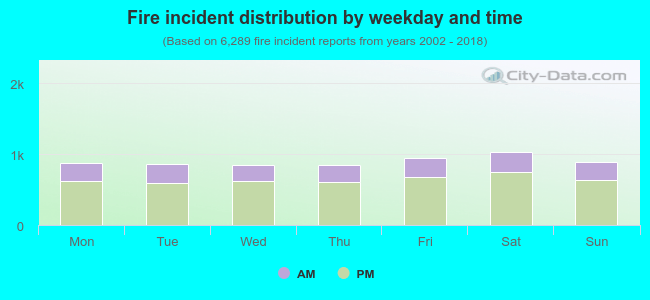 28.5% incidents where reported in the morning and 71.5% in the evening. The most fires (16.5%) took place on Saturday, and the least (13.4%) on Thursday.
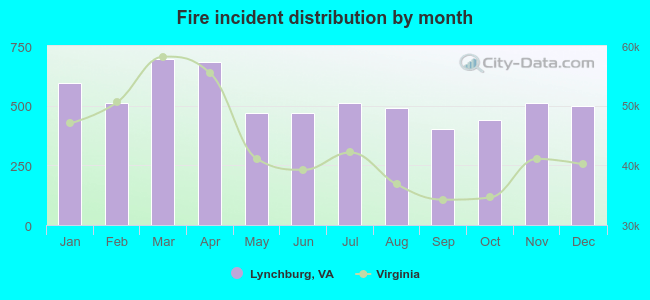 Based on the 6,289 incident reports from years 2002 - 2018 most fires (11.1%) took place during March, and the least (6.4%) in September.
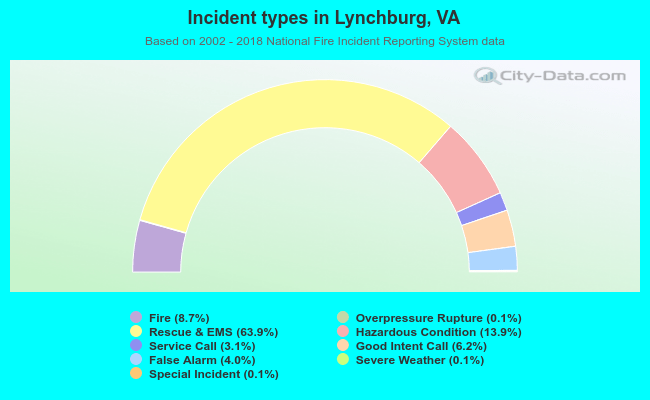 Out of all 72,562 cases reported during the years 2002 - 2018, the most belonged to the categories: Rescue & EMS (63.9%), Hazardous Condition (13.9%), and Fire (8.7%).
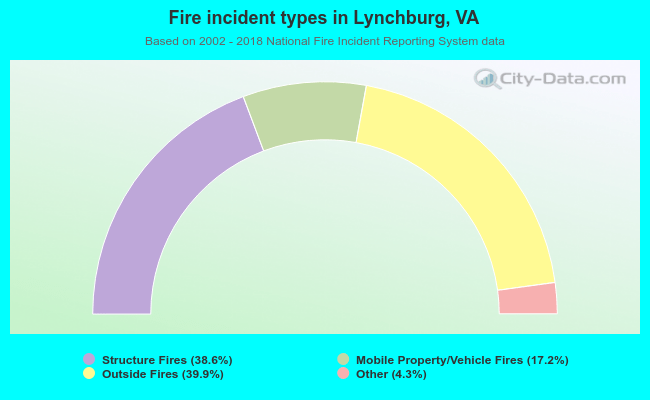 When looking into fire subcategories, the most incidents belonged to: Outside Fires (39.9%), and Structure Fires (38.6%).