Sebastian: Fire Incidents, Florida (FL)
Where are fire incidents reported in Sebastian, FL
Something went wrong! Please refresh the page.
| Fire incidents reported | |
|---|---|
| Sreet name | Count |
| U S HIGHWAY 1 | 150 |
| INDIAN RIVER DR | 66 |
| ROSELAND | 52 |
| U.S. HIGHWAY 1 | 52 |
| BARBER ST | 44 |
| SCHUMANN DR | 38 |
| MAIN ST | 32 |
| SEBASTIAN BLVD | 30 |
| AIRPORT DR | 28 |
| FLEMING ST | 26 |
| JOY HAVEN DR | 24 |
| 129TH ST | 22 |
| COUNTY ROAD 512 | 22 |
| EASY ST | 18 |
| MABRY ST | 18 |
| OLD DIXIE HWY | 18 |
| WIMBROW DR | 16 |
| 58TH AVE | 14 |
| ADMIRAL CIR | 14 |
| GEORGE ST | 14 |
| LAYPORT DR | 14 |
| 126TH ST | 12 |
| 66TH AVE | 12 |
| CROSS CREEK CIR | 12 |
| ENGLAR DR | 12 |
| LOUISIANA AVE | 12 |
| 130TH ST | 10 |
| 70TH AVE | 10 |
| BRIARCLIFF CIR | 10 |
| DAHL AVE | 10 |
| Other | 164 |
2002 - 2018 National Fire Incident Reporting System (NFIRS) incidents
- Incident types reported to NFIRS in Sebastian, FL
- 14,30075.2%Rescue & EMS
- 1,7599.3%Hazardous Condition
- 9765.1%Fire
- 8234.3%Good Intent Call
- 7133.8%False Alarm
- 3992.1%Service Call
- 220.1%Special Incident
- Fire incident types reported to NFIRS in Sebastian, FL
- 63965.5%Outside Fires
- 21221.7%Structure Fires
- 11712.0%Mobile Property/Vehicle Fires
- 80.8%Other
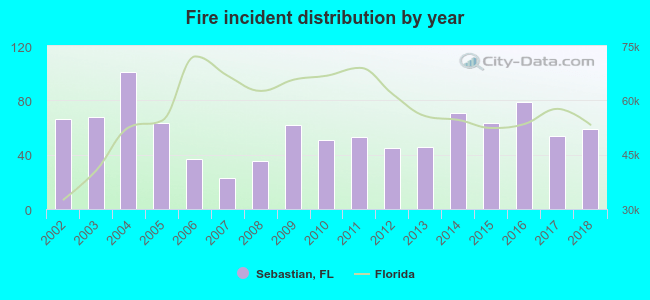 Based on the data from the years 2002 - 2018 the average number of fire incidents per year is 57. The highest number of fires - 101 took place in 2004, and the least - 23 in 2007. The data has a decreasing trend.
The average number of yearly fire incidents per 10k residents in Sebastian, FL compared to nearest cities:
(Note: Based on data for the last 3 years, including only cities with population 5,000 and above)
| Sebastian: | 27.4 |
| Micco: | 28.0 |
| Fellsmere: | 52.7 |
| Vero Beach: | 238.7 |
| Palm Bay: | 33.4 |
| West Melbourne: | 38.0 |
| Melbourne: | 26.1 |
| Fort Pierce: | 123.2 |
| Indian Harbour Beach: | 12.8 |
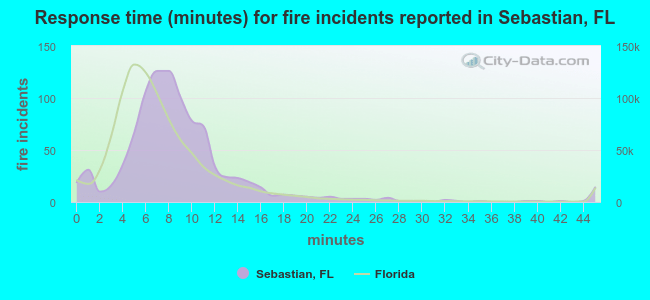 The median response time based on all reported fire incidents is 8 minutes. This is higher than the state median value.
The median response time in Sebastian, FL compared to nearest cities:
(Note: Based on data for all years, including only cities with at least 500 fire incidents)
| Sebastian: | 8 minutes |
| Fellsmere: | 8 minutes |
| Vero Beach: | 8 minutes |
| Malabar: | 6 minutes |
| Palm Bay: | 7 minutes |
| West Melbourne: | 7 minutes |
| Melbourne: | 5 minutes |
| Fort Pierce: | 9 minutes |
| Satellite Beach: | 5 minutes |
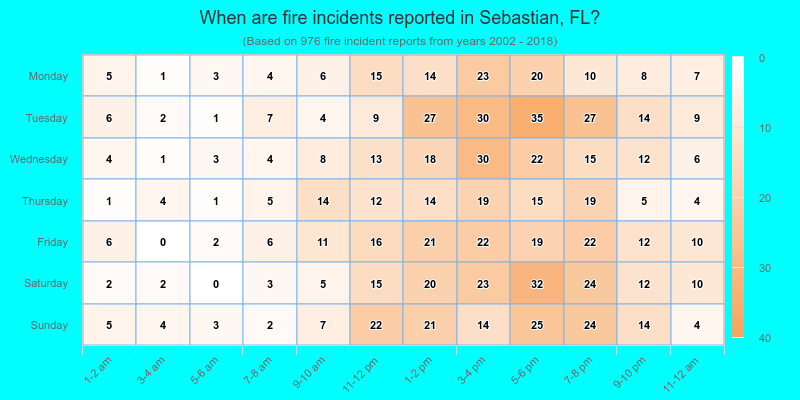
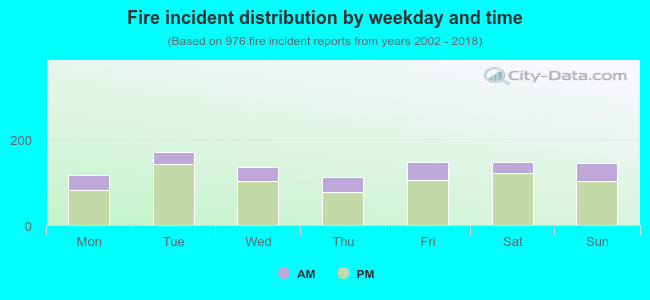 25.0% incidents where reported in the morning and 75.0% in the evening. The most fires (17.5%) took place on Tuesday, and the least (11.6%) on Thursday.
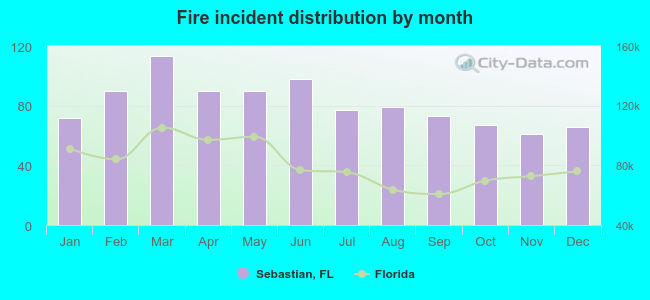 Based on the 976 fires from years 2002 - 2018 most fires (11.6%) took place during March, and the least (6.3%) in November.
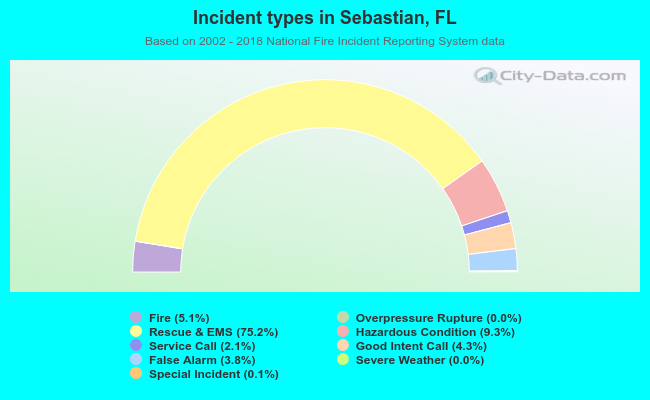 Out of all 19,006 cases reported during the years 2002 - 2018, the most belonged to the categories: Rescue & EMS (75.2%), Hazardous Condition (9.3%), and Fire (5.1%).
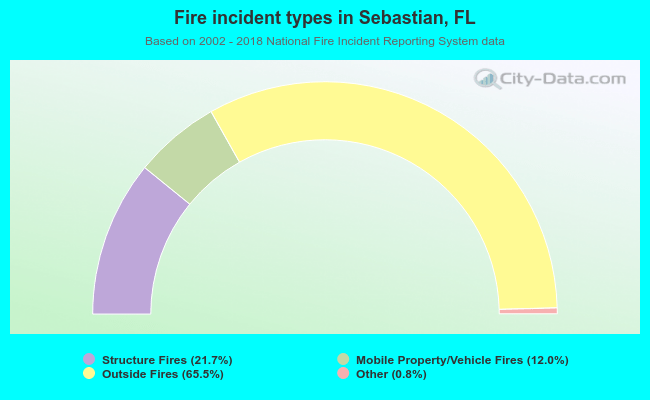 When looking into fire subcategories, the most reports belonged to: Outside Fires (65.5%), and Structure Fires (21.7%).