Melbourne: Fire Incidents, Florida (FL)
Where are fire incidents reported in Melbourne, FL
Something went wrong! Please refresh the page.
| Fire incidents reported | |
|---|---|
| Sreet name | Count |
| WICKHAM RD | 362 |
| BABCOCK ST | 128 |
| HARBOR CITY BL | 128 |
| SARNO RD | 128 |
| EAU GALLIE BL | 94 |
| PARKWAY DR | 94 |
| NEW HAVEN AV | 86 |
| UNIVERSITY BL | 78 |
| WICKHAM | 72 |
| PALM BAY RD | 52 |
| POST RD | 46 |
| US 1 | 44 |
| AURORA RD | 42 |
| HIBISCUS BL | 42 |
| EAU GALLIE BL | 40 |
| HICKORY ST | 40 |
| I 95 | 40 |
| DAIRY RD | 38 |
| PINEAPPLE AV | 38 |
| STRAWBRIDGE AV | 38 |
| AUDUBON DR | 32 |
| BRIDGEWATER DR | 32 |
| MAGNOLIA AV | 30 |
| WICKHAM RD MEL | 30 |
| CROTON RD | 28 |
| EAU GALLIE BLVD | 26 |
| JONES RD | 26 |
| NEW HAVEN AVE | 26 |
| LIPSCOMB ST | 24 |
| STEWART RD | 24 |
| Other | 1,496 |
2004 - 2018 National Fire Incident Reporting System (NFIRS) incidents
- Incident types reported to NFIRS in Melbourne, FL
- 100,34483.6%Rescue & EMS
- 5,8544.9%Good Intent Call
- 4,5013.7%Service Call
- 3,4042.8%Fire
- 2,9032.4%False Alarm
- 2,8952.4%Hazardous Condition
- Fire incident types reported to NFIRS in Melbourne, FL
- 1,67649.2%Outside Fires
- 1,02230.0%Structure Fires
- 61318.0%Mobile Property/Vehicle Fires
- 932.7%Other
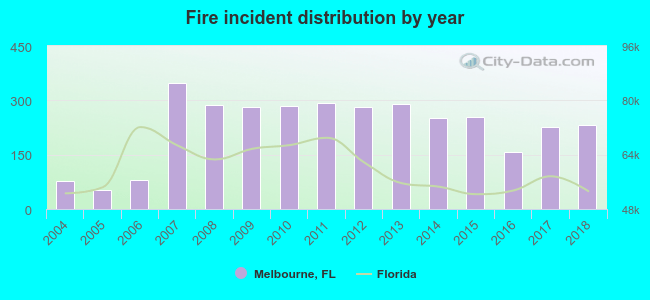 According to the data from the years 2004 - 2018 the average number of fire incidents per year is 226. The highest number of reported fires - 349 took place in 2007, and the least - 52 in 2005. The data has an increasing trend.
The average number of yearly fire incidents per 10k residents in Melbourne, FL compared to nearest cities:
(Note: Based on data for the last 3 years, including only cities with population 5,000 and above)
| Melbourne: | 26.1 |
| West Melbourne: | 38.0 |
| Indian Harbour Beach: | 12.8 |
| Satellite Beach: | 27.5 |
| South Patrick Shores: | 4.5 |
| Palm Bay: | 33.4 |
| Cocoa Beach: | 12.0 |
| Rockledge: | 25.2 |
| Merritt Island: | 26.7 |
 The median response time based on all reported fire incidents is 5 minutes. This is lower compared to the state median value.
The median response time in Melbourne, FL compared to nearest cities:
(Note: Based on data for all years, including only cities with at least 500 fire incidents)
| Melbourne: | 5 minutes |
| West Melbourne: | 7 minutes |
| Satellite Beach: | 5 minutes |
| Malabar: | 6 minutes |
| Palm Bay: | 7 minutes |
| Rockledge: | 5 minutes |
| Merritt Island: | 7 minutes |
| Cocoa: | 6 minutes |
| Cape Canaveral: | 4 minutes |
 Based on the data from the years 2004 - 2018 the average number of fire-related yearly deaths is 1. The highest number of deaths - 2 took place in 2007, and the lowest - 0 in 2004. The data has a constant trend.
The average number of fatalities per 1,000 fire incidents is 2. This indicator was the highest - 8 in 2014, and the lowest 0 in 2004. The trend for fatalities per 1,000 fire incidents is constant. Compared to the state value the number of deaths per 1,000 fires is higher.
Based on the data from the years 2004 - 2018 the average number of fire-related yearly deaths is 1. The highest number of deaths - 2 took place in 2007, and the lowest - 0 in 2004. The data has a constant trend.
The average number of fatalities per 1,000 fire incidents is 2. This indicator was the highest - 8 in 2014, and the lowest 0 in 2004. The trend for fatalities per 1,000 fire incidents is constant. Compared to the state value the number of deaths per 1,000 fires is higher.Deaths per 1,000 incidents in Melbourne, FL compared to nearest cities:
(Note: Based on data for all years, including only cities with at least 2,500 fire incidents)
| Melbourne: | 2.4 |
| Palm Bay: | 2.2 |
| Cocoa: | 1.3 |
| Titusville: | 2.9 |
| Vero Beach: | 0.2 |
| Kissimmee: | 1.4 |
| Fort Pierce: | 2.1 |
 Based on the data from the years 2004 - 2018 the average number of fire-related casualties per year is 4. The highest number of casualties - 13 took place in 2007, and the lowest - 0 in 2004. The data has a rising trend.
The average number of casualties per 1,000 fire incidents is 16. This indicator was the highest - 41 in 2011, and the lowest 0 in 2004. The trend for casualties per 1,000 fire incidents is rising. Compared to the state value the number of injuries per 1,000 incidents is higher.
Based on the data from the years 2004 - 2018 the average number of fire-related casualties per year is 4. The highest number of casualties - 13 took place in 2007, and the lowest - 0 in 2004. The data has a rising trend.
The average number of casualties per 1,000 fire incidents is 16. This indicator was the highest - 41 in 2011, and the lowest 0 in 2004. The trend for casualties per 1,000 fire incidents is rising. Compared to the state value the number of injuries per 1,000 incidents is higher.Casualties per 1,000 incidents in Melbourne, FL compared to nearest cities:
(Note: Based on data for all years, including only cities with at least 500 fire incidents)
| Melbourne: | 19.4 |
| West Melbourne: | 7.1 |
| Satellite Beach: | 14.8 |
| Malabar: | 1.8 |
| Palm Bay: | 11.5 |
| Rockledge: | 18.6 |
| Merritt Island: | 10.1 |
| Cocoa: | 6.0 |
| Cape Canaveral: | 4.9 |
 29.4% incidents where reported in the morning and 70.6% in the evening. The most fires (16.7%) took place on Saturday, and the least (12.4%) on Friday.
 Based on the 3,404 fire incidents from years 2004 - 2018 most fires (10.8%) took place during April, and the least (6.5%) in October.
 Out of all 120,051 cases reported during the years 2004 - 2018, the most belonged to the categories: Rescue & EMS (83.6%), Good Intent Call (4.9%), and Service Call (3.7%).
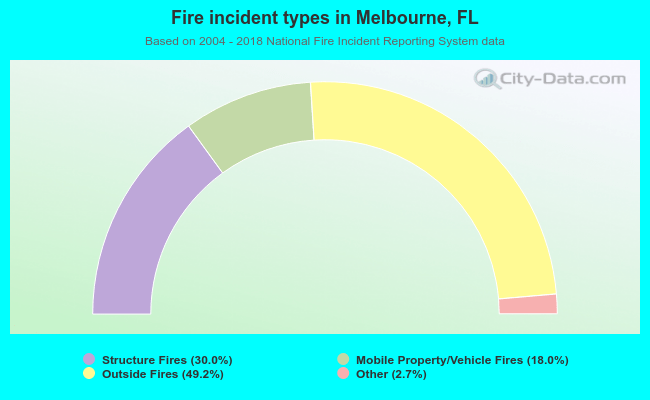 When looking into fire subcategories, the most incidents belonged to: Outside Fires (49.2%), and Structure Fires (30.0%).