Cocoa Beach: Fire Incidents, Florida (FL)
Where are fire incidents reported in Cocoa Beach, FL
Something went wrong! Please refresh the page.
|
| |||||||||||||||||||||||||||||||||||||||||||||||||||||||||||||||||||||||||||||||||||||||||||||||||||||||||||||
2002 - 2018 National Fire Incident Reporting System (NFIRS) incidents
- Incident types reported to NFIRS in Cocoa Beach, FL
- 6,66191.2%Rescue & EMS
- 2213.0%Good Intent Call
- 1562.1%Fire
- 1181.6%Service Call
- 911.2%False Alarm
- 530.7%Hazardous Condition
- Fire incident types reported to NFIRS in Cocoa Beach, FL
- 9963.5%Structure Fires
- 4025.6%Outside Fires
- 95.8%Other
- 85.1%Mobile Property/Vehicle Fires
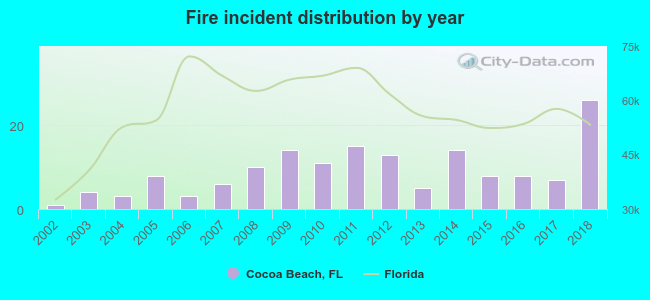 Based on the data from the years 2002 - 2018 the average number of fire incidents per year is 9. The highest number of reported fires - 26 took place in 2018, and the least - 1 in 2002. The data has a growing trend.
The average number of yearly fire incidents per 10k residents in Cocoa Beach, FL compared to nearest cities:
(Note: Based on data for the last 3 years, including only cities with population 5,000 and above)
| Cocoa Beach: | 12.0 |
| Cape Canaveral: | 37.8 |
| Merritt Island: | 26.7 |
| Rockledge: | 25.2 |
| Cocoa: | 68.3 |
| South Patrick Shores: | 4.5 |
| Satellite Beach: | 27.5 |
| Indian Harbour Beach: | 12.8 |
| Melbourne: | 26.1 |

 33.3% incidents where reported in the morning and 66.7% in the evening. The most fires (19.9%) took place on Saturday, and the least (10.9%) on Friday.
 Based on the 156 reports from years 2002 - 2018 most fires (13.5%) took place during June, and the least (5.8%) in November.
 Out of all 7,307 cases reported during the years 2002 - 2018, the most belonged to the categories: Rescue & EMS (91.2%), Good Intent Call (3.0%), and Fire (2.1%).
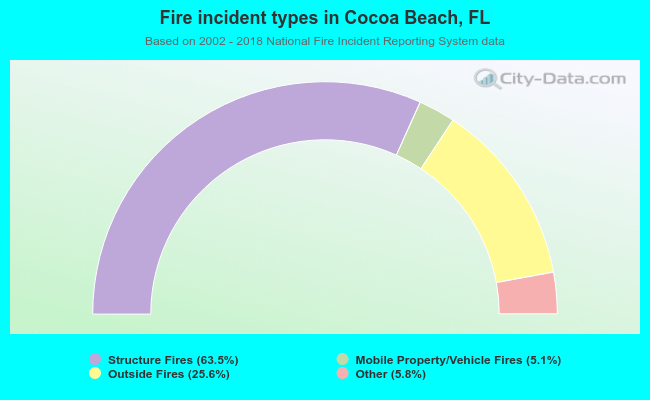 When looking into fire subcategories, the most incidents belonged to: Structure Fires (63.5%), and Outside Fires (25.6%).