Micco: Fire Incidents, Florida (FL)
Where are fire incidents reported in Micco, FL
Something went wrong! Please refresh the page.
|
| |||||||||||||||||||||||||||||||||||||||||||||||||||||||||||||||||||||||||||||||||||||||||||||||||||||||||||||
2003 - 2018 National Fire Incident Reporting System (NFIRS) incidents
- Incident types reported to NFIRS in Micco, FL
- 2,62867.7%Rescue & EMS
- 58515.1%Service Call
- 2817.2%Fire
- 1894.9%Good Intent Call
- 1303.3%Hazardous Condition
- 531.4%False Alarm
- 80.2%Special Incident
- 60.2%Overpressure Rupture
- Fire incident types reported to NFIRS in Micco, FL
- 19970.8%Outside Fires
- 4315.3%Structure Fires
- 3211.4%Mobile Property/Vehicle Fires
- 72.5%Other
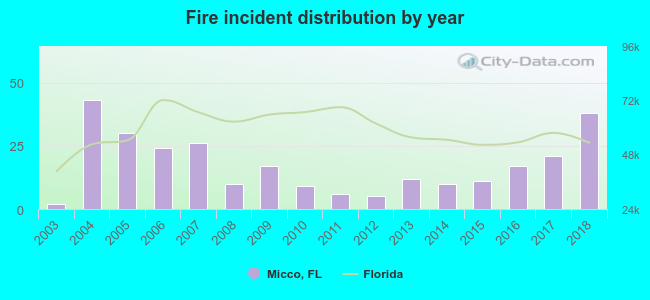 According to the data from the years 2003 - 2018 the average number of fires per year is 18. The highest number of fire incidents - 43 took place in 2004, and the least - 2 in 2003. The data has an increasing trend.
The average number of yearly fire incidents per 10k residents in Micco, FL compared to nearest cities:
(Note: Based on data for the last 3 years, including only cities with population 5,000 and above)
| Micco: | 28.0 |
| Sebastian: | 27.4 |
| Fellsmere: | 52.7 |
| Palm Bay: | 33.4 |
| West Melbourne: | 38.0 |
| Melbourne: | 26.1 |
| Vero Beach: | 238.7 |
| Indian Harbour Beach: | 12.8 |
| Satellite Beach: | 27.5 |

 30.6% incidents where reported in the morning and 69.4% in the evening. The most fires (20.6%) took place on Saturday, and the least (10.7%) on Wednesday.
 According to the 281 fire incident reports from years 2003 - 2018 most fires (13.9%) took place during May, and the least (5.7%) in September.
 Out of all 3,881 cases reported during the years 2003 - 2018, the most belonged to the categories: Rescue & EMS (67.7%), Service Call (15.1%), and Fire (7.2%).
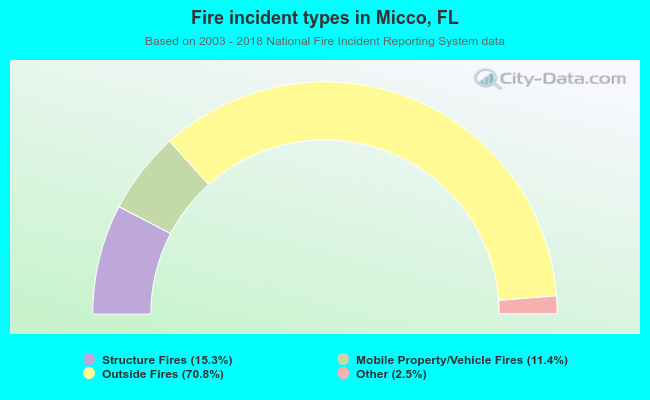 When looking into fire subcategories, the most reports belonged to: Outside Fires (70.8%), and Structure Fires (15.3%).