Riviera Beach: Fire Incidents, Florida (FL)
Where are fire incidents reported in Riviera Beach, FL
Something went wrong! Please refresh the page.
| Fire incidents reported | |
|---|---|
| Sreet name | Count |
| BLUE HERON BLVD | 436 |
| BROADWAY | 184 |
| DR MARTIN LUTHER KING JR BLVD | 130 |
| OCEAN DR | 120 |
| 13TH ST | 112 |
| OLD DIXIE HWY | 108 |
| 28TH ST | 102 |
| AVENUE | 92 |
| 15TH ST | 88 |
| MILITARY TRL | 76 |
| 10TH ST | 74 |
| 37TH ST | 70 |
| 27TH ST | 66 |
| 36TH ST | 64 |
| WEDGEWOOD PLAZA DR | 62 |
| 24TH ST | 58 |
| 25TH ST | 56 |
| 7TH ST | 56 |
| SILVER BEACH RD | 54 |
| 14TH ST | 52 |
| 16TH CT | 52 |
| CONGRESS AVE | 52 |
| MILITARY TRL | 52 |
| 1ST ST | 50 |
| BLUE HERON | 50 |
| WOODBINE WAY | 50 |
| 23RD ST | 48 |
| AVENUE J | 46 |
| LEO LN | 46 |
| 33RD ST | 44 |
2002 - 2018 National Fire Incident Reporting System (NFIRS) incidents
- Incident types reported to NFIRS in Riviera Beach, FL
- 33,19875.6%Rescue & EMS
- 3,1137.1%False Alarm
- 2,4325.5%Fire
- 2,1544.9%Hazardous Condition
- 1,9374.4%Good Intent Call
- 1,0402.4%Service Call
- Fire incident types reported to NFIRS in Riviera Beach, FL
- 1,00741.4%Structure Fires
- 78232.2%Outside Fires
- 63226.0%Mobile Property/Vehicle Fires
- 110.5%Other
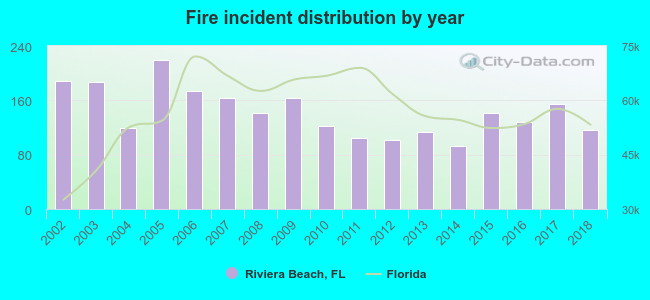 According to the data from the years 2002 - 2018 the average number of fire incidents per year is 143. The highest number of reported fire incidents - 220 took place in 2005, and the least - 93 in 2014. The data has a decreasing trend.
The average number of yearly fire incidents per 10k residents in Riviera Beach, FL compared to nearest cities:
(Note: Based on data for the last 3 years, including only cities with population 5,000 and above)
| Riviera Beach: | 39.6 |
| Lake Park: | 47.7 |
| North Palm Beach: | 17.1 |
| Palm Beach Gardens: | 2.0 |
| Palm Beach: | 41.6 |
| West Palm Beach: | 39.1 |
| Palm Springs: | 22.6 |
| Jupiter: | 3.0 |
| Royal Palm Beach: | 11.2 |
 The median response time based on all reported fire incidents is 5 minutes. This is lower than the Florida median value.
The median response time in Riviera Beach, FL compared to nearest cities:
(Note: Based on data for all years, including only cities with at least 500 fire incidents)
| Riviera Beach: | 5 minutes |
| North Palm Beach: | 5 minutes |
| Palm Beach Gardens: | 6 minutes |
| West Palm Beach: | 6 minutes |
| Jupiter: | 7 minutes |
| Lake Worth: | 6 minutes |
| Greenacres: | 5 minutes |
| Wellington: | 7 minutes |
| Boynton Beach: | 5 minutes |
 According to the data from the years 2002 - 2018 the average number of fire-related casualties per year is 7. The highest number of injuries - 14 took place in 2003, and the lowest - 1 in 2015. The data has a dropping trend.
The average number of casualties per 1,000 fires is 51. This indicator was the highest - 79 in 2013, and the lowest 7 in 2015. The trend for injuries per 1,000 fire incidents is declining. Compared to the state value the number of injuries per 1,000 incidents is much higher.
According to the data from the years 2002 - 2018 the average number of fire-related casualties per year is 7. The highest number of injuries - 14 took place in 2003, and the lowest - 1 in 2015. The data has a dropping trend.
The average number of casualties per 1,000 fires is 51. This indicator was the highest - 79 in 2013, and the lowest 7 in 2015. The trend for injuries per 1,000 fire incidents is declining. Compared to the state value the number of injuries per 1,000 incidents is much higher.Casualties per 1,000 incidents in Riviera Beach, FL compared to nearest cities:
(Note: Based on data for all years, including only cities with at least 500 fire incidents)
| Riviera Beach: | 50.2 |
| North Palm Beach: | 33.8 |
| Palm Beach Gardens: | 4.4 |
| West Palm Beach: | 23.5 |
| Jupiter: | 23.9 |
| Lake Worth: | 38.4 |
| Greenacres: | 34.9 |
| Wellington: | 29.8 |
| Boynton Beach: | 17.3 |
 37.5% incidents where reported in the morning and 62.5% in the evening. The most fires (16.8%) took place on Sunday, and the least (12.9%) on Friday.
 According to the 2,432 fires from years 2002 - 2018 most fires (11.6%) took place during July, and the least (6.2%) in February.
 Out of all 43,919 cases reported during the years 2002 - 2018, the most belonged to the categories: Rescue & EMS (75.6%), False Alarm (7.1%), and Fire (5.5%).
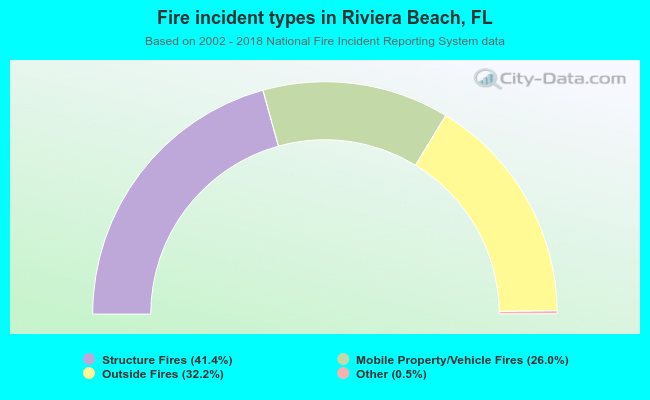 When looking into fire subcategories, the most reports belonged to: Structure Fires (41.4%), and Outside Fires (32.2%).