Palm Springs: Fire Incidents, Florida (FL)
Where are fire incidents reported in Palm Springs, FL
Something went wrong! Please refresh the page.
|
| |||||||||||||||||||||||||||||||||||||||||||||||||||||||||||||||||||||||||||||||||||||||||||||||||||||||||||||
2004 - 2018 National Fire Incident Reporting System (NFIRS) incidents
- Incident types reported to NFIRS in Palm Springs, FL
- 12,16077.4%Rescue & EMS
- 1,65010.5%Good Intent Call
- 5443.5%Service Call
- 5383.4%False Alarm
- 4302.7%Fire
- 3652.3%Hazardous Condition
- Fire incident types reported to NFIRS in Palm Springs, FL
- 18442.8%Outside Fires
- 14233.0%Structure Fires
- 9421.9%Mobile Property/Vehicle Fires
- 102.3%Other
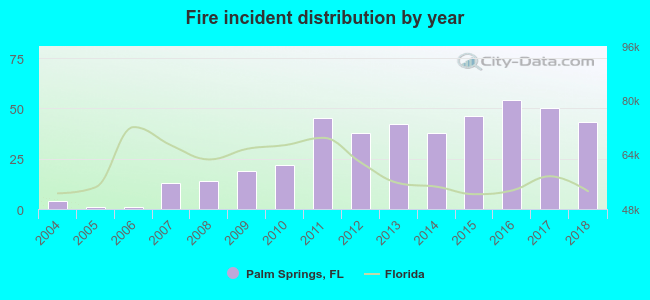 According to the data from the years 2004 - 2018 the average number of fire incidents per year is 29. The highest number of fire incidents - 54 took place in 2016, and the least - 1 in 2005. The data has an increasing trend.
The average number of yearly fire incidents per 10k residents in Palm Springs, FL compared to nearest cities:
(Note: Based on data for the last 3 years, including only cities with population 5,000 and above)
| Palm Springs: | 22.6 |
| Greenacres: | 14.3 |
| Lake Worth: | 28.6 |
| Lantana: | 26.1 |
| West Palm Beach: | 39.1 |
| Palm Beach: | 41.6 |
| Boynton Beach: | 15.6 |
| Royal Palm Beach: | 11.2 |
| Riviera Beach: | 39.6 |

 According to the reports from the years 2004 - 2018 the average number of fire-related yearly casualties is 1. The highest number of casualties - 4 took place in 2012, and the lowest - 0 in 2004. The data has a constant trend.
 33.3% incidents where reported in the morning and 66.7% in the evening. The most fires (17.7%) took place on Sunday, and the least (12.3%) on Tuesday.
 According to the 430 incident reports from years 2004 - 2018 most fires (11.2%) took place during March, and the least (4.9%) in June.
 Out of all 15,704 cases reported during the years 2004 - 2018, the most belonged to the categories: Rescue & EMS (77.4%), Good Intent Call (10.5%), and Service Call (3.5%).
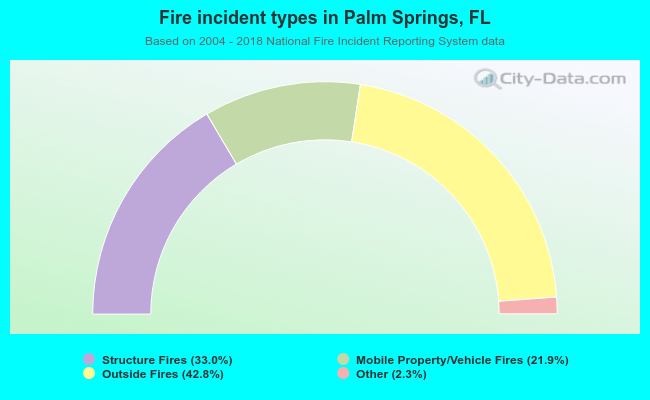 When looking into fire subcategories, the most reports belonged to: Outside Fires (42.8%), and Structure Fires (33.0%).