Lake Park: Fire Incidents, Florida (FL)
Where are fire incidents reported in Lake Park, FL
Something went wrong! Please refresh the page.
|
| |||||||||||||||||||||||||||||||||||||||||||||||||||||||||||||||||||||||||||||||||||||||||||||||||||||||||||||
2005 - 2018 National Fire Incident Reporting System (NFIRS) incidents
- Incident types reported to NFIRS in Lake Park, FL
- 5,84671.5%Rescue & EMS
- 1,02512.5%Good Intent Call
- 4265.2%Fire
- 3734.6%False Alarm
- 2783.4%Hazardous Condition
- 2122.6%Service Call
- 90.1%Special Incident
- Fire incident types reported to NFIRS in Lake Park, FL
- 25459.6%Structure Fires
- 10424.4%Outside Fires
- 6415.0%Mobile Property/Vehicle Fires
- 40.9%Other
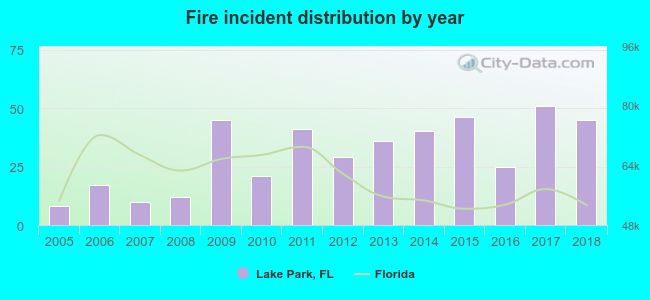 According to the data from the years 2005 - 2018 the average number of fire incidents per year is 30. The highest number of reported fire incidents - 51 took place in 2017, and the least - 8 in 2005. The data has an increasing trend.
The average number of yearly fire incidents per 10k residents in Lake Park, FL compared to nearest cities:
(Note: Based on data for the last 3 years, including only cities with population 5,000 and above)
| Lake Park: | 47.7 |
| North Palm Beach: | 17.1 |
| Riviera Beach: | 39.6 |
| Palm Beach Gardens: | 2.0 |
| Palm Beach: | 41.6 |
| West Palm Beach: | 39.1 |
| Jupiter: | 3.0 |
| Tequesta: | 21.0 |
| Palm Springs: | 22.6 |

 Based on the data from the years 2005 - 2018 the average number of fire-related yearly casualties is 1. The highest number of reported injuries - 3 took place in 2005, and the lowest - 0 in 2006. The data has a dropping trend.
 38.0% incidents where reported in the morning and 62.0% in the evening. The most fires (16.4%) took place on Friday, and the least (13.1%) on Sunday.
 Based on the 426 reports from years 2005 - 2018 most fires (12.9%) took place during March, and the least (5.2%) in February.
 Out of all 8,177 cases reported during the years 2005 - 2018, the most belonged to the categories: Rescue & EMS (71.5%), Good Intent Call (12.5%), and Fire (5.2%).
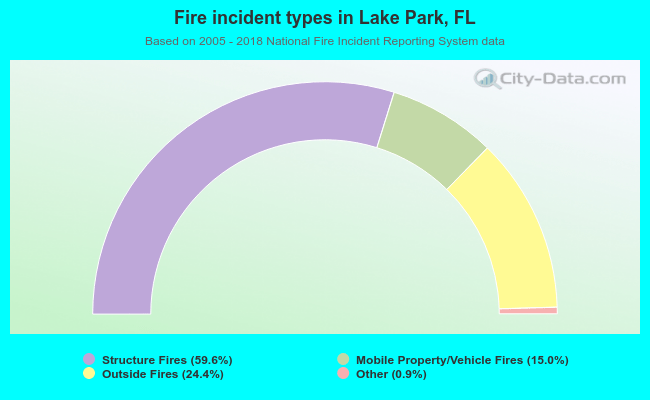 When looking into fire subcategories, the most incidents belonged to: Structure Fires (59.6%), and Outside Fires (24.4%).