Riverside: Fire Incidents, Ohio (OH)
Where are fire incidents reported in Riverside, OH
Something went wrong! Please refresh the page.
| Fire incidents reported | |
|---|---|
| Sreet name | Count |
| VALLEY (2225-2645) ST | 48 |
| AIRWAY (4669-4790) RD | 36 |
| BUSHNELL AVE | 34 |
| VALLEY22252645 ST | 32 |
| FOREST HOME AVE | 28 |
| HARSHMAN (1791-1991 ODD) RD | 28 |
| PLEASANT VALLEY AVE | 28 |
| NIMITZ DR | 26 |
| ARROWROCK AVE | 24 |
| BYESVILLE BLVD | 24 |
| HARSHMAN (2217-2661 ODD) RD | 24 |
| INTERCITY DR | 24 |
| WOODMAN1229 DR | 24 |
| GUERNSEY DELL AVE | 22 |
| PRINCE ALBERT BLVD | 22 |
| US 35COMMENTS | 22 |
| WOODMAN (1201-1481 ODD) DR | 22 |
| HARSHMAN (2000-2660 EVEN) RD | 20 |
| BROADMEAD AVE | 18 |
| DERWENT DR | 18 |
| ROHRER (1-208) BLVD | 18 |
| VANDERGRIFT DR | 18 |
| AIRWAY (4791-5499) RD | 16 |
| RONDOWA AVE | 16 |
| WOODMAN (142-499) DR | 16 |
| AMSTON DR | 14 |
| HARSHMAN20002660 EVEN RD | 14 |
| MONTICELLO AVE | 14 |
| RICHLAND AVE | 14 |
| WARRENDALE AVE | 14 |
| Other | 461 |
2002 - 2018 National Fire Incident Reporting System (NFIRS) incidents
- Incident types reported to NFIRS in Riverside, OH
- 15,87973.6%Rescue & EMS
- 1,7538.1%Hazardous Condition
- 1,3176.1%Good Intent Call
- 1,1395.3%Fire
- 9154.2%Service Call
- 5222.4%False Alarm
- 260.1%Overpressure Rupture
- Fire incident types reported to NFIRS in Riverside, OH
- 53246.7%Structure Fires
- 36932.4%Outside Fires
- 23020.2%Mobile Property/Vehicle Fires
- 80.7%Other
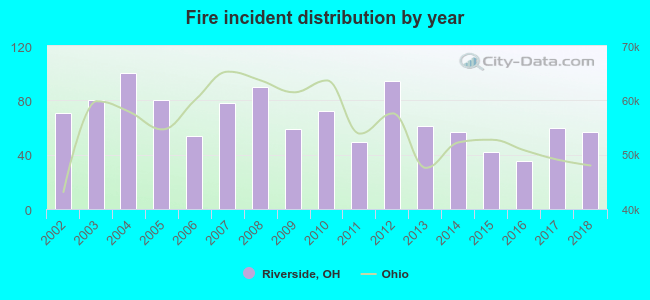 Based on the data from the years 2002 - 2018 the average number of fire incidents per year is 67. The highest number of fire incidents - 100 took place in 2004, and the least - 35 in 2016. The data has a dropping trend.
The average number of yearly fire incidents per 10k residents in Riverside, OH compared to nearest cities:
(Note: Based on data for the last 3 years, including only cities with population 5,000 and above)
| Riverside: | 20.2 |
| Dayton: | 44.3 |
| Beavercreek: | 4.4 |
| Oakwood: | 46.2 |
| Huber Heights: | 30.3 |
| Fairborn: | 22.3 |
| Shiloh: | 12.6 |
| Kettering: | 14.8 |
| Vandalia: | 55.9 |
 The median response time based on all reported fire incidents is 6 minutes. This is close to the Ohio median value.
The median response time in Riverside, OH compared to nearest cities:
(Note: Based on data for all years, including only cities with at least 500 fire incidents)
| Riverside: | 6 minutes |
| Dayton: | 5 minutes |
| Beavercreek: | 6 minutes |
| Oakwood: | 5 minutes |
| Huber Heights: | 6 minutes |
| Fairborn: | 6 minutes |
| Kettering: | 6 minutes |
| Vandalia: | 6 minutes |
| Moraine: | 5 minutes |
 Based on the reports from the years 2002 - 2018 the average number of fire-related yearly deaths is 0. The highest number of reported deaths - 1 took place in 2002, and the lowest - 0 in 2003. The data has a dropping trend.
 According to the reports from the years 2002 - 2018 the average number of fire-related casualties per year is 1. The highest number of reported casualties - 6 took place in 2003, and the lowest - 0 in 2004. The data has a dropping trend.
The average number of casualties per 1,000 fire incidents is 23. This indicator was the highest - 114 in 2016, and the lowest 0 in 2004. The trend for injuries per 1,000 fires is decreasing. Compared to the Ohio value the number of casualties per 1,000 incidents is higher.
According to the reports from the years 2002 - 2018 the average number of fire-related casualties per year is 1. The highest number of reported casualties - 6 took place in 2003, and the lowest - 0 in 2004. The data has a dropping trend.
The average number of casualties per 1,000 fire incidents is 23. This indicator was the highest - 114 in 2016, and the lowest 0 in 2004. The trend for injuries per 1,000 fires is decreasing. Compared to the Ohio value the number of casualties per 1,000 incidents is higher.Casualties per 1,000 incidents in Riverside, OH compared to nearest cities:
(Note: Based on data for all years, including only cities with at least 500 fire incidents)
| Riverside: | 19.3 |
| Dayton: | 20.5 |
| Beavercreek: | 36.2 |
| Oakwood: | 2.1 |
| Huber Heights: | 35.6 |
| Fairborn: | 27.6 |
| Kettering: | 25.7 |
| Vandalia: | 34.9 |
| Moraine: | 20.1 |
 33.0% incidents where reported in the morning and 67.0% in the evening. The most fires (16.9%) took place on Saturday, and the least (11.2%) on Tuesday.
 Based on the 1,139 fire incident reports from years 2002 - 2018 most fires (12.6%) took place during July, and the least (6.1%) in December.
 Out of all 21,561 cases reported during the years 2002 - 2018, the most belonged to the categories: Rescue & EMS (73.6%), Hazardous Condition (8.1%), and Good Intent Call (6.1%).
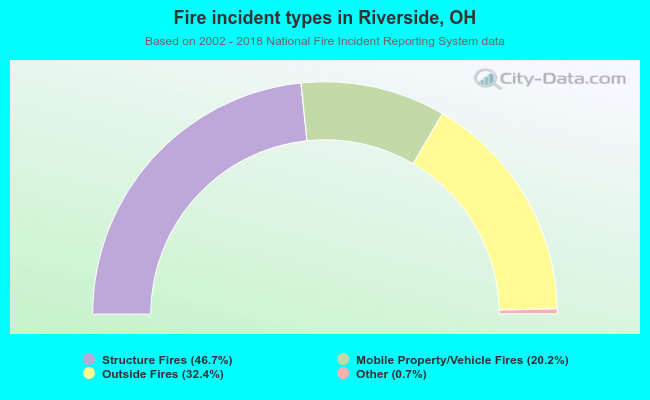 When looking into fire subcategories, the most reports belonged to: Structure Fires (46.7%), and Outside Fires (32.4%).