Huber Heights: Fire Incidents, Ohio (OH)
Where are fire incidents reported in Huber Heights, OH
Something went wrong! Please refresh the page.
| Fire incidents reported | |
|---|---|
| Sreet name | Count |
| BRANDT PIKE | 246 |
| OLD TROY PIKE | 240 |
| INTERSTATE 70 | 96 |
| CHAMBERSBURG RD | 92 |
| TAYLORSVILLE RD | 68 |
| TROY VILLA BLVD | 46 |
| FISHBURG RD | 44 |
| HARSHMANVILLE RD | 44 |
| BRANDT PK | 42 |
| EXECUTIVE BLVD | 38 |
| MOUNT HOOD | 36 |
| BRANDT | 34 |
| POWELL RD | 34 |
| FISHER DR | 32 |
| OLD TROY PK | 32 |
| BELLEFONTAINE RD | 30 |
| SHULL RD | 30 |
| BUFORT BLVD | 26 |
| CENTER POINT 70 BLVD | 20 |
| WAYNETOWNE BLVD | 20 |
| OLD TROY | 18 |
| RIP RAP RD | 18 |
| ALTER RD | 16 |
| DIAL DR | 16 |
| LONGFORD RD | 16 |
| MERILY WAY | 16 |
| TILBURY RD | 16 |
| CHANNINGWAY CT | 14 |
| CHARLESGATE RD | 14 |
| CLAYBECK DR | 14 |
| Other | 82 |
2002 - 2018 National Fire Incident Reporting System (NFIRS) incidents
- Incident types reported to NFIRS in Huber Heights, OH
- 6,19045.0%Rescue & EMS
- 2,21616.1%Hazardous Condition
- 1,73612.6%Good Intent Call
- 1,49010.8%Fire
- 1,0467.6%False Alarm
- 9837.2%Service Call
- 750.5%Overpressure Rupture
- Fire incident types reported to NFIRS in Huber Heights, OH
- 66644.7%Structure Fires
- 57238.4%Outside Fires
- 24916.7%Mobile Property/Vehicle Fires
- 30.2%Other
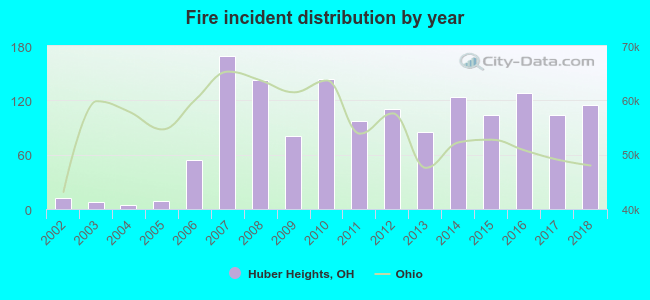 According to the data from the years 2002 - 2018 the average number of fire incidents per year is 88. The highest number of reported fires - 169 took place in 2007, and the least - 4 in 2004. The data has a growing trend.
The average number of yearly fire incidents per 10k residents in Huber Heights, OH compared to nearest cities:
(Note: Based on data for the last 3 years, including only cities with population 5,000 and above)
| Huber Heights: | 30.3 |
| Vandalia: | 55.9 |
| Riverside: | 20.2 |
| Shiloh: | 12.6 |
| Fairborn: | 22.3 |
| Dayton: | 44.3 |
| New Carlisle: | 93.9 |
| Tipp City: | 55.5 |
| Beavercreek: | 4.4 |
 The median response time based on all reported fire incidents is 6 minutes. This is close to the Ohio median value.
The median response time in Huber Heights, OH compared to nearest cities:
(Note: Based on data for all years, including only cities with at least 500 fire incidents)
| Huber Heights: | 6 minutes |
| Vandalia: | 6 minutes |
| Riverside: | 6 minutes |
| Fairborn: | 6 minutes |
| Dayton: | 5 minutes |
| New Carlisle: | 8 minutes |
| Tipp City: | 10 minutes |
| Beavercreek: | 6 minutes |
| Englewood: | 5 minutes |
 Based on the data from the years 2002 - 2018 the average number of fire-related fatalities per year is 0. The highest number of deaths - 4 took place in 2018, and the lowest - 0 in 2002. The data has a growing trend.
 Based on the data from the years 2002 - 2018 the average number of fire-related casualties per year is 3. The highest number of casualties - 12 took place in 2010, and the lowest - 0 in 2002. The data has an increasing trend.
The average number of casualties per 1,000 fires is 26. This indicator was the highest - 83 in 2010, and the lowest 0 in 2002. The trend for casualties per 1,000 fire incidents is growing. Compared to the state value the number of injuries per 1,000 fires is much higher.
Based on the data from the years 2002 - 2018 the average number of fire-related casualties per year is 3. The highest number of casualties - 12 took place in 2010, and the lowest - 0 in 2002. The data has an increasing trend.
The average number of casualties per 1,000 fires is 26. This indicator was the highest - 83 in 2010, and the lowest 0 in 2002. The trend for casualties per 1,000 fire incidents is growing. Compared to the state value the number of injuries per 1,000 fires is much higher.Casualties per 1,000 incidents in Huber Heights, OH compared to nearest cities:
(Note: Based on data for all years, including only cities with at least 500 fire incidents)
| Huber Heights: | 35.6 |
| Vandalia: | 34.9 |
| Riverside: | 19.3 |
| Fairborn: | 27.6 |
| Dayton: | 20.5 |
| New Carlisle: | 4.3 |
| Tipp City: | 9.2 |
| Beavercreek: | 36.2 |
| Englewood: | 27.4 |
 29.1% incidents where reported in the morning and 70.9% in the evening. The most fires (16.0%) took place on Sunday, and the least (12.9%) on Friday.
 Based on the 1,490 fires from years 2002 - 2018 most fires (11.5%) took place during April, and the least (5.6%) in December.
 Out of all 13,746 cases reported during the years 2002 - 2018, the most belonged to the categories: Rescue & EMS (45.0%), Hazardous Condition (16.1%), and Good Intent Call (12.6%).
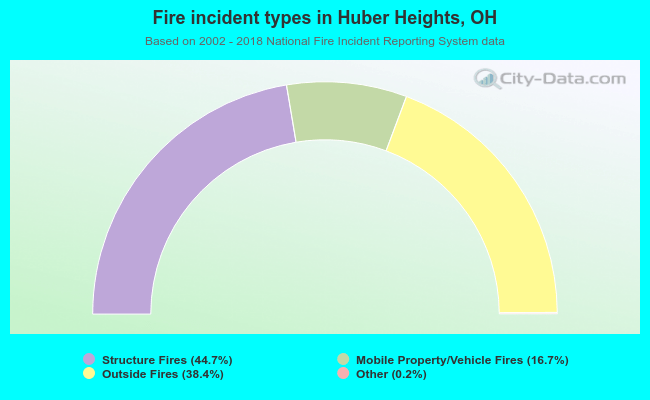 When looking into fire subcategories, the most incidents belonged to: Structure Fires (44.7%), and Outside Fires (38.4%).