Kettering: Fire Incidents, Ohio (OH)
Where are fire incidents reported in Kettering, OH
Something went wrong! Please refresh the page.
| Fire incidents reported | |
|---|---|
| Sreet name | Count |
| DOROTHY LN | 188 |
| STROOP RD | 120 |
| WOODMAN DR | 68 |
| FAR HILLS AVE | 54 |
| WILMINGTON PK | 54 |
| WILMINGTON PIKE | 48 |
| BIGGER RD | 28 |
| SOUTHERN BLVD | 28 |
| WHIPP RD | 28 |
| DAVID RD | 26 |
| DIXIE HWY | 26 |
| FORRER BLVD | 26 |
| SHROYER RD | 24 |
| SMITHVILLE RD | 24 |
| GLENGARRY DR | 22 |
| ARAGON AVE | 20 |
| BEAVER RIDGE DR | 20 |
| CROFTSHIRE DR | 20 |
| GRACEMORE AVE | 20 |
| CHIMNEY LN | 18 |
| ISAAC PRUGH WAY | 18 |
| RAHN RD | 18 |
| SOUTHDALE DR | 18 |
| ACKERMAN BLVD | 16 |
| MARSHALL RD | 16 |
| PARLIAMENT PL | 16 |
| BATAAN DR | 14 |
| BLACKHAWK RD | 14 |
| BROWNLEIGH RD | 14 |
| COACH DR | 14 |
| Other | 382 |
2004 - 2018 National Fire Incident Reporting System (NFIRS) incidents
- Incident types reported to NFIRS in Kettering, OH
- 21,78965.6%Rescue & EMS
- 3,50410.5%Service Call
- 3,1279.4%Hazardous Condition
- 1,9135.8%Good Intent Call
- 1,4114.2%False Alarm
- 1,4024.2%Fire
- 560.2%Overpressure Rupture
- Fire incident types reported to NFIRS in Kettering, OH
- 74453.1%Structure Fires
- 47333.7%Outside Fires
- 18112.9%Mobile Property/Vehicle Fires
- 40.3%Other
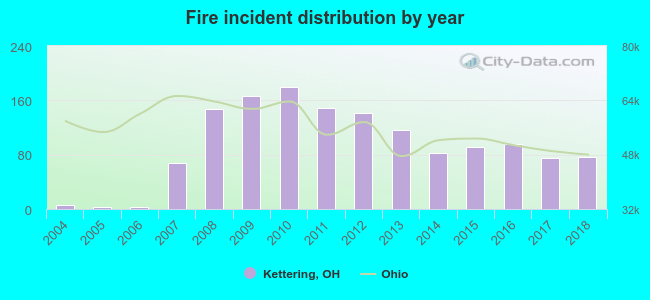 According to the data from the years 2004 - 2018 the average number of fires per year is 93. The highest number of reported fires - 180 took place in 2010, and the least - 3 in 2005. The data has an increasing trend.
The average number of yearly fire incidents per 10k residents in Kettering, OH compared to nearest cities:
(Note: Based on data for the last 3 years, including only cities with population 5,000 and above)
| Kettering: | 14.8 |
| Oakwood: | 46.2 |
| Moraine: | 108.9 |
| Centerville: | 14.6 |
| Dayton: | 44.3 |
| Beavercreek: | 4.4 |
| Bellbrook: | 10.0 |
| West Carrollton City: | 1.2 |
| West Carrollton: | 35.8 |
 The median response time based on all reported fire incidents is 6 minutes. This is comparable to the state median value.
The median response time in Kettering, OH compared to nearest cities:
(Note: Based on data for all years, including only cities with at least 500 fire incidents)
| Kettering: | 6 minutes |
| Oakwood: | 5 minutes |
| Moraine: | 5 minutes |
| Centerville: | 7 minutes |
| Dayton: | 5 minutes |
| Beavercreek: | 6 minutes |
| West Carrollton: | 5 minutes |
| Riverside: | 6 minutes |
| Miamisburg: | 6 minutes |
 Based on the data from the years 2004 - 2018 the average number of fire-related fatalities per year is 0. The highest number of reported deaths - 1 took place in 2007, and the lowest - 0 in 2004. The data has a constant trend.
 Based on the data from the years 2004 - 2018 the average number of fire-related yearly casualties is 2. The highest number of reported injuries - 12 took place in 2011, and the lowest - 0 in 2004. The data has a growing trend.
The average number of casualties per 1,000 fire incidents is 17. This indicator was the highest - 81 in 2011, and the lowest 0 in 2004. The trend for casualties per 1,000 fire incidents is increasing. Compared to the state value the number of injuries per 1,000 incidents is higher.
Based on the data from the years 2004 - 2018 the average number of fire-related yearly casualties is 2. The highest number of reported injuries - 12 took place in 2011, and the lowest - 0 in 2004. The data has a growing trend.
The average number of casualties per 1,000 fire incidents is 17. This indicator was the highest - 81 in 2011, and the lowest 0 in 2004. The trend for casualties per 1,000 fire incidents is increasing. Compared to the state value the number of injuries per 1,000 incidents is higher.Casualties per 1,000 incidents in Kettering, OH compared to nearest cities:
(Note: Based on data for all years, including only cities with at least 500 fire incidents)
| Kettering: | 25.7 |
| Oakwood: | 2.1 |
| Moraine: | 20.1 |
| Centerville: | 33.9 |
| Dayton: | 20.5 |
| Beavercreek: | 36.2 |
| West Carrollton: | 23.9 |
| Riverside: | 19.3 |
| Miamisburg: | 14.3 |
 30.2% incidents where reported in the morning and 69.8% in the evening. The most fires (15.5%) took place on Thursday, and the least (12.5%) on Saturday.
 According to the 1,402 reports from years 2004 - 2018 most fires (10.4%) took place during September, and the least (5.1%) in February.
 Out of all 33,234 cases reported during the years 2004 - 2018, the most belonged to the categories: Rescue & EMS (65.6%), Service Call (10.5%), and Hazardous Condition (9.4%).
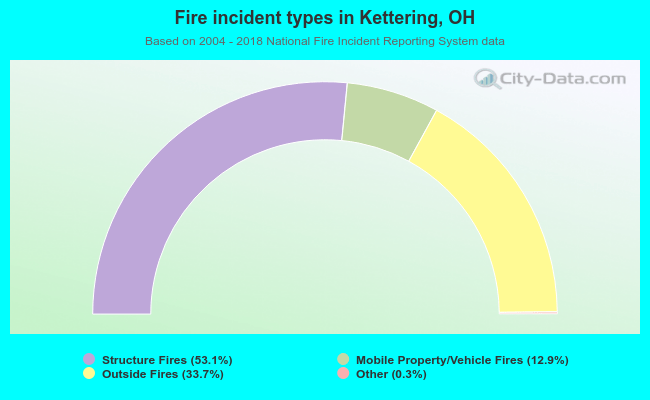 When looking into fire subcategories, the most reports belonged to: Structure Fires (53.1%), and Outside Fires (33.7%).