Ripley: Fire Incidents, Tennessee (TN)
Where are fire incidents reported in Ripley, TN
Something went wrong! Please refresh the page.
|
| |||||||||||||||||||||||||||||||||||||||||||||||||||||||||||||||||||||||||||||||||||||||||||||||||||||||||||||
| Other | 760 | |||||||||||||||||||||||||||||||||||||||||||||||||||||||||||||||||||||||||||||||||||||||||||||||||||||||||||||
2006 - 2018 National Fire Incident Reporting System (NFIRS) incidents
- Incident types reported to NFIRS in Ripley, TN
- 3,88064.2%Rescue & EMS
- 1,39623.1%Fire
- 3015.0%False Alarm
- 2063.4%Good Intent Call
- 1182.0%Hazardous Condition
- 1131.9%Service Call
- 150.2%Overpressure Rupture
- 80.1%Severe Weather
- Fire incident types reported to NFIRS in Ripley, TN
- 59142.3%Outside Fires
- 50736.3%Structure Fires
- 22516.1%Mobile Property/Vehicle Fires
- 735.2%Other
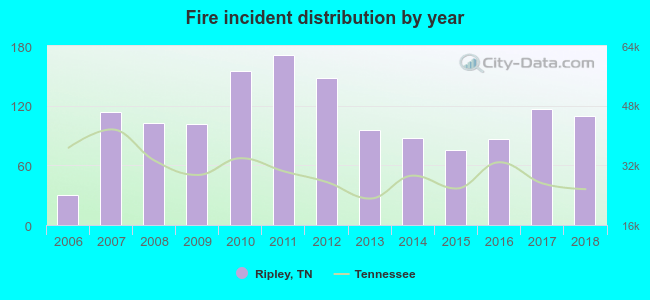 According to the data from the years 2006 - 2018 the average number of fire incidents per year is 107. The highest number of fire incidents - 171 took place in 2011, and the least - 30 in 2006. The data has a rising trend.
The average number of yearly fire incidents per 10k residents in Ripley, TN compared to nearest cities:
(Note: Based on data for the last 3 years, including only cities with population 5,000 and above)
| Ripley: | 126.4 |
| Covington: | 142.4 |
| Brownsville: | 118.3 |
| Dyersburg: | 112.6 |
| Munford: | 50.1 |
| Atoka: | 78.0 |
| Drummonds: | 38.0 |
| Arlington: | 86.2 |
| Millington: | 173.9 |
 The median response time based on all reported fire incidents is 6 minutes. This is comparable to the Tennessee median value.
The median response time in Ripley, TN compared to nearest cities:
(Note: Based on data for all years, including only cities with at least 500 fire incidents)
| Ripley: | 6 minutes |
| Covington: | 5 minutes |
| Brownsville: | 8 minutes |
| Burlison: | 14 minutes |
| Brighton: | 9 minutes |
| Dyersburg: | 5 minutes |
| Blytheville: | 4 minutes |
| Osceola: | 3 minutes |
| Munford: | 5 minutes |
 33.3% incidents where reported in the morning and 66.7% in the evening. The most fires (16.7%) took place on Sunday, and the least (12.5%) on Wednesday.
 According to the 1,396 reports from years 2006 - 2018 most fires (11.6%) took place during January, and the least (5.8%) in August.
 Out of all 6,042 cases reported during the years 2006 - 2018, the most belonged to the categories: Rescue & EMS (64.2%), Fire (23.1%), and False Alarm (5.0%).
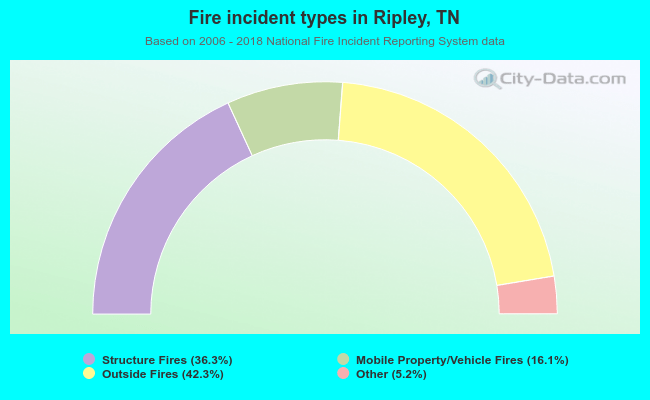 When looking into fire subcategories, the most reports belonged to: Outside Fires (42.3%), and Structure Fires (36.3%).