Dyersburg: Fire Incidents, Tennessee (TN)
Where are fire incidents reported in Dyersburg, TN
Something went wrong! Please refresh the page.
| Fire incidents reported | |
|---|---|
| Sreet name | Count |
| LAKE RD. | 126 |
| ST. JOHN AVE. | 96 |
| LAKE RD | 80 |
| MAIN ST. (SOUTH) | 70 |
| COURT ST. (EAST) | 58 |
| HWY. 51 BYPASS S. | 54 |
| WHEELER ST. | 52 |
| FORREST ST. | 44 |
| PHILLIPS ST. | 44 |
| 104 HWY | 42 |
| HWY. 51 BYPASS W. | 42 |
| HIGHWAY 412 | 40 |
| ST JOHN | 38 |
| I155 | 36 |
| ST JOHN AVE | 36 |
| CHRISTIE ST. | 34 |
| TICKLE ST. (EAST) | 34 |
| UPPER FINLEY ROAD (EAST) | 34 |
| COURT STEAST | 32 |
| HWY 51 SOUTH | 32 |
| CHRISTIE ST | 30 |
| HWY 51 BYPASS E | 30 |
| SCHAFFER ST. | 30 |
| SYLVAN RD. | 30 |
| HARRIS ST. | 28 |
| HWY 210 SOUTH | 28 |
| HWY 51 BYPASS S | 28 |
| TUCKER ST. | 28 |
| BUTTERWORTH AVE. | 26 |
| FAIR ST. | 26 |
| Other | 1,725 |
2003 - 2018 National Fire Incident Reporting System (NFIRS) incidents
- Incident types reported to NFIRS in Dyersburg, TN
- 3,03348.6%Fire
- 1,24820.0%Hazardous Condition
- 98815.8%False Alarm
- 5799.3%Rescue & EMS
- 1993.2%Good Intent Call
- 1292.1%Service Call
- 430.7%Overpressure Rupture
- 140.2%Special Incident
- 100.2%Severe Weather
- Fire incident types reported to NFIRS in Dyersburg, TN
- 1,27342.0%Outside Fires
- 1,04534.5%Structure Fires
- 44914.8%Mobile Property/Vehicle Fires
- 2668.8%Other
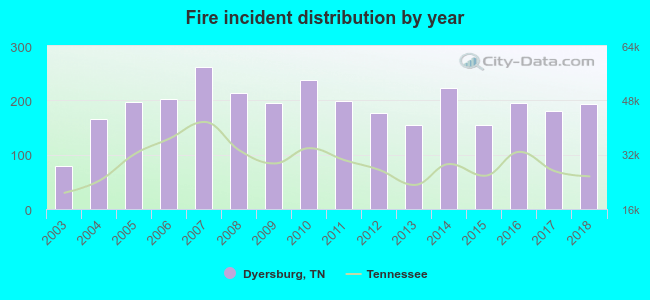 Based on the data from the years 2003 - 2018 the average number of fires per year is 189. The highest number of reported fires - 262 took place in 2007, and the least - 79 in 2003. The data has a growing trend.
The average number of yearly fire incidents per 10k residents in Dyersburg, TN compared to nearest cities:
(Note: Based on data for the last 3 years, including only cities with population 5,000 and above)
| Dyersburg: | 112.6 |
| Ripley: | 126.4 |
| Humboldt: | 67.1 |
| Brownsville: | 118.3 |
| Union City: | 103.1 |
| Milan: | 106.8 |
| Covington: | 142.4 |
| Martin: | 58.9 |
 The median response time based on all reported fire incidents is 5 minutes. This is lower than the state median value.
The median response time in Dyersburg, TN compared to nearest cities:
(Note: Based on data for all years, including only cities with at least 500 fire incidents)
| Dyersburg: | 5 minutes |
| Newbern: | 8 minutes |
| Caruthersville: | 3 minutes |
| Ripley: | 6 minutes |
| Trenton: | 6 minutes |
| Humboldt: | 4 minutes |
| Blytheville: | 4 minutes |
| Brownsville: | 8 minutes |
| Portageville: | 9 minutes |
 Based on the data from the years 2003 - 2018 the average number of fire-related yearly deaths is 1. The highest number of deaths - 4 took place in 2018, and the lowest - 0 in 2003. The data has an increasing trend.
The average number of fatalities per 1,000 fire incidents is 4. This indicator was the highest - 21 in 2018, and the lowest 0 in 2003. The trend for deaths per 1,000 incidents is growing. Compared to the Tennessee value the number of deaths per 1,000 fire incidents is higher.
Based on the data from the years 2003 - 2018 the average number of fire-related yearly deaths is 1. The highest number of deaths - 4 took place in 2018, and the lowest - 0 in 2003. The data has an increasing trend.
The average number of fatalities per 1,000 fire incidents is 4. This indicator was the highest - 21 in 2018, and the lowest 0 in 2003. The trend for deaths per 1,000 incidents is growing. Compared to the Tennessee value the number of deaths per 1,000 fire incidents is higher.Deaths per 1,000 incidents in Dyersburg, TN compared to nearest cities:
(Note: Based on data for all years, including only cities with at least 2,500 fire incidents)
| Dyersburg: | 4.3 |
| Blytheville: | 3.5 |
 Based on the reports from the years 2003 - 2018 the average number of fire-related yearly casualties is 2. The highest number of reported injuries - 12 took place in 2006, and the lowest - 0 in 2012. The data has a dropping trend.
The average number of casualties per 1,000 fire incidents is 13. This indicator was the highest - 59 in 2006, and the lowest 0 in 2012. The trend for casualties per 1,000 fire incidents is decreasing. Compared to the state value the number of injuries per 1,000 fire incidents is higher.
Based on the reports from the years 2003 - 2018 the average number of fire-related yearly casualties is 2. The highest number of reported injuries - 12 took place in 2006, and the lowest - 0 in 2012. The data has a dropping trend.
The average number of casualties per 1,000 fire incidents is 13. This indicator was the highest - 59 in 2006, and the lowest 0 in 2012. The trend for casualties per 1,000 fire incidents is decreasing. Compared to the state value the number of injuries per 1,000 fire incidents is higher.Casualties per 1,000 incidents in Dyersburg, TN compared to nearest cities:
(Note: Based on data for all years, including only cities with at least 500 fire incidents)
| Dyersburg: | 12.9 |
| Newbern: | 1.4 |
| Caruthersville: | 0.0 |
| Ripley: | 0.0 |
| Trenton: | 0.8 |
| Humboldt: | 12.1 |
| Blytheville: | 4.9 |
| Brownsville: | 3.4 |
| Portageville: | 0.0 |
 31.0% incidents where reported in the morning and 69.0% in the evening. The most fires (15.6%) took place on Saturday, and the least (13.4%) on Thursday.
 According to the 3,033 fires from years 2003 - 2018 most fires (10.6%) took place during July, and the least (6.5%) in December.
 Out of all 6,243 cases reported during the years 2003 - 2018, the most belonged to the categories: Fire (48.6%), Hazardous Condition (20.0%), and False Alarm (15.8%).
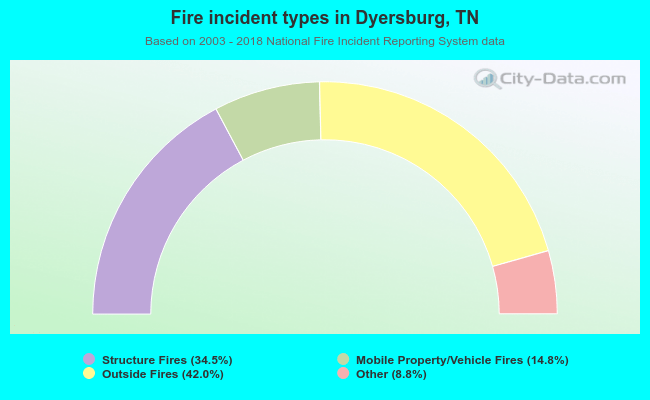 When looking into fire subcategories, the most incidents belonged to: Outside Fires (42.0%), and Structure Fires (34.5%).