Myrtle Beach: Fire Incidents, South Carolina (SC)
Where are fire incidents reported in Myrtle Beach, SC
Something went wrong! Please refresh the page.
| Fire incidents reported | |
|---|---|
| Sreet name | Count |
| OCEAN BLVD | 1,624 |
| KINGS HWY | 1,010 |
| 501 HWY | 202 |
| DICK POND RD | 124 |
| OAK ST | 124 |
| GREENS BLVD | 116 |
| KINGS RD | 116 |
| SHORE DR | 114 |
| ROBERT M. GRISSOM PKY | 106 |
| SEABOARD ST | 106 |
| HWY 707 | 104 |
| MR JOE WHITE AVE | 104 |
| 3RD AVE | 98 |
| 15 HWY | 96 |
| DUNBAR ST | 94 |
| 21ST AVE | 90 |
| BURCALE RD | 84 |
| ROBERT M GRISSOM PKY | 84 |
| CELEBRITY CIR | 82 |
| HWY 501 | 76 |
| MR. JOE WHITE AVE | 76 |
| HWY 544 | 74 |
| IVYSTONE DR | 72 |
| SOCASTEE BLVD | 72 |
| 5TH AVE | 68 |
| CANNON RD | 66 |
| 17 HWY | 62 |
| 17TH AVE | 60 |
| 38TH AVE | 56 |
| FORESTBROOK RD | 56 |
| Other | 1,752 |
2003 - 2018 National Fire Incident Reporting System (NFIRS) incidents
- Incident types reported to NFIRS in Myrtle Beach, SC
- 92,81565.6%Rescue & EMS
- 13,3269.4%Good Intent Call
- 12,7299.0%False Alarm
- 10,6637.5%Service Call
- 6,9684.9%Fire
- 4,4933.2%Hazardous Condition
- 2770.2%Special Incident
- 1600.1%Overpressure Rupture
- Fire incident types reported to NFIRS in Myrtle Beach, SC
- 3,06444.0%Outside Fires
- 2,66338.2%Structure Fires
- 1,10515.9%Mobile Property/Vehicle Fires
- 1362.0%Other
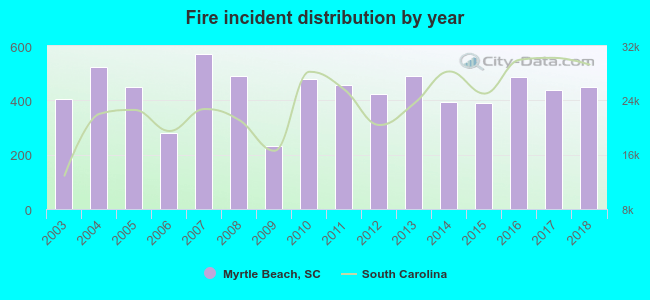 According to the data from the years 2003 - 2018 the average number of fires per year is 435. The highest number of reported fires - 571 took place in 2007, and the least - 232 in 2009. The data has a rising trend.
The average number of yearly fire incidents per 10k residents in Myrtle Beach, SC compared to nearest cities:
(Note: Based on data for the last 3 years, including only cities with population 5,000 and above)
| Myrtle Beach: | 152.6 |
| North Myrtle Beach: | 71.6 |
| Conway: | 147.9 |
| Murrells Inlet: | 92.8 |
| Longs: | 97.8 |
| Little River: | 64.7 |
| Georgetown: | 172.3 |
| Marion: | 88.9 |
| Lake City: | 190.6 |
 The median response time based on all reported fire incidents is 5 minutes. This is lower compared to the state median value.
The median response time in Myrtle Beach, SC compared to nearest cities:
(Note: Based on data for all years, including only cities with at least 500 fire incidents)
| Myrtle Beach: | 5 minutes |
| North Myrtle Beach: | 4 minutes |
| Conway: | 7 minutes |
| Murrells Inlet: | 5 minutes |
| Longs: | 10 minutes |
| Little River: | 7 minutes |
| Calabash: | 9 minutes |
| Pawleys Island: | 6 minutes |
| Loris: | 9 minutes |
 Based on the data from the years 2003 - 2018 the average number of fire-related yearly deaths is 1. The highest number of reported deaths - 4 took place in 2017, and the lowest - 0 in 2003. The data has a constant trend.
The average number of deaths per 1,000 fires is 1. This indicator was the highest - 9 in 2017, and the lowest 0 in 2003. The trend for fatalities per 1,000 incidents is constant. Compared to the South Carolina value the number of deaths per 1,000 fire incidents is lower.
Based on the data from the years 2003 - 2018 the average number of fire-related yearly deaths is 1. The highest number of reported deaths - 4 took place in 2017, and the lowest - 0 in 2003. The data has a constant trend.
The average number of deaths per 1,000 fires is 1. This indicator was the highest - 9 in 2017, and the lowest 0 in 2003. The trend for fatalities per 1,000 incidents is constant. Compared to the South Carolina value the number of deaths per 1,000 fire incidents is lower.Deaths per 1,000 incidents in Myrtle Beach, SC compared to nearest cities:
(Note: Based on data for all years, including only cities with at least 2,500 fire incidents)
| Myrtle Beach: | 1.7 |
| Conway: | 3.0 |
 According to the data from the years 2003 - 2018 the average number of fire-related casualties per year is 9. The highest number of injuries - 19 took place in 2018, and the lowest - 4 in 2004. The data has an increasing trend.
The average number of casualties per 1,000 fire incidents is 22. This indicator was the highest - 42 in 2018, and the lowest 8 in 2004. The trend for casualties per 1,000 fire incidents is rising. Compared to the state value the number of casualties per 1,000 incidents is much higher.
According to the data from the years 2003 - 2018 the average number of fire-related casualties per year is 9. The highest number of injuries - 19 took place in 2018, and the lowest - 4 in 2004. The data has an increasing trend.
The average number of casualties per 1,000 fire incidents is 22. This indicator was the highest - 42 in 2018, and the lowest 8 in 2004. The trend for casualties per 1,000 fire incidents is rising. Compared to the state value the number of casualties per 1,000 incidents is much higher.Casualties per 1,000 incidents in Myrtle Beach, SC compared to nearest cities:
(Note: Based on data for all years, including only cities with at least 500 fire incidents)
| Myrtle Beach: | 21.4 |
| North Myrtle Beach: | 16.4 |
| Conway: | 17.3 |
| Murrells Inlet: | 2.6 |
| Longs: | 18.2 |
| Little River: | 14.3 |
| Calabash: | 1.9 |
| Pawleys Island: | 4.2 |
| Loris: | 19.9 |
 31.2% incidents where reported in the morning and 68.8% in the evening. The most fires (17.2%) took place on Saturday, and the least (13.0%) on Wednesday.
 Based on the 6,968 fires from years 2003 - 2018 most fires (10.6%) took place during March, and the least (6.7%) in November.
 Out of all 141,541 cases reported during the years 2003 - 2018, the most belonged to the categories: Rescue & EMS (65.6%), Good Intent Call (9.4%), and False Alarm (9.0%).
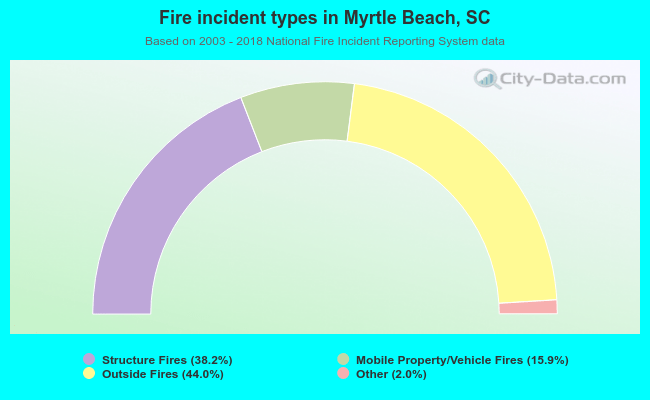 When looking into fire subcategories, the most incidents belonged to: Outside Fires (44.0%), and Structure Fires (38.2%).