Georgetown: Fire Incidents, South Carolina (SC)
Where are fire incidents reported in Georgetown, SC
Something went wrong! Please refresh the page.
| Fire incidents reported | |
|---|---|
| Sreet name | Count |
| FRASER ST | 218 |
| HIGHMARKET ST | 108 |
| FRONT ST | 90 |
| POWELL RD | 72 |
| CHURCH ST | 66 |
| CHOPPEE RD | 62 |
| BROWNS FERRY RD | 56 |
| PRINCE ST | 56 |
| DUKE ST | 54 |
| INDIAN HUT RD | 52 |
| WINYAH ST | 46 |
| KAMINSKI ST | 38 |
| KENT RD | 36 |
| EMANUEL ST | 34 |
| GEORGETOWN HWY | 34 |
| COUNTY LINE RD | 26 |
| PENNYROYAL RD | 26 |
| DUNBAR RD | 24 |
| ROSE HILL RD | 24 |
| MARTIN ST | 22 |
| MONTFORD RD | 22 |
| SAINTS DELIGHT RD | 22 |
| WALKER RD | 22 |
| EXODUS DR | 20 |
| GREEN ACRES DR | 20 |
| HAZARD ST | 20 |
| SOUTH ISLAND RD | 20 |
| ANNIE VILLAGE RD | 18 |
| COLUMBUS RD | 18 |
| HARRIS LANDING RD | 18 |
| Other | 600 |
2002 - 2018 National Fire Incident Reporting System (NFIRS) incidents
- Incident types reported to NFIRS in Georgetown, SC
- 24,46365.3%Rescue & EMS
- 4,05110.8%Hazardous Condition
- 3,5679.5%Service Call
- 1,9445.2%Fire
- 1,3973.7%Good Intent Call
- 1,2693.4%False Alarm
- 5761.5%Special Incident
- 1930.5%Severe Weather
- Fire incident types reported to NFIRS in Georgetown, SC
- 87445.0%Outside Fires
- 63632.7%Structure Fires
- 35818.4%Mobile Property/Vehicle Fires
- 763.9%Other
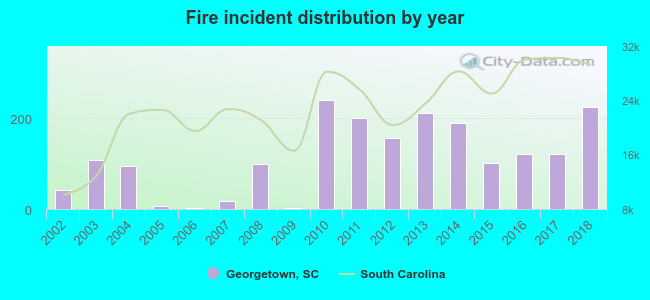 According to the data from the years 2002 - 2018 the average number of fires per year is 114. The highest number of fire incidents - 240 took place in 2010, and the least - 2 in 2009. The data has an increasing trend.
The average number of yearly fire incidents per 10k residents in Georgetown, SC compared to nearest cities:
(Note: Based on data for the last 3 years, including only cities with population 5,000 and above)
| Georgetown: | 172.3 |
| Murrells Inlet: | 92.8 |
| Myrtle Beach: | 152.6 |
| Conway: | 147.9 |
| Moncks Corner: | 313.6 |
| Lake City: | 190.6 |
| Wando: | 18.9 |
| North Myrtle Beach: | 71.6 |
| Mount Pleasant: | 2.8 |
 The median response time based on all reported fire incidents is 6 minutes. This is about the same as the state median value.
The median response time in Georgetown, SC compared to nearest cities:
(Note: Based on data for all years, including only cities with at least 500 fire incidents)
| Georgetown: | 6 minutes |
| Pawleys Island: | 6 minutes |
| Murrells Inlet: | 5 minutes |
| Hemingway: | 10 minutes |
| Myrtle Beach: | 5 minutes |
| Conway: | 7 minutes |
| Kingstree: | 7 minutes |
| Moncks Corner: | 5 minutes |
| Lake City: | 5 minutes |
 According to the reports from the years 2002 - 2018 the average number of fire-related casualties per year is 1. The highest number of injuries - 5 took place in 2004, and the lowest - 0 in 2002. The data has a growing trend.
The average number of injuries per 1,000 fires is 7. This indicator was the highest - 52 in 2004, and the lowest 0 in 2002. The trend for casualties per 1,000 fire incidents is rising. Compared to the South Carolina value the number of casualties per 1,000 fires is about the same.
According to the reports from the years 2002 - 2018 the average number of fire-related casualties per year is 1. The highest number of injuries - 5 took place in 2004, and the lowest - 0 in 2002. The data has a growing trend.
The average number of injuries per 1,000 fires is 7. This indicator was the highest - 52 in 2004, and the lowest 0 in 2002. The trend for casualties per 1,000 fire incidents is rising. Compared to the South Carolina value the number of casualties per 1,000 fires is about the same.Casualties per 1,000 incidents in Georgetown, SC compared to nearest cities:
(Note: Based on data for all years, including only cities with at least 500 fire incidents)
| Georgetown: | 7.2 |
| Pawleys Island: | 4.2 |
| Murrells Inlet: | 2.6 |
| Hemingway: | 2.7 |
| Myrtle Beach: | 21.4 |
| Conway: | 17.3 |
| Kingstree: | 0.6 |
| Moncks Corner: | 3.3 |
| Lake City: | 3.4 |
 29.3% incidents where reported in the morning and 70.7% in the evening. The most fires (16.0%) took place on Friday, and the least (12.2%) on Sunday.
 Based on the 1,944 incident reports from years 2002 - 2018 most fires (15.5%) took place during March, and the least (5.2%) in September.
 Out of all 37,486 cases reported during the years 2002 - 2018, the most belonged to the categories: Rescue & EMS (65.3%), Hazardous Condition (10.8%), and Service Call (9.5%).
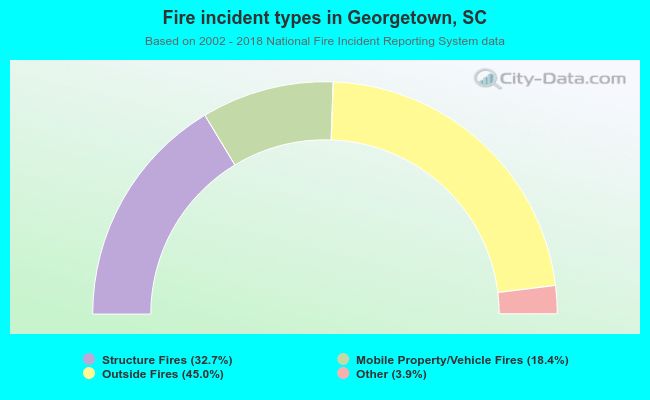 When looking into fire subcategories, the most incidents belonged to: Outside Fires (45.0%), and Structure Fires (32.7%).