Marion: Fire Incidents, South Carolina (SC)
Where are fire incidents reported in Marion, SC
Something went wrong! Please refresh the page.
|
| |||||||||||||||||||||||||||||||||||||||||||||||||||||||||||||||||||||||||||||||||||||||||||||||||||||||||||||
| Other | 189 | |||||||||||||||||||||||||||||||||||||||||||||||||||||||||||||||||||||||||||||||||||||||||||||||||||||||||||||
2004 - 2018 National Fire Incident Reporting System (NFIRS) incidents
- Incident types reported to NFIRS in Marion, SC
- 1,10342.0%Rescue & EMS
- 97937.3%Fire
- 1947.4%Good Intent Call
- 1565.9%Hazardous Condition
- 1064.0%False Alarm
- 592.2%Service Call
- 210.8%Special Incident
- 50.2%Severe Weather
- Fire incident types reported to NFIRS in Marion, SC
- 41942.8%Structure Fires
- 39240.0%Outside Fires
- 16016.3%Mobile Property/Vehicle Fires
- 80.8%Other
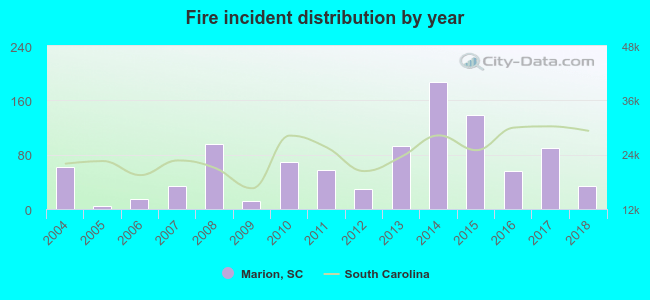 According to the data from the years 2004 - 2018 the average number of fire incidents per year is 65. The highest number of reported fires - 187 took place in 2014, and the least - 5 in 2005. The data has a dropping trend.
The average number of yearly fire incidents per 10k residents in Marion, SC compared to nearest cities:
(Note: Based on data for the last 3 years, including only cities with population 5,000 and above)
| Marion: | 88.9 |
| Dillon: | 6.5 |
| Hamer: | 11.2 |
| Florence: | 126.4 |
| Darlington: | 247.1 |
| Lake City: | 190.6 |
| Conway: | 147.9 |
| Bennettsville: | 181.1 |
| Longs: | 97.8 |
 The median response time based on all reported fire incidents is 6 minutes. This is close to the South Carolina median value.
The median response time in Marion, SC compared to nearest cities:
(Note: Based on data for all years, including only cities with at least 500 fire incidents)
| Marion: | 6 minutes |
| Latta: | 8 minutes |
| Nichols: | 11 minutes |
| Aynor: | 8 minutes |
| Florence: | 6 minutes |
| Rowland: | 12 minutes |
| Fairmont: | 12 minutes |
| Darlington: | 6 minutes |
| Hemingway: | 10 minutes |
 Based on the reports from the years 2004 - 2018 the average number of fire-related fatalities per year is 0. The highest number of deaths - 1 took place in 2007, and the lowest - 0 in 2004. The data has a constant trend.
 30.8% incidents where reported in the morning and 69.2% in the evening. The most fires (16.8%) took place on Friday, and the least (12.5%) on Sunday.
 Based on the 979 fire incident reports from years 2004 - 2018 most fires (12.9%) took place during March, and the least (5.7%) in June.
 Out of all 2,624 cases reported during the years 2004 - 2018, the most belonged to the categories: Rescue & EMS (42.0%), Fire (37.3%), and Good Intent Call (7.4%).
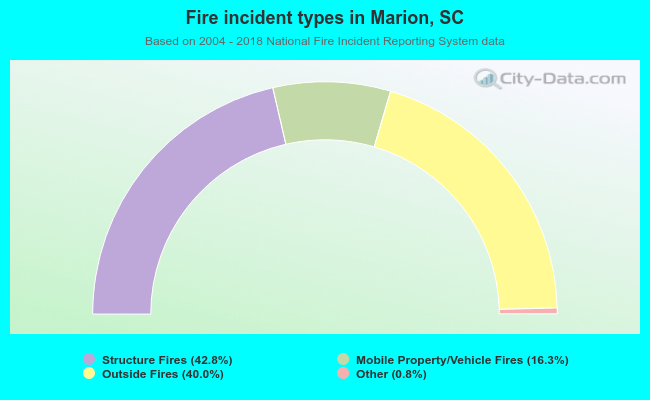 When looking into fire subcategories, the most reports belonged to: Structure Fires (42.8%), and Outside Fires (40.0%).