Monson: Fire Incidents, Massachusetts (MA)
Where are fire incidents reported in Monson, MA
Something went wrong! Please refresh the page.
| Fire incidents reported | |
|---|---|
| Sreet name | Count |
| MAIN ST | 96 |
| PALMER RD | 74 |
| WILBRAHAM RD | 42 |
| BUMSTEAD RD | 40 |
| STAFFORD RD | 38 |
| SILVER ST | 36 |
| STATE AVE | 32 |
| WAID RD | 30 |
| COTE RD | 28 |
| BETHANY RD | 26 |
| BRIMFIELD RD | 26 |
| HOVEY HILL RD | 26 |
| WALES RD | 26 |
| LAKESHORE DR | 22 |
| MARGARET ST | 22 |
| MOULTON HILL RD | 22 |
| BOSTON RD | 20 |
| STATE ST | 20 |
| BUTLER RD | 18 |
| HIGH ST | 18 |
| PECK BROTHERS RD | 16 |
| TOWN FARM RD | 16 |
| BEEBE RD | 14 |
| EAST HILL RD | 14 |
| LOWER HAMPDEN RD | 14 |
| MAXWELL RD | 14 |
| STEBBINS RD | 14 |
| UPPER PALMER RD | 14 |
| BRIDGE ST | 12 |
| CREST RD | 12 |
2002 - 2018 National Fire Incident Reporting System (NFIRS) incidents
- Incident types reported to NFIRS in Monson, MA
- 1,36940.5%Rescue & EMS
- 66419.7%Hazardous Condition
- 65319.3%Fire
- 34210.1%Service Call
- 1955.8%False Alarm
- 1494.4%Good Intent Call
- Fire incident types reported to NFIRS in Monson, MA
- 29745.5%Outside Fires
- 25539.1%Structure Fires
- 7611.6%Mobile Property/Vehicle Fires
- 253.8%Other
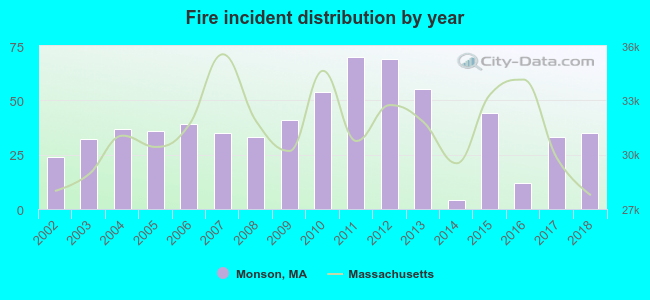 Based on the data from the years 2002 - 2018 the average number of fire incidents per year is 38. The highest number of reported fires - 70 took place in 2011, and the least - 4 in 2014. The data has a growing trend.
The average number of yearly fire incidents per 10k residents in Monson, MA compared to nearest cities:
(Note: Based on data for the last 3 years, including only cities with population 5,000 and above)
| Monson: | 31.2 |
| Hampden: | 92.8 |
| Ludlow: | 30.6 |
| East Longmeadow: | 30.1 |
| Springfield: | 37.6 |
| Ware: | 58.9 |
| Longmeadow: | 20.9 |
| Chicopee: | 33.0 |
| Southbridge: | 40.9 |
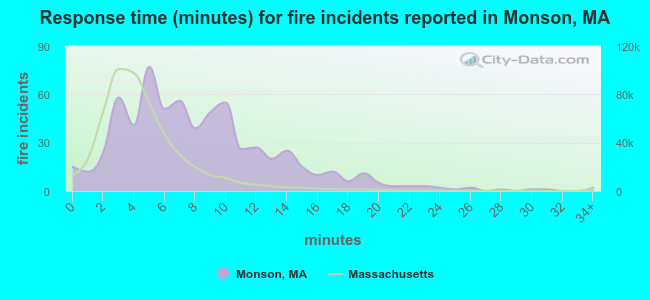 The median response time based on all reported fire incidents is 7 minutes. This is higher than the Massachusetts median value.
The median response time in Monson, MA compared to nearest cities:
(Note: Based on data for all years, including only cities with at least 500 fire incidents)
| Monson: | 7 minutes |
| Palmer: | 7 minutes |
| Wilbraham: | 6 minutes |
| Somers: | 6 minutes |
| Ludlow: | 4 minutes |
| East Longmeadow: | 5 minutes |
| Springfield: | 3 minutes |
| Ware: | 6 minutes |
| Longmeadow: | 6 minutes |
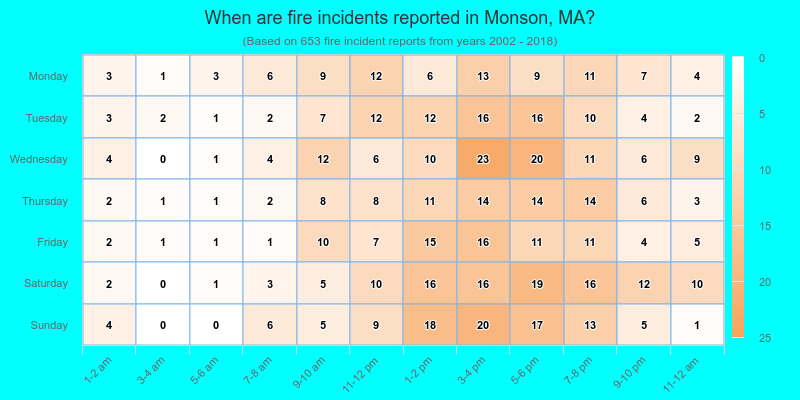
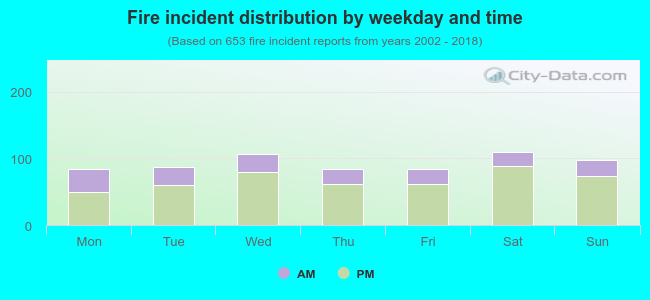 27.1% incidents where reported in the morning and 72.9% in the evening. The most fires (16.8%) took place on Saturday, and the least (12.9%) on Monday.
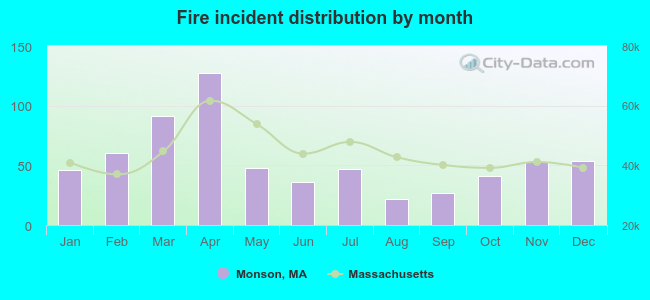 According to the 653 reports from years 2002 - 2018 most fires (19.4%) took place during April, and the least (3.4%) in August.
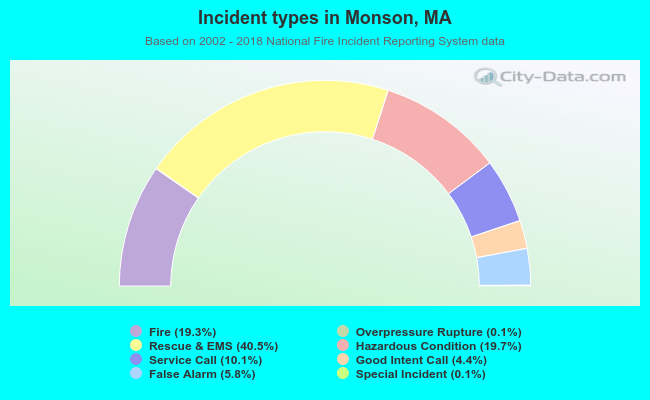 Out of all 3,378 cases reported during the years 2002 - 2018, the most belonged to the categories: Rescue & EMS (40.5%), Hazardous Condition (19.7%), and Fire (19.3%).
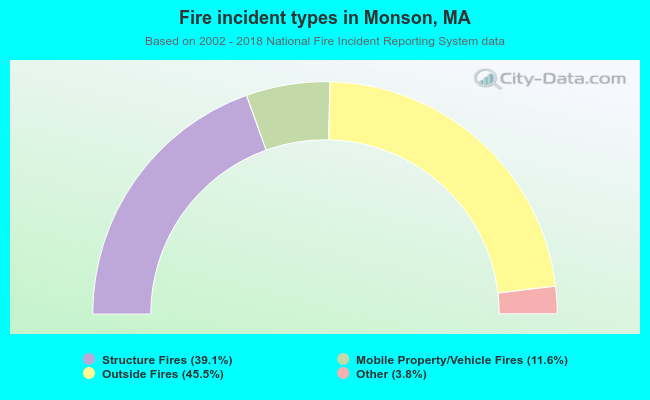 When looking into fire subcategories, the most incidents belonged to: Outside Fires (45.5%), and Structure Fires (39.1%).