Maryville: Fire Incidents, Tennessee (TN)
Where are fire incidents reported in Maryville, TN
Something went wrong! Please refresh the page.
| Fire incidents reported | |
|---|---|
| Sreet name | Count |
| BROADWAY AVE | 418 |
| LAMAR ALEXANDER PKY | 350 |
| SEVIERVILLE RD | 106 |
| CALDERWOOD HWY | 96 |
| MONTVALE RD | 96 |
| OLD KNOXVILLE HWY | 92 |
| FOOTHILLS PLAZA DR | 68 |
| FOOTHILLS MALL DR | 66 |
| BIG SPRINGS RD | 58 |
| MORGANTON RD | 58 |
| OLD NILES FERRY RD | 56 |
| WILDWOOD RD | 54 |
| HARPER AVE | 52 |
| US HWY 411 | 46 |
| WASHINGTON ST | 44 |
| EVERETT HIGH RD | 40 |
| BROWN SCHOOL RD | 38 |
| ATCHLEY DR | 36 |
| SIX MILE RD | 36 |
| GRANT TOWNHOUSE DR | 32 |
| MCGHEE ST | 32 |
| TUCKALEECHEE PIKE | 32 |
| WATKINS RD | 32 |
| DOC NORTON RD | 30 |
| OLD GLORY RD | 28 |
| US 129 HWY | 28 |
| WILKINSON PIKE | 28 |
| FOOTHILLS MALL | 26 |
| MIDDLESETTLEMENTS RD | 26 |
| MINT RD | 26 |
| Other | 1,115 |
2002 - 2018 National Fire Incident Reporting System (NFIRS) incidents
- Incident types reported to NFIRS in Maryville, TN
- 14,07950.0%Rescue & EMS
- 3,25911.6%Service Call
- 3,24511.5%Fire
- 2,96610.5%Hazardous Condition
- 2,5249.0%False Alarm
- 1,9526.9%Good Intent Call
- 420.1%Overpressure Rupture
- 330.1%Special Incident
- 320.1%Severe Weather
- Fire incident types reported to NFIRS in Maryville, TN
- 1,40443.3%Outside Fires
- 1,15735.7%Structure Fires
- 56017.3%Mobile Property/Vehicle Fires
- 1243.8%Other
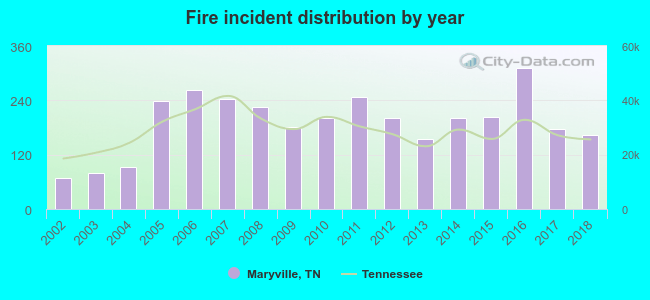 Based on the data from the years 2002 - 2018 the average number of fires per year is 191. The highest number of fire incidents - 311 took place in 2016, and the least - 68 in 2002. The data has a rising trend.
The average number of yearly fire incidents per 10k residents in Maryville, TN compared to nearest cities:
(Note: Based on data for the last 3 years, including only cities with population 5,000 and above)
| Maryville: | 76.7 |
| Alcoa: | 64.4 |
| Seymour: | 67.2 |
| Knoxville: | 70.0 |
| Lenoir City: | 111.8 |
| Powell: | 21.2 |
| Loudon: | 166.2 |
| Pigeon Forge: | 125.0 |
| Oak Ridge: | 29.8 |
 The median response time based on all reported fire incidents is 6 minutes. This is about the same as the Tennessee median value.
The median response time in Maryville, TN compared to nearest cities:
(Note: Based on data for all years, including only cities with at least 500 fire incidents)
| Maryville: | 6 minutes |
| Alcoa: | 4 minutes |
| Seymour: | 8 minutes |
| Knoxville: | 5 minutes |
| Lenoir City: | 6 minutes |
| Vonore: | 7 minutes |
| Powell: | 8 minutes |
| Loudon: | 7 minutes |
| Pigeon Forge: | 8 minutes |
 Based on the data from the years 2002 - 2018 the average number of fire-related fatalities per year is 1. The highest number of deaths - 2 took place in 2007, and the lowest - 0 in 2003. The data has a constant trend.
The average number of deaths per 1,000 fire incidents is 3. This indicator was the highest - 15 in 2002, and the lowest 0 in 2003. The trend for deaths per 1,000 fire incidents is declining. Compared to the state value the number of fatalities per 1,000 incidents is lower.
Based on the data from the years 2002 - 2018 the average number of fire-related fatalities per year is 1. The highest number of deaths - 2 took place in 2007, and the lowest - 0 in 2003. The data has a constant trend.
The average number of deaths per 1,000 fire incidents is 3. This indicator was the highest - 15 in 2002, and the lowest 0 in 2003. The trend for deaths per 1,000 fire incidents is declining. Compared to the state value the number of fatalities per 1,000 incidents is lower.Deaths per 1,000 incidents in Maryville, TN compared to nearest cities:
(Note: Based on data for all years, including only cities with at least 2,500 fire incidents)
| Maryville: | 2.8 |
| Knoxville: | 2.1 |
| Sevierville: | 2.7 |
| Gatlinburg: | 5.2 |
| Harriman: | 2.8 |
| Athens: | 4.4 |
 According to the data from the years 2002 - 2018 the average number of fire-related casualties per year is 11. The highest number of casualties - 154 took place in 2015, and the lowest - 0 in 2002. The data has an increasing trend.
The average number of injuries per 1,000 fires is 53. This indicator was the highest - 759 in 2015, and the lowest 0 in 2002. The trend for casualties per 1,000 fires is growing. Compared to the Tennessee value the number of injuries per 1,000 fires is much higher.
According to the data from the years 2002 - 2018 the average number of fire-related casualties per year is 11. The highest number of casualties - 154 took place in 2015, and the lowest - 0 in 2002. The data has an increasing trend.
The average number of injuries per 1,000 fires is 53. This indicator was the highest - 759 in 2015, and the lowest 0 in 2002. The trend for casualties per 1,000 fires is growing. Compared to the Tennessee value the number of injuries per 1,000 fires is much higher.Casualties per 1,000 incidents in Maryville, TN compared to nearest cities:
(Note: Based on data for all years, including only cities with at least 500 fire incidents)
| Maryville: | 56.1 |
| Alcoa: | 3.9 |
| Seymour: | 10.4 |
| Knoxville: | 8.2 |
| Lenoir City: | 3.0 |
| Vonore: | 1.4 |
| Powell: | 12.5 |
| Loudon: | 1.9 |
| Pigeon Forge: | 6.8 |
 29.6% incidents where reported in the morning and 70.4% in the evening. The most fires (15.3%) took place on Saturday, and the least (13.2%) on Sunday.
 Based on the 3,245 fire incident reports from years 2002 - 2018 most fires (9.7%) took place during March, and the least (7.1%) in December.
 Out of all 28,132 cases reported during the years 2002 - 2018, the most belonged to the categories: Rescue & EMS (50.0%), Service Call (11.6%), and Fire (11.5%).
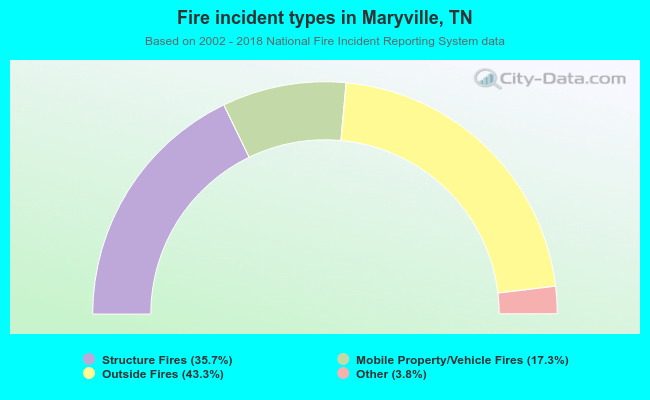 When looking into fire subcategories, the most reports belonged to: Outside Fires (43.3%), and Structure Fires (35.7%).