Oak Ridge: Fire Incidents, Tennessee (TN)
Where are fire incidents reported in Oak Ridge, TN
Something went wrong! Please refresh the page.
| Fire incidents reported | |
|---|---|
| Sreet name | Count |
| TURNPIKE TPKE | 292 |
| ILLINOIS AVE | 272 |
| OUTER DR | 162 |
| PURDUE AVE | 68 |
| ROBERTSVILLE RD | 66 |
| OAK RIDGE TPKE | 64 |
| UTICA CIR | 54 |
| EMORY VALLEY RD | 50 |
| HILLSIDE RD | 48 |
| BRIARCLIFF AVE | 46 |
| JEFFERSON AVE | 40 |
| BENEDICT AVE | 36 |
| TENNESSEE AVE | 36 |
| LABORATORY RD | 34 |
| NEW YORK AVE | 34 |
| FAIRBANKS RD | 32 |
| VERMONT AVE | 32 |
| MAIN ST | 30 |
| VANDERBILT DR | 28 |
| ROYCE CIR | 26 |
| TUSKEGEE DR | 26 |
| EAST DR | 24 |
| HWY 58 | 24 |
| RUTGERS AVE | 24 |
| EDGEMOOR RD | 22 |
| LATIMER RD | 20 |
| PENNSYLVANIA AVE | 20 |
| 58 HWY | 18 |
| HUNTER CIR | 18 |
| ROLLING LINKS BLVD | 18 |
| Other | 46 |
2002 - 2018 National Fire Incident Reporting System (NFIRS) incidents
- Incident types reported to NFIRS in Oak Ridge, TN
- 12,80454.1%Rescue & EMS
- 3,29313.9%Service Call
- 2,81811.9%False Alarm
- 1,7107.2%Fire
- 1,4496.1%Hazardous Condition
- 1,4216.0%Good Intent Call
- 790.3%Special Incident
- 470.2%Severe Weather
- 330.1%Overpressure Rupture
- Fire incident types reported to NFIRS in Oak Ridge, TN
- 72542.4%Outside Fires
- 56332.9%Structure Fires
- 34820.4%Mobile Property/Vehicle Fires
- 744.3%Other
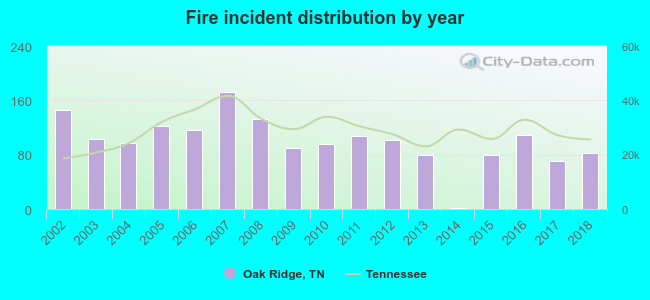 Based on the data from the years 2002 - 2018 the average number of fires per year is 101. The highest number of reported fires - 173 took place in 2007, and the least - 1 in 2014. The data has a decreasing trend.
The average number of yearly fire incidents per 10k residents in Oak Ridge, TN compared to nearest cities:
(Note: Based on data for the last 3 years, including only cities with population 5,000 and above)
| Oak Ridge: | 29.8 |
| Clinton: | 105.5 |
| Lenoir City: | 111.8 |
| Kingston: | 160.5 |
| Powell: | 21.2 |
| Harriman: | 267.5 |
| Loudon: | 166.2 |
| Knoxville: | 70.0 |
| Alcoa: | 64.4 |
 The median response time based on all reported fire incidents is 4 minutes. This is lower than the state median value.
The median response time in Oak Ridge, TN compared to nearest cities:
(Note: Based on data for all years, including only cities with at least 500 fire incidents)
| Oak Ridge: | 4 minutes |
| Oliver Springs: | 10 minutes |
| Clinton: | 5 minutes |
| Lenoir City: | 6 minutes |
| Kingston: | 9 minutes |
| Powell: | 8 minutes |
| Harriman: | 8 minutes |
| Loudon: | 7 minutes |
| Knoxville: | 5 minutes |
 According to the data from the years 2002 - 2018 the average number of fire-related fatalities per year is 0. The highest number of reported deaths - 1 took place in 2002, and the lowest - 0 in 2003. The data has a declining trend.
 Based on the data from the years 2002 - 2018 the average number of fire-related yearly casualties is 2. The highest number of injuries - 4 took place in 2002, and the lowest - 0 in 2006. The data has a decreasing trend.
The average number of injuries per 1,000 fires is 17. This indicator was the highest - 42 in 2017, and the lowest 0 in 2006. The trend for casualties per 1,000 incidents is decreasing. Compared to the state value the number of injuries per 1,000 fire incidents is much higher.
Based on the data from the years 2002 - 2018 the average number of fire-related yearly casualties is 2. The highest number of injuries - 4 took place in 2002, and the lowest - 0 in 2006. The data has a decreasing trend.
The average number of injuries per 1,000 fires is 17. This indicator was the highest - 42 in 2017, and the lowest 0 in 2006. The trend for casualties per 1,000 incidents is decreasing. Compared to the state value the number of injuries per 1,000 fire incidents is much higher.Casualties per 1,000 incidents in Oak Ridge, TN compared to nearest cities:
(Note: Based on data for all years, including only cities with at least 500 fire incidents)
| Oak Ridge: | 16.4 |
| Oliver Springs: | 8.2 |
| Clinton: | 5.0 |
| Lenoir City: | 3.0 |
| Kingston: | 0.0 |
| Powell: | 12.5 |
| Harriman: | 2.8 |
| Loudon: | 1.9 |
| Knoxville: | 8.2 |
 28.2% incidents where reported in the morning and 71.8% in the evening. The most fires (16.0%) took place on Saturday, and the least (12.2%) on Sunday.
 According to the 1,710 incident reports from years 2002 - 2018 most fires (11.0%) took place during March, and the least (6.5%) in September.
 Out of all 23,654 cases reported during the years 2002 - 2018, the most belonged to the categories: Rescue & EMS (54.1%), Service Call (13.9%), and False Alarm (11.9%).
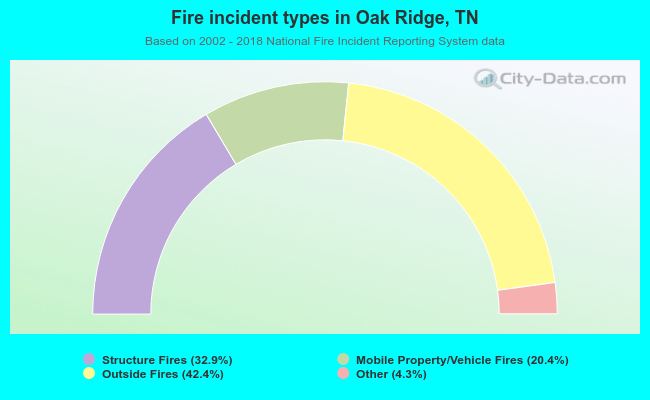 When looking into fire subcategories, the most reports belonged to: Outside Fires (42.4%), and Structure Fires (32.9%).