Lenoir City: Fire Incidents, Tennessee (TN)
Where are fire incidents reported in Lenoir City, TN
Something went wrong! Please refresh the page.
| Fire incidents reported | |
|---|---|
| Sreet name | Count |
| HIGHWAY 321 | 404 |
| BROADWAY | 94 |
| HIGHWAY 11 HWY | 92 |
| INTERSTATE 75 | 84 |
| INTERSTATE 75 HWY | 68 |
| US HIGHWAY 321 | 56 |
| 321 HWY | 54 |
| BEALS CHAPEL RD | 52 |
| HIGHWAY 321 HWY | 50 |
| BROWDER HOLLOW RD | 48 |
| KELLY LN | 44 |
| TOWN CREEK RD | 44 |
| HOTCHKISS VALLEY RD | 42 |
| HIGHWAY 70 HWY | 40 |
| HINES VALLEY RD | 40 |
| I-75 | 40 |
| INTERSTATE 40 HWY | 36 |
| MARTEL RD | 36 |
| WHITE WING RD | 36 |
| BUTTERMILK RD | 34 |
| CITY PARK DR | 34 |
| MARKET DR | 34 |
| HIGHWAY 11 | 32 |
| SIMPSON RD | 32 |
| HIGHLAND AVE | 30 |
| A ST | 28 |
| VIRTUE RD | 28 |
| MYERS RD | 22 |
| OLD HIGHWAY 95 | 22 |
| C ST | 20 |
| Other | 299 |
2002 - 2018 National Fire Incident Reporting System (NFIRS) incidents
- Incident types reported to NFIRS in Lenoir City, TN
- 5,06244.1%Rescue & EMS
- 1,97517.2%Fire
- 1,48412.9%Service Call
- 1,20910.5%Good Intent Call
- 8377.3%False Alarm
- 8257.2%Hazardous Condition
- 300.3%Overpressure Rupture
- 280.2%Special Incident
- 190.2%Severe Weather
- Fire incident types reported to NFIRS in Lenoir City, TN
- 97049.1%Outside Fires
- 51025.8%Structure Fires
- 41320.9%Mobile Property/Vehicle Fires
- 824.2%Other
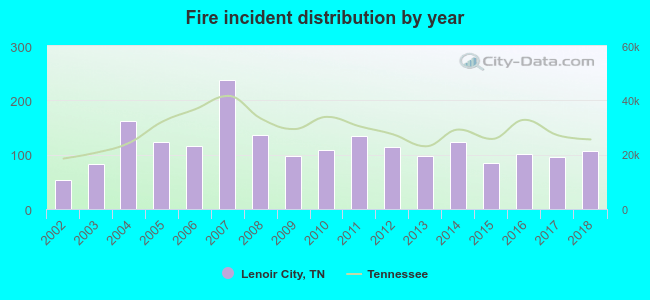 According to the data from the years 2002 - 2018 the average number of fire incidents per year is 116. The highest number of fires - 238 took place in 2007, and the least - 53 in 2002. The data has a rising trend.
The average number of yearly fire incidents per 10k residents in Lenoir City, TN compared to nearest cities:
(Note: Based on data for the last 3 years, including only cities with population 5,000 and above)
| Lenoir City: | 111.8 |
| Loudon: | 166.2 |
| Oak Ridge: | 29.8 |
| Kingston: | 160.5 |
| Alcoa: | 64.4 |
| Maryville: | 76.7 |
| Sweetwater: | 189.0 |
| Harriman: | 267.5 |
| Powell: | 21.2 |
 The median response time based on all reported fire incidents is 6 minutes. This is about the same as the Tennessee median value.
The median response time in Lenoir City, TN compared to nearest cities:
(Note: Based on data for all years, including only cities with at least 500 fire incidents)
| Lenoir City: | 6 minutes |
| Loudon: | 7 minutes |
| Oak Ridge: | 4 minutes |
| Kingston: | 9 minutes |
| Vonore: | 7 minutes |
| Alcoa: | 4 minutes |
| Maryville: | 6 minutes |
| Oliver Springs: | 10 minutes |
| Sweetwater: | 11 minutes |
 Based on the reports from the years 2002 - 2018 the average number of fire-related fatalities per year is 0. The highest number of deaths - 1 took place in 2002, and the lowest - 0 in 2003. The data has a constant trend.
 27.3% incidents where reported in the morning and 72.7% in the evening. The most fires (15.8%) took place on Saturday, and the least (13.5%) on Sunday.
 According to the 1,975 incident reports from years 2002 - 2018 most fires (11.3%) took place during March, and the least (6.5%) in September.
 Out of all 11,469 cases reported during the years 2002 - 2018, the most belonged to the categories: Rescue & EMS (44.1%), Fire (17.2%), and Service Call (12.9%).
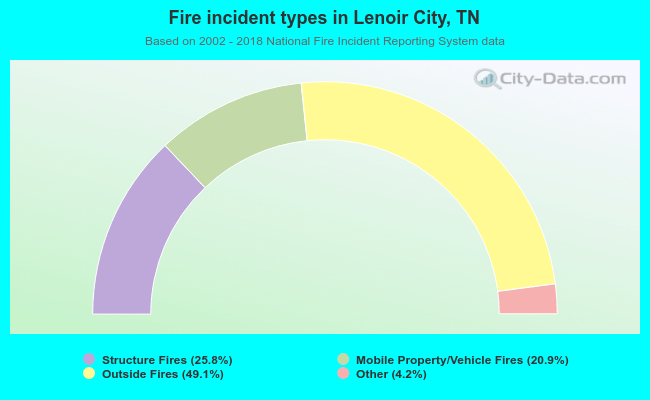 When looking into fire subcategories, the most reports belonged to: Outside Fires (49.1%), and Structure Fires (25.8%).