Marysville: Fire Incidents, Ohio (OH)
Where are fire incidents reported in Marysville, OH
Something went wrong! Please refresh the page.
| Fire incidents reported | |
|---|---|
| Sreet name | Count |
| 5TH ST | 140 |
| COLLINS AVE | 124 |
| US ROUTE 36 | 124 |
| MAIN ST | 86 |
| WATKINS RD | 82 |
| MAPLE ST | 76 |
| STATE ROUTE 4 | 76 |
| INDUSTRIAL PKY | 62 |
| 6TH ST | 54 |
| PAVER BARNES RD | 54 |
| LONDON AVE | 50 |
| MILFORD AVE | 48 |
| RAYMOND RD | 46 |
| ALLENBY DR | 44 |
| HONDA PKY | 44 |
| MEADOWS DR | 44 |
| 3RD ST | 42 |
| DELAWARE AVE | 42 |
| SR 245 RT | 42 |
| STATE ROUTE 31 | 42 |
| SCOTTSLAWN RD | 40 |
| 8TH ST | 36 |
| HOLYCROSS EPPS RD | 36 |
| NORTHWEST PKY | 36 |
| ALLEN CENTER RD | 34 |
| BEAR SWAMP RD | 34 |
| COLUMBUS AVE | 34 |
| 4TH ST | 32 |
| USR 33 | 32 |
| WALNUT ST | 32 |
| Other | 731 |
2002 - 2018 National Fire Incident Reporting System (NFIRS) incidents
- Incident types reported to NFIRS in Marysville, OH
- 2,39930.7%Fire
- 1,44318.5%Rescue & EMS
- 1,25516.1%Good Intent Call
- 1,05913.5%Hazardous Condition
- 91311.7%False Alarm
- 6938.9%Service Call
- 200.3%Special Incident
- 190.2%Overpressure Rupture
- 150.2%Severe Weather
- Fire incident types reported to NFIRS in Marysville, OH
- 1,41959.1%Structure Fires
- 66527.7%Outside Fires
- 30912.9%Mobile Property/Vehicle Fires
- 60.3%Other
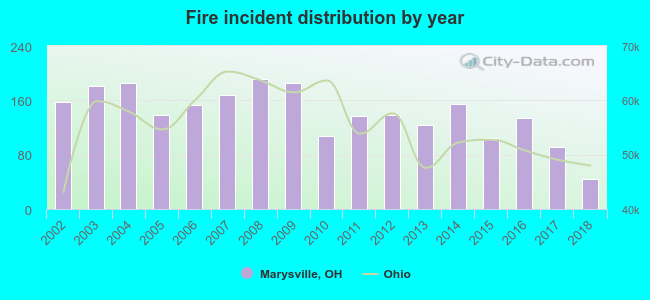 Based on the data from the years 2002 - 2018 the average number of fires per year is 141. The highest number of reported fire incidents - 192 took place in 2008, and the least - 44 in 2018. The data has a decreasing trend.
The average number of yearly fire incidents per 10k residents in Marysville, OH compared to nearest cities:
(Note: Based on data for the last 3 years, including only cities with population 5,000 and above)
| Marysville: | 39.6 |
| Dublin: | 22.9 |
| Delaware: | 54.3 |
| Powell: | 33.0 |
| Hilliard: | 26.7 |
| Worthington: | 24.6 |
| Upper Arlington: | 17.7 |
| Urbana: | 68.3 |
| Bellefontaine: | 44.8 |
 The median response time based on all reported fire incidents is 8 minutes. This is higher compared to the Ohio median value.
The median response time in Marysville, OH compared to nearest cities:
(Note: Based on data for all years, including only cities with at least 500 fire incidents)
| Marysville: | 8 minutes |
| Plain City: | 8 minutes |
| Richwood: | 9 minutes |
| Dublin: | 5 minutes |
| Mechanicsburg: | 9 minutes |
| Delaware: | 7 minutes |
| Powell: | 6 minutes |
| Hilliard: | 6 minutes |
| West Jefferson: | 8 minutes |
 According to the reports from the years 2002 - 2018 the average number of fire-related casualties per year is 1. The highest number of reported casualties - 3 took place in 2002, and the lowest - 0 in 2004. The data has a decreasing trend.
The average number of injuries per 1,000 fire incidents is 7. This indicator was the highest - 23 in 2018, and the lowest 0 in 2004. The trend for casualties per 1,000 fire incidents is increasing. Compared to the state value the number of casualties per 1,000 fire incidents is much lower.
According to the reports from the years 2002 - 2018 the average number of fire-related casualties per year is 1. The highest number of reported casualties - 3 took place in 2002, and the lowest - 0 in 2004. The data has a decreasing trend.
The average number of injuries per 1,000 fire incidents is 7. This indicator was the highest - 23 in 2018, and the lowest 0 in 2004. The trend for casualties per 1,000 fire incidents is increasing. Compared to the state value the number of casualties per 1,000 fire incidents is much lower.Casualties per 1,000 incidents in Marysville, OH compared to nearest cities:
(Note: Based on data for all years, including only cities with at least 500 fire incidents)
| Marysville: | 6.3 |
| Plain City: | 5.5 |
| Richwood: | 18.7 |
| Dublin: | 2.4 |
| Mechanicsburg: | 9.5 |
| Delaware: | 16.5 |
| Powell: | 11.1 |
| Hilliard: | 12.7 |
| West Jefferson: | 9.7 |
 31.5% incidents where reported in the morning and 68.5% in the evening. The most fires (15.9%) took place on Tuesday, and the least (12.5%) on Thursday.
 Based on the 2,399 fires from years 2002 - 2018 most fires (11.7%) took place during March, and the least (6.5%) in December.
 Out of all 7,816 cases reported during the years 2002 - 2018, the most belonged to the categories: Fire (30.7%), Rescue & EMS (18.5%), and Good Intent Call (16.1%).
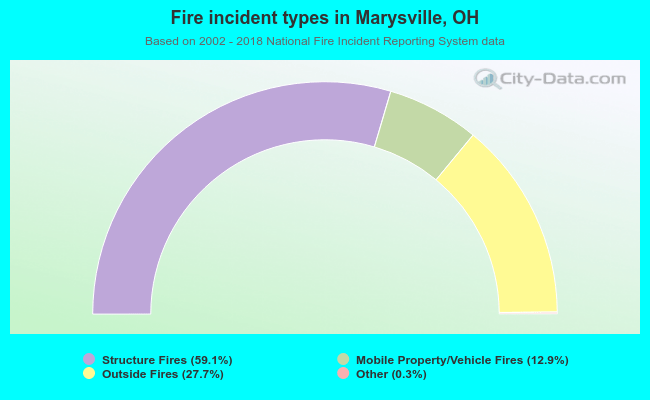 When looking into fire subcategories, the most incidents belonged to: Structure Fires (59.1%), and Outside Fires (27.7%).