Urbana: Fire Incidents, Ohio (OH)
Where are fire incidents reported in Urbana, OH
Something went wrong! Please refresh the page.
| Fire incidents reported | |
|---|---|
| Sreet name | Count |
| MAIN ST | 148 |
| US 36 HWY | 148 |
| US 68 HWY | 100 |
| SCIOTO ST | 98 |
| WARD ST | 74 |
| MIAMI ST | 66 |
| CHURCH ST | 64 |
| COURT ST | 58 |
| MUZZY LAKE RD | 58 |
| SPRINGFIELD-URBANA PIKE | 58 |
| DALLAS RD | 56 |
| ST RT 29 | 56 |
| ST RT 54 | 50 |
| HICKORY GROVE RD | 48 |
| ST RT 55 | 46 |
| DUGAN RD | 44 |
| EDGEWOOD AVE | 42 |
| LIGHT ST | 42 |
| RUSSELL ST | 42 |
| MOSGROVE ST | 40 |
| COLLEGE WAY | 38 |
| GWYNNE ST | 38 |
| JACKSON HILL RD | 38 |
| LOUDEN ST | 36 |
| WASHINGTON AVE | 36 |
| WATER ST | 36 |
| COUNTY LINE RD | 34 |
| PARK AVE | 34 |
| KENNARD KINGSCREEK RD | 32 |
| HIGH ST | 30 |
| Other | 165 |
2002 - 2018 National Fire Incident Reporting System (NFIRS) incidents
- Incident types reported to NFIRS in Urbana, OH
- 11,80268.4%Rescue & EMS
- 1,85510.8%Fire
- 1,4958.7%Hazardous Condition
- 1,2077.0%Good Intent Call
- 4492.6%False Alarm
- 3802.2%Service Call
- 220.1%Overpressure Rupture
- 200.1%Severe Weather
- Fire incident types reported to NFIRS in Urbana, OH
- 90048.5%Structure Fires
- 73139.4%Outside Fires
- 21211.4%Mobile Property/Vehicle Fires
- 120.6%Other
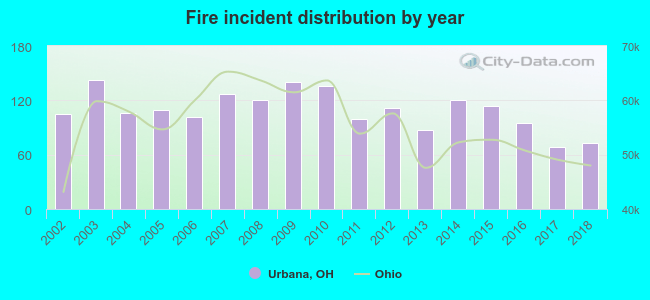 Based on the data from the years 2002 - 2018 the average number of fires per year is 109. The highest number of reported fires - 143 took place in 2003, and the least - 68 in 2017. The data has a decreasing trend.
The average number of yearly fire incidents per 10k residents in Urbana, OH compared to nearest cities:
(Note: Based on data for the last 3 years, including only cities with population 5,000 and above)
| Urbana: | 68.3 |
| Springfield: | 71.8 |
| Bellefontaine: | 44.8 |
| New Carlisle: | 93.9 |
| Marysville: | 39.6 |
| London: | 73.6 |
| Troy: | 30.9 |
| Sidney: | 71.9 |
| Tipp City: | 55.5 |
 The median response time based on all reported fire incidents is 8 minutes. This is higher compared to the Ohio median value.
The median response time in Urbana, OH compared to nearest cities:
(Note: Based on data for all years, including only cities with at least 500 fire incidents)
| Urbana: | 8 minutes |
| West Liberty: | 9 minutes |
| Mechanicsburg: | 9 minutes |
| Springfield: | 6 minutes |
| Bellefontaine: | 6 minutes |
| New Carlisle: | 8 minutes |
| South Charleston: | 14 minutes |
| Marysville: | 8 minutes |
| London: | 8 minutes |
 According to the data from the years 2002 - 2018 the average number of fire-related yearly casualties is 2. The highest number of injuries - 6 took place in 2002, and the lowest - 0 in 2007. The data has a decreasing trend.
The average number of injuries per 1,000 fire incidents is 22. This indicator was the highest - 57 in 2002, and the lowest 0 in 2007. The trend for injuries per 1,000 fires is decreasing. Compared to the state value the number of casualties per 1,000 fires is higher.
According to the data from the years 2002 - 2018 the average number of fire-related yearly casualties is 2. The highest number of injuries - 6 took place in 2002, and the lowest - 0 in 2007. The data has a decreasing trend.
The average number of injuries per 1,000 fire incidents is 22. This indicator was the highest - 57 in 2002, and the lowest 0 in 2007. The trend for injuries per 1,000 fires is decreasing. Compared to the state value the number of casualties per 1,000 fires is higher.Casualties per 1,000 incidents in Urbana, OH compared to nearest cities:
(Note: Based on data for all years, including only cities with at least 500 fire incidents)
| Urbana: | 21.0 |
| West Liberty: | 0.0 |
| Mechanicsburg: | 9.5 |
| Springfield: | 18.9 |
| Bellefontaine: | 27.9 |
| New Carlisle: | 4.3 |
| South Charleston: | 1.8 |
| Marysville: | 6.3 |
| London: | 5.0 |
 29.3% incidents where reported in the morning and 70.7% in the evening. The most fires (15.5%) took place on Friday, and the least (12.9%) on Wednesday.
 Based on the 1,855 incident reports from years 2002 - 2018 most fires (9.7%) took place during March, and the least (6.1%) in February.
 Out of all 17,243 cases reported during the years 2002 - 2018, the most belonged to the categories: Rescue & EMS (68.4%), Fire (10.8%), and Hazardous Condition (8.7%).
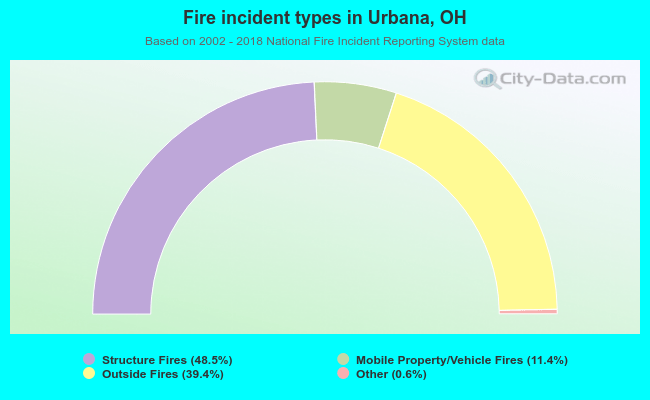 When looking into fire subcategories, the most reports belonged to: Structure Fires (48.5%), and Outside Fires (39.4%).