Maple Grove: Fire Incidents, Minnesota (MN)
Where are fire incidents reported in Maple Grove, MN
Something went wrong! Please refresh the page.
| Fire incidents reported | |
|---|---|
| Sreet name | Count |
| I94 | 116 |
| ELM CREEK BLVD | 92 |
| BASS LAKE RD | 60 |
| GROVE DR | 50 |
| 96TH AVE N | 44 |
| DUNKIRK LA N | 42 |
| MAIN ST N | 38 |
| CO RD NO 81 | 36 |
| EAST FISH LAKE RD | 36 |
| 95TH AVE N | 34 |
| JEFFERSON HWY | 34 |
| WEAVER LAKE RD N | 34 |
| HEMLOCK LA N | 30 |
| COUNTY RD 30 | 28 |
| MAGDA DR | 28 |
| MAPLE KNOLL WY | 28 |
| 96TH AV | 26 |
| WEDGEWOOD LA N | 26 |
| 91ST AVE N | 24 |
| CO RD NO 30 | 24 |
| ELM CREEK BL | 24 |
| SYCAMORE LA N | 24 |
| ZACHARY LA N | 24 |
| 69TH AVE N | 22 |
| FOUNTAINS DR | 22 |
| IVES LA N | 22 |
| TROY LA N | 22 |
| VINEWOOD LA N | 22 |
| 101ST AVE N | 20 |
| 73RD AVE N | 20 |
| Other | 642 |
2002 - 2018 National Fire Incident Reporting System (NFIRS) incidents
- Incident types reported to NFIRS in Maple Grove, MN
- 1,85922.7%Hazardous Condition
- 1,71821.0%False Alarm
- 1,69420.7%Fire
- 1,61619.8%Service Call
- 93811.5%Good Intent Call
- 3073.8%Rescue & EMS
- 380.5%Severe Weather
- Fire incident types reported to NFIRS in Maple Grove, MN
- 78846.5%Structure Fires
- 49929.5%Outside Fires
- 37822.3%Mobile Property/Vehicle Fires
- 291.7%Other
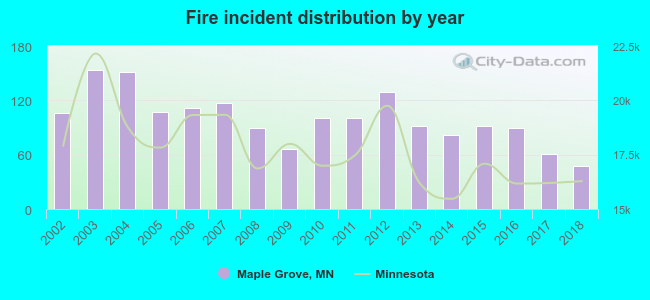 According to the data from the years 2002 - 2018 the average number of fire incidents per year is 100. The highest number of reported fires - 153 took place in 2003, and the least - 48 in 2018. The data has a dropping trend.
The average number of yearly fire incidents per 10k residents in Maple Grove, MN compared to nearest cities:
(Note: Based on data for the last 3 years, including only cities with population 5,000 and above)
| Maple Grove: | 9.9 |
| Brooklyn Park: | 30.2 |
| Champlin: | 12.0 |
| Corcoran: | 35.0 |
| New Hope: | 25.3 |
| Plymouth: | 26.9 |
| Crystal: | 21.8 |
| Anoka: | 32.2 |
| Brooklyn Center: | 38.6 |
 The median response time based on all reported fire incidents is 7 minutes. This is similar to the state median value.
The median response time in Maple Grove, MN compared to nearest cities:
(Note: Based on data for all years, including only cities with at least 500 fire incidents)
| Maple Grove: | 7 minutes |
| Brooklyn Park: | 5 minutes |
| Champlin: | 9 minutes |
| New Hope: | 5 minutes |
| Plymouth: | 8 minutes |
| Crystal: | 5 minutes |
| Anoka: | 6 minutes |
| Brooklyn Center: | 6 minutes |
| Rogers: | 7 minutes |
 According to the data from the years 2002 - 2018 the average number of fire-related yearly casualties is 3. The highest number of injuries - 31 took place in 2011, and the lowest - 0 in 2005. The data has a dropping trend.
The average number of casualties per 1,000 fire incidents is 25. This indicator was the highest - 310 in 2011, and the lowest 0 in 2005. The trend for casualties per 1,000 fires is decreasing. Compared to the Minnesota value the number of casualties per 1,000 fire incidents is much higher.
According to the data from the years 2002 - 2018 the average number of fire-related yearly casualties is 3. The highest number of injuries - 31 took place in 2011, and the lowest - 0 in 2005. The data has a dropping trend.
The average number of casualties per 1,000 fire incidents is 25. This indicator was the highest - 310 in 2011, and the lowest 0 in 2005. The trend for casualties per 1,000 fires is decreasing. Compared to the Minnesota value the number of casualties per 1,000 fire incidents is much higher.Casualties per 1,000 incidents in Maple Grove, MN compared to nearest cities:
(Note: Based on data for all years, including only cities with at least 500 fire incidents)
| Maple Grove: | 26.0 |
| Brooklyn Park: | 11.2 |
| Champlin: | 1.9 |
| New Hope: | 11.0 |
| Plymouth: | 18.6 |
| Crystal: | 13.1 |
| Anoka: | 2.1 |
| Brooklyn Center: | 6.3 |
| Rogers: | 0.0 |
 29.1% incidents where reported in the morning and 70.9% in the evening. The most fires (15.8%) took place on Friday, and the least (11.7%) on Wednesday.
 Based on the 1,694 fires from years 2002 - 2018 most fires (10.7%) took place during July, and the least (5.4%) in March.
 Out of all 8,178 cases reported during the years 2002 - 2018, the most belonged to the categories: Hazardous Condition (22.7%), False Alarm (21.0%), and Fire (20.7%).
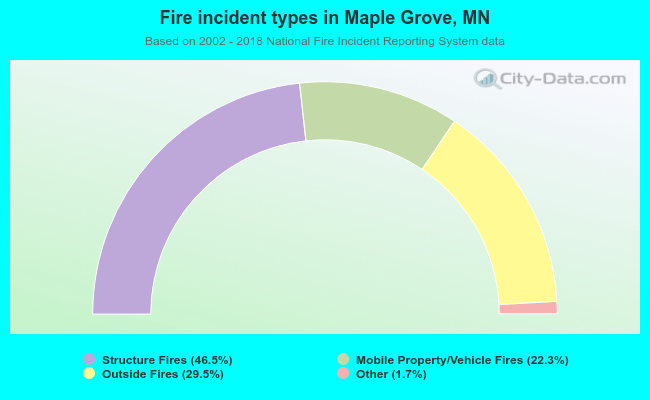 When looking into fire subcategories, the most reports belonged to: Structure Fires (46.5%), and Outside Fires (29.5%).