Anoka: Fire Incidents, Minnesota (MN)
Where are fire incidents reported in Anoka, MN
Something went wrong! Please refresh the page.
| Fire incidents reported | |
|---|---|
| Sreet name | Count |
| FERRY ST | 122 |
| 7 AVE | 120 |
| MAIN ST | 104 |
| 6 AVE | 70 |
| 4 AVE | 52 |
| BOB EHLEN DR | 42 |
| HWY 10 | 40 |
| ST FRANCIS BLVD | 40 |
| CUTTERS GROVE AVE | 36 |
| NORTH ST | 36 |
| 5 AVE | 34 |
| 9 LA | 34 |
| MONROE ST | 30 |
| 7TH AVE | 28 |
| HARRISON ST | 28 |
| EUCLID AVE | 26 |
| SUNNY LA | 26 |
| 9 AVE | 24 |
| HOFFMAN WAY | 24 |
| FAIROAK AVE | 22 |
| GARFIELD ST | 22 |
| LUND BLVD | 22 |
| 3 AVE | 20 |
| JACKSON ST | 20 |
| MADISON ST | 20 |
| MCKINLEY ST | 20 |
| ROOSEVELT ST | 20 |
| 11 AVE | 18 |
| EAST RIVER RD | 16 |
| GREENHAVEN RD | 16 |
2002 - 2018 National Fire Incident Reporting System (NFIRS) incidents
- Incident types reported to NFIRS in Anoka, MN
- 1,68934.3%Hazardous Condition
- 94319.1%Fire
- 90918.4%Service Call
- 65313.2%False Alarm
- 55211.2%Good Intent Call
- 1743.5%Rescue & EMS
- 50.1%Special Incident
- Fire incident types reported to NFIRS in Anoka, MN
- 42745.3%Structure Fires
- 29731.5%Outside Fires
- 19821.0%Mobile Property/Vehicle Fires
- 212.2%Other
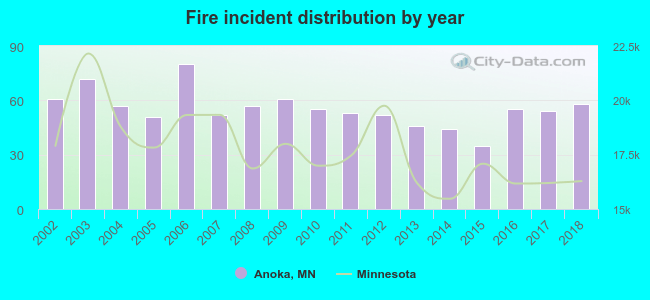 According to the data from the years 2002 - 2018 the average number of fires per year is 55. The highest number of reported fire incidents - 80 took place in 2006, and the least - 35 in 2015. The data has a decreasing trend.
The average number of yearly fire incidents per 10k residents in Anoka, MN compared to nearest cities:
(Note: Based on data for the last 3 years, including only cities with population 5,000 and above)
| Anoka: | 32.2 |
| Champlin: | 12.0 |
| Coon Rapids: | 20.4 |
| Andover: | 14.2 |
| Ramsey: | 15.8 |
| Maple Grove: | 9.9 |
| Brooklyn Park: | 30.2 |
| Blaine: | 16.9 |
| Rogers: | 22.1 |
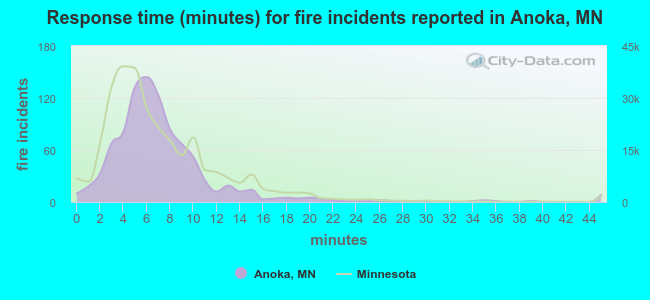 The median response time based on all reported fire incidents is 6 minutes. This is about the same as the state median value.
The median response time in Anoka, MN compared to nearest cities:
(Note: Based on data for all years, including only cities with at least 500 fire incidents)
| Anoka: | 6 minutes |
| Champlin: | 9 minutes |
| Coon Rapids: | 5 minutes |
| Andover: | 8 minutes |
| Ramsey: | 7 minutes |
| Maple Grove: | 7 minutes |
| Brooklyn Park: | 5 minutes |
| Blaine: | 7 minutes |
| Rogers: | 7 minutes |
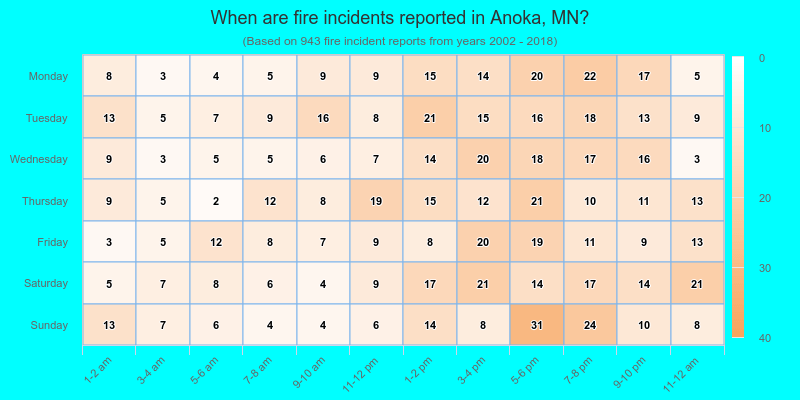
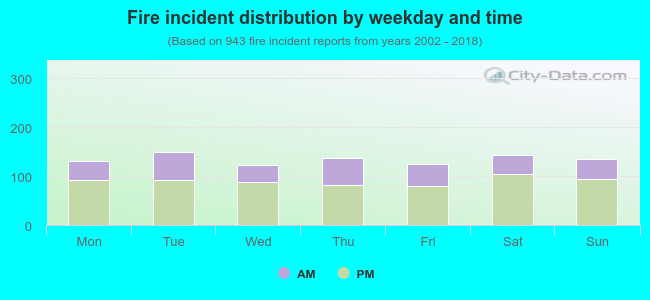 32.8% incidents where reported in the morning and 67.2% in the evening. The most fires (15.9%) took place on Tuesday, and the least (13.0%) on Wednesday.
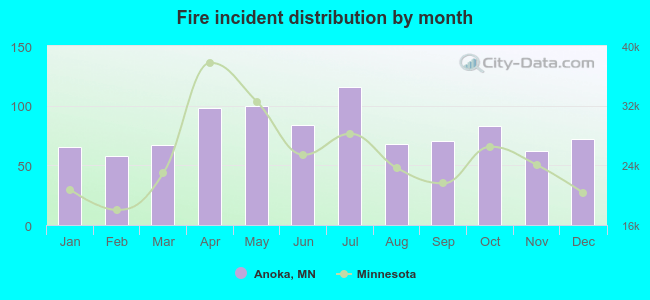 According to the 943 fire incidents from years 2002 - 2018 most fires (12.3%) took place during July, and the least (6.2%) in February.
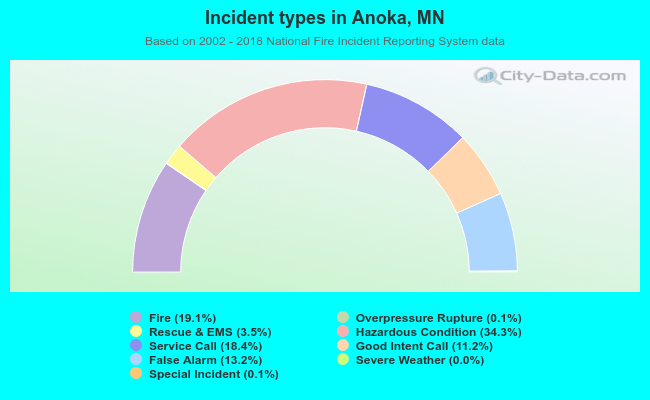 Out of all 4,929 cases reported during the years 2002 - 2018, the most belonged to the categories: Hazardous Condition (34.3%), Fire (19.1%), and Service Call (18.4%).
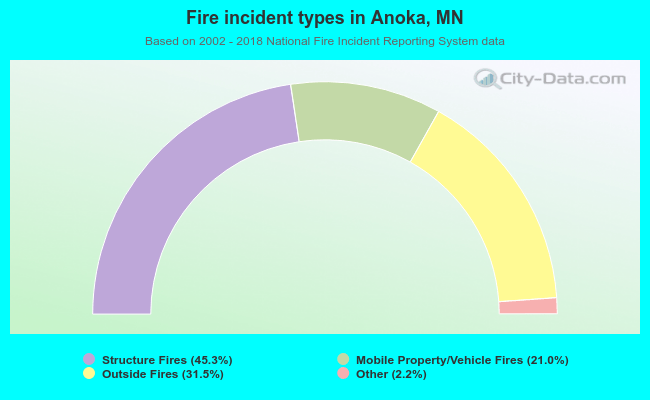 When looking into fire subcategories, the most incidents belonged to: Structure Fires (45.3%), and Outside Fires (31.5%).