Brooklyn Center: Fire Incidents, Minnesota (MN)
Where are fire incidents reported in Brooklyn Center, MN
Something went wrong! Please refresh the page.
| Fire incidents reported | |
|---|---|
| Sreet name | Count |
| BROOKLYN BLVD | 268 |
| HUMBOLDT AVE | 238 |
| 69TH AVE | 172 |
| NORTHWAY DR | 166 |
| 53RD AVE | 120 |
| CAMDEN AVE | 110 |
| 58TH AVE | 94 |
| 65TH AVE | 92 |
| SHINGLE CREEK PKWY | 92 |
| DUPONT AVE | 70 |
| 66TH AVE | 68 |
| XERXES AVE | 66 |
| FREEWAY BLVD | 64 |
| BRYANT AVE | 62 |
| 57TH AVE | 60 |
| BEARD AVE | 60 |
| UNITY AVE | 56 |
| 67TH AVE | 54 |
| 55TH AVE | 52 |
| FRANCE AVE | 50 |
| 70TH AVE | 48 |
| RUSSELL AVE | 48 |
| EARLE BROWN DR | 46 |
| EMERSON AVE | 44 |
| CO 10 | 42 |
| I 694 | 42 |
| GIRARD AVE | 40 |
| PONDS DR | 40 |
| COLFAX AVE | 38 |
| 694 FWY | 36 |
2002 - 2018 National Fire Incident Reporting System (NFIRS) incidents
- Incident types reported to NFIRS in Brooklyn Center, MN
- 4,35237.6%Rescue & EMS
- 2,06717.8%Fire
- 1,80915.6%Hazardous Condition
- 1,39512.0%Good Intent Call
- 1,39012.0%False Alarm
- 3613.1%Service Call
- 1631.4%Special Incident
- 430.4%Overpressure Rupture
- Fire incident types reported to NFIRS in Brooklyn Center, MN
- 1,13855.1%Structure Fires
- 47222.8%Outside Fires
- 45021.8%Mobile Property/Vehicle Fires
- 70.3%Other
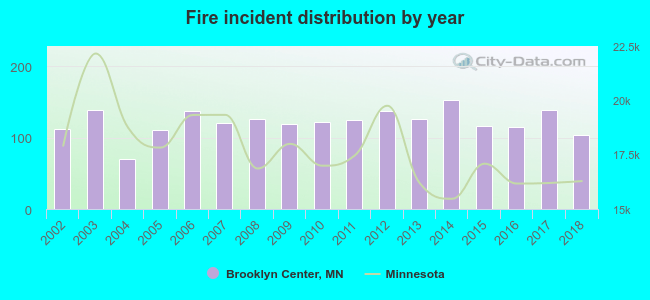 According to the data from the years 2002 - 2018 the average number of fire incidents per year is 122. The highest number of reported fires - 152 took place in 2014, and the least - 70 in 2004. The data has a dropping trend.
The average number of yearly fire incidents per 10k residents in Brooklyn Center, MN compared to nearest cities:
(Note: Based on data for the last 3 years, including only cities with population 5,000 and above)
| Brooklyn Center: | 38.6 |
| Brooklyn Park: | 30.2 |
| Fridley: | 45.8 |
| Robbinsdale: | 31.4 |
| Crystal: | 21.8 |
| Columbia Heights: | 33.0 |
| New Hope: | 25.3 |
| Spring Lake Park: | 22.7 |
| New Brighton: | 30.8 |
 The median response time based on all reported fire incidents is 6 minutes. This is about the same as the state median value.
The median response time in Brooklyn Center, MN compared to nearest cities:
(Note: Based on data for all years, including only cities with at least 500 fire incidents)
| Brooklyn Center: | 6 minutes |
| Brooklyn Park: | 5 minutes |
| Fridley: | 7 minutes |
| Robbinsdale: | 6 minutes |
| Crystal: | 5 minutes |
| Columbia Heights: | 5 minutes |
| New Hope: | 5 minutes |
| New Brighton: | 4 minutes |
| Golden Valley: | 7 minutes |
 Based on the reports from the years 2002 - 2018 the average number of fire-related yearly casualties is 1. The highest number of injuries - 7 took place in 2006, and the lowest - 0 in 2002. The data has a constant trend.
The average number of casualties per 1,000 fire incidents is 6. This indicator was the highest - 51 in 2006, and the lowest 0 in 2002. The trend for casualties per 1,000 fire incidents is constant. Compared to the Minnesota value the number of injuries per 1,000 fires is lower.
Based on the reports from the years 2002 - 2018 the average number of fire-related yearly casualties is 1. The highest number of injuries - 7 took place in 2006, and the lowest - 0 in 2002. The data has a constant trend.
The average number of casualties per 1,000 fire incidents is 6. This indicator was the highest - 51 in 2006, and the lowest 0 in 2002. The trend for casualties per 1,000 fire incidents is constant. Compared to the Minnesota value the number of injuries per 1,000 fires is lower.Casualties per 1,000 incidents in Brooklyn Center, MN compared to nearest cities:
(Note: Based on data for all years, including only cities with at least 500 fire incidents)
| Brooklyn Center: | 6.3 |
| Brooklyn Park: | 11.2 |
| Fridley: | 14.3 |
| Robbinsdale: | 1.7 |
| Crystal: | 13.1 |
| Columbia Heights: | 28.5 |
| New Hope: | 11.0 |
| New Brighton: | 25.8 |
| Golden Valley: | 2.1 |
 33.3% incidents where reported in the morning and 66.7% in the evening. The most fires (16.2%) took place on Saturday, and the least (13.3%) on Tuesday.
 According to the 2,067 fire incident reports from years 2002 - 2018 most fires (12.2%) took place during July, and the least (5.3%) in February.
 Out of all 11,580 cases reported during the years 2002 - 2018, the most belonged to the categories: Rescue & EMS (37.6%), Fire (17.8%), and Hazardous Condition (15.6%).
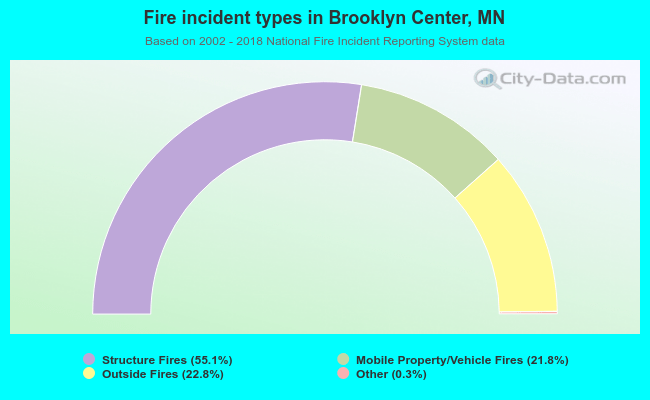 When looking into fire subcategories, the most reports belonged to: Structure Fires (55.1%), and Outside Fires (22.8%).