Manassas Park: Fire Incidents, Virginia (VA)
Where are fire incidents reported in Manassas Park, VA
Something went wrong! Please refresh the page.
| Fire incidents reported | |
|---|---|
| Sreet name | Count |
| MANASSAS DR | 182 |
| EUCLID AVE | 54 |
| CENTREVILLE RD | 52 |
| CABBEL DR | 42 |
| KIRBY ST | 40 |
| OLD CENTREVILLE RD | 30 |
| HOLDEN DR | 28 |
| KENT DR | 28 |
| WOODHUE DR | 24 |
| LAMBERT DR | 20 |
| SCOTT DR | 20 |
| OVERHILL DR | 18 |
| ANDREW DR | 16 |
| WHITE PINE DR | 16 |
| MARTIN DR | 14 |
| OWENS DR | 14 |
| COURTNEY DR | 12 |
| MOSEBY CT | 12 |
| PIERCE ST | 12 |
| SUDLEY RD | 12 |
| VENTURE CT | 12 |
| ADAMS ST | 10 |
| COLFAX DR | 10 |
| DENVER DR | 10 |
| FORREST ST | 10 |
| HANDERSON PL | 10 |
| MARKET ST | 10 |
| SANDSTONE WAY | 10 |
| COLBURN DR | 8 |
| JENKINS CT | 8 |
2003 - 2018 National Fire Incident Reporting System (NFIRS) incidents
- Incident types reported to NFIRS in Manassas Park, VA
- 2,70552.4%Rescue & EMS
- 73114.2%Hazardous Condition
- 63912.4%Fire
- 4027.8%Good Intent Call
- 2705.2%Service Call
- 2084.0%False Alarm
- 1953.8%Special Incident
- 130.3%Overpressure Rupture
- Fire incident types reported to NFIRS in Manassas Park, VA
- 29446.0%Structure Fires
- 24137.7%Outside Fires
- 7211.3%Mobile Property/Vehicle Fires
- 325.0%Other
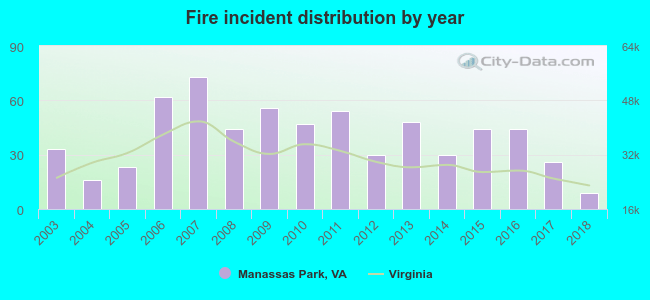 Based on the data from the years 2003 - 2018 the average number of fires per year is 40. The highest number of fires - 73 took place in 2007, and the least - 9 in 2018. The data has a declining trend.
The average number of yearly fire incidents per 10k residents in Manassas Park, VA compared to nearest cities:
(Note: Based on data for the last 3 years, including only cities with population 5,000 and above)
| Manassas Park: | 17.4 |
| Yorkshire: | 1.3 |
| Manassas: | 101.6 |
| Centreville: | 14.7 |
| Fairfax Station: | 26.3 |
| Chantilly: | 39.8 |
| Gainesville: | 42.1 |
| Fairfax: | 120.5 |
| Burke: | 11.0 |
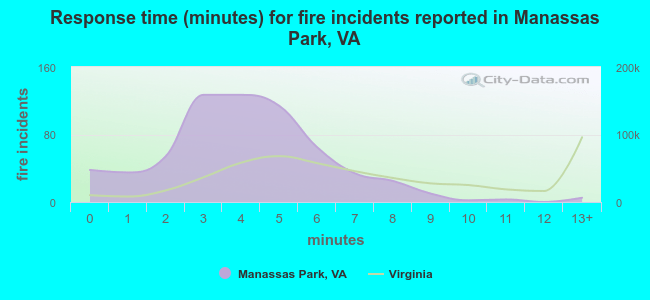 The median response time based on all reported fire incidents is 4 minutes. This is lower compared to the state median value.
The median response time in Manassas Park, VA compared to nearest cities:
(Note: Based on data for all years, including only cities with at least 500 fire incidents)
| Manassas Park: | 4 minutes |
| Manassas: | 5 minutes |
| Centreville: | 6 minutes |
| Chantilly: | 6 minutes |
| Fairfax: | 6 minutes |
| Lorton: | 6 minutes |
| Vienna: | 5 minutes |
| Annandale: | 5 minutes |
| Woodbridge: | 5 minutes |
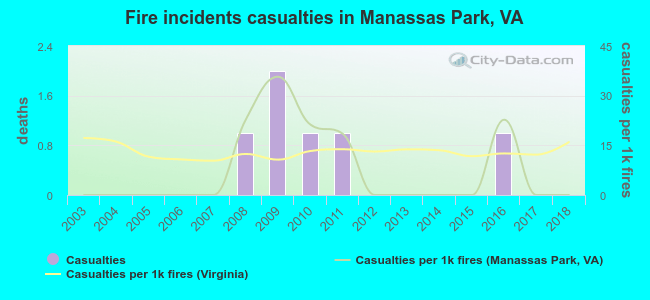 Based on the data from the years 2003 - 2018 the average number of fire-related casualties per year is 0. The highest number of injuries - 2 took place in 2009, and the lowest - 0 in 2003. The data has a constant trend.
The average number of casualties per 1,000 fires is 8. This indicator was the highest - 36 in 2009, and the lowest 0 in 2003. The trend for casualties per 1,000 fire incidents is constant. Compared to the Virginia value the number of injuries per 1,000 fires is lower.
Based on the data from the years 2003 - 2018 the average number of fire-related casualties per year is 0. The highest number of injuries - 2 took place in 2009, and the lowest - 0 in 2003. The data has a constant trend.
The average number of casualties per 1,000 fires is 8. This indicator was the highest - 36 in 2009, and the lowest 0 in 2003. The trend for casualties per 1,000 fire incidents is constant. Compared to the Virginia value the number of injuries per 1,000 fires is lower.Casualties per 1,000 incidents in Manassas Park, VA compared to nearest cities:
(Note: Based on data for all years, including only cities with at least 500 fire incidents)
| Manassas Park: | 9.4 |
| Manassas: | 5.1 |
| Centreville: | 0.0 |
| Chantilly: | 4.3 |
| Fairfax: | 1.2 |
| Lorton: | 0.0 |
| Vienna: | 0.0 |
| Annandale: | 6.0 |
| Woodbridge: | 0.0 |
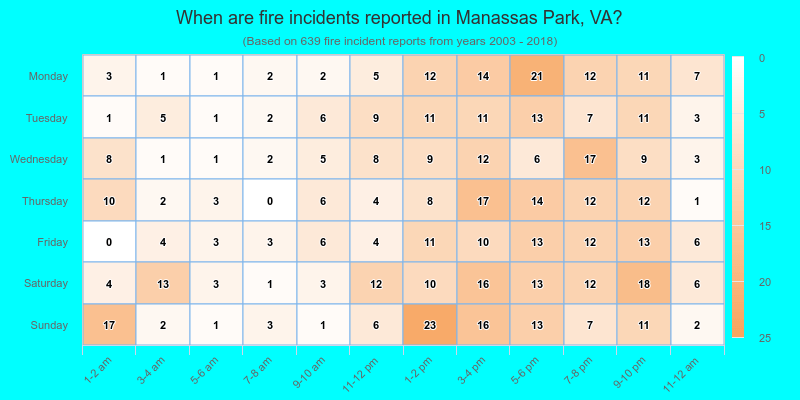
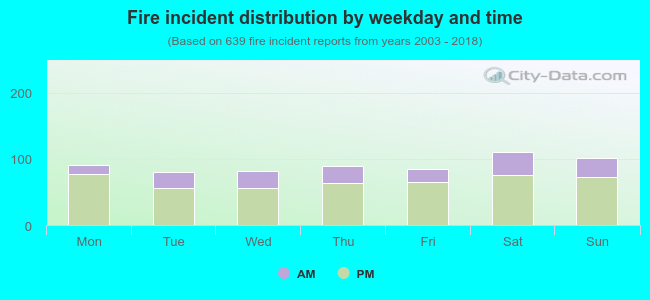 27.2% incidents where reported in the morning and 72.8% in the evening. The most fires (17.4%) took place on Saturday, and the least (12.5%) on Tuesday.
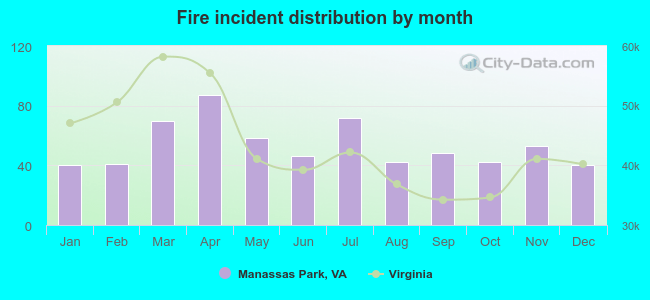 Based on the 639 fire incident reports from years 2003 - 2018 most fires (13.6%) took place during April, and the least (6.3%) in January.
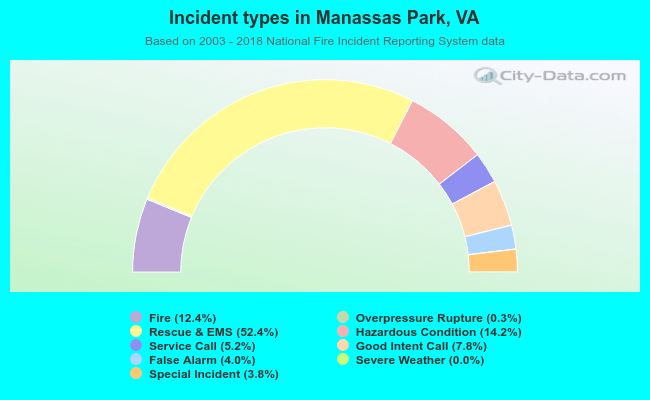 Out of all 5,164 cases reported during the years 2003 - 2018, the most belonged to the categories: Rescue & EMS (52.4%), Hazardous Condition (14.2%), and Fire (12.4%).
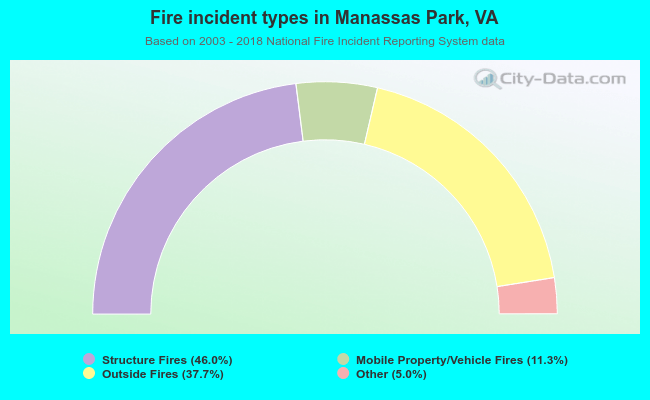 When looking into fire subcategories, the most reports belonged to: Structure Fires (46.0%), and Outside Fires (37.7%).